EURUSD _ H1 - BREAKOUT — BULLS TAKING CONTROL!📊 Description: OANDA:EURUSD
EUR/USD has delivered a strong breakout and retest from the descending channel while bouncing sharply from the major demand/support zone. Buyers defended the lower red zone perfectly, showing clear accumulation and momentum shift. Price is now pushing higher with bullish structure, and if current momentum continues, the next upside targets are the marked resistance zones above. This setup suggests sellers are losing control while bulls prepare for continuation.
🔑 Key Levels:
Major Support Zone: 1.1667 – 1.1690
Immediate Resistance: 1.1790
Psychological Resistance: 1.1820
Bullish Invalidation: Break below 1.1665
📌 Trading Insight:
As long as price remains above the support zone and broken channel, bullish bias remains strong. Pullbacks into support may attract fresh buyers for the next expansion higher.
👍 Support This Analysis If you found this idea useful:
👍 Like this analysis
💬 Drop your view in the comments – Bullish or Bearish?
🔔 Follow for more high-probability setups
Your support helps grow and share valuable trading insights 🚀
⚠️ Disclaimer
This content is for educational purposes only
Forex market

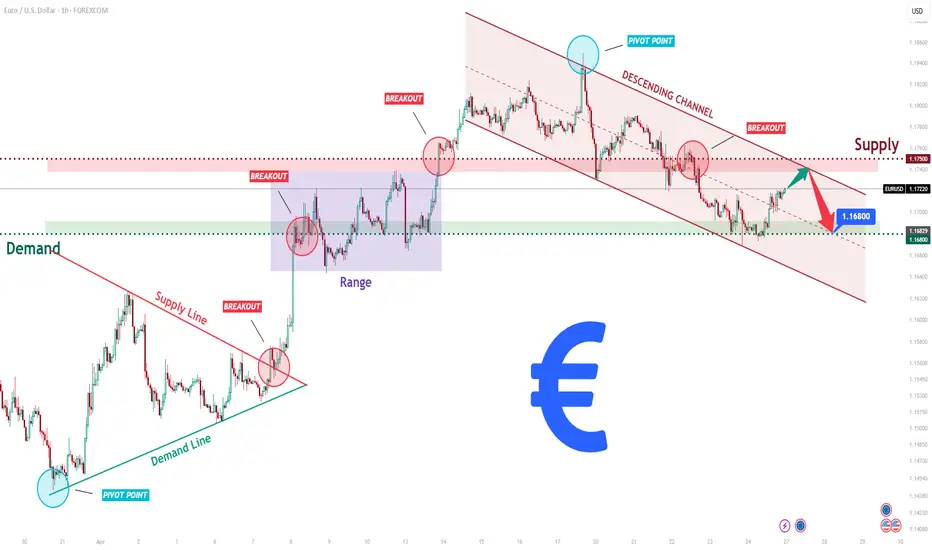
EURUSD Short: In Descending Channel — 1.1680 Support in FocusHello traders! Here’s my technical outlook based on the current EURUSD (1H) chart structure. EURUSD was previously trading under pressure from sellers and buyers forming a triangle. After several breakout attempts, the price managed to break above the structure and entered a short-term consolidation range. After that, the market rose but faced a reversal at the pivot point, signaling strong resistance.
Currently, price is trading back inside the descending channel and approaching the 1.1750 supply zone, while holding above the 1.1680 demand zone. A recent reaction from the channel resistance suggests increasing selling pressure.
As long as EURUSD remains below the 1.1750 resistance and respects the descending channel, the bearish bias remains valid. A rejection from this area could push price toward the 1.1680 support (TP1). Manage your risk!
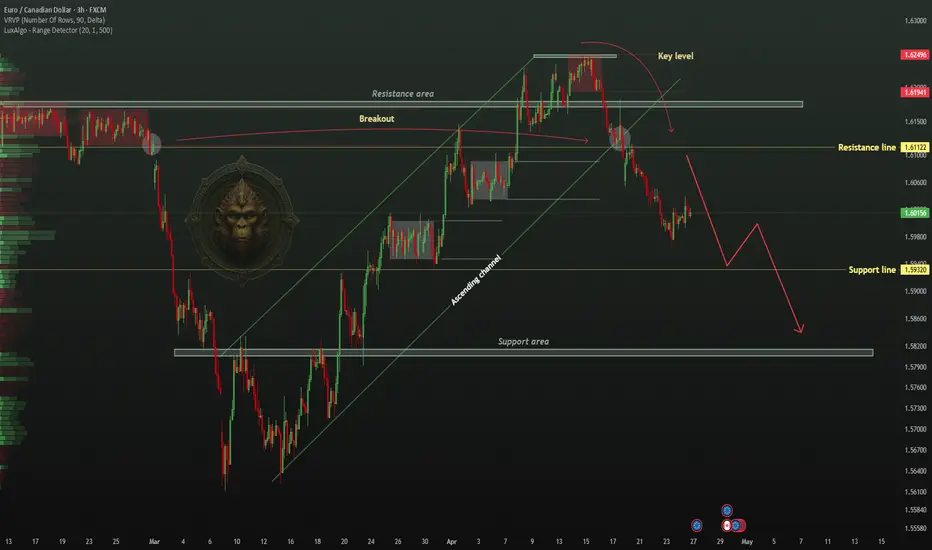
TheGrove | EURCAD Sell | Idea Trading AnalysisYou can expect a reaction on Ascending channel, the direction of selling from the specified Resistance line,
EURCAD moving higher as it tests the strong resistance level..
We expect a bearish move from the confluence zone.
Hello Traders, here is the full analysis.
I think we can soon see more fall from this range! GOOD LUCK! Great SELL opportunity EURCAD
I still did my best and this is the most likely count for me at the moment.
-------------------
Traders, if you liked this idea or if you have your own opinion about it, write in the comments. I will be glad 🤝
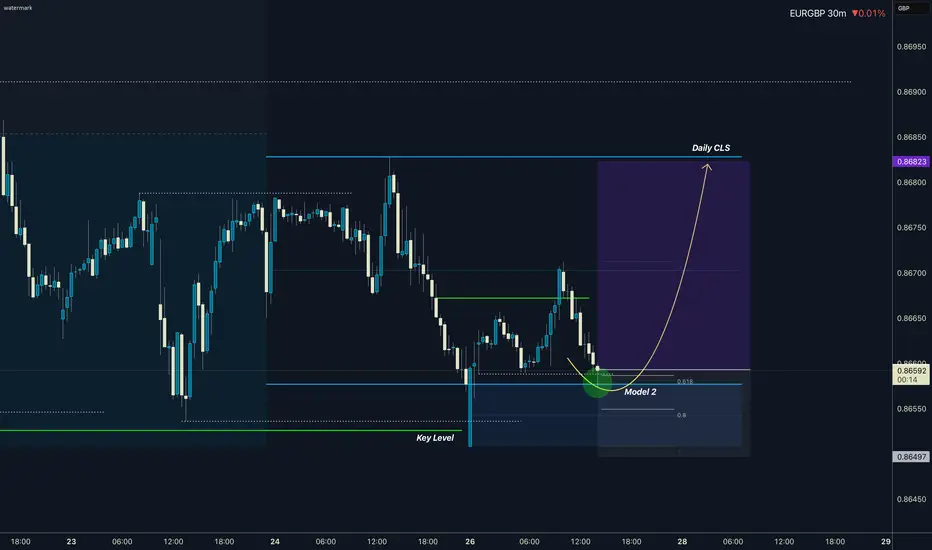
EURGBP Daily CLS Model 2Bullish Model 2
Hi Friends, Model 1 has already played out and price has made a pullback to the Model 2 zone. Im looking for long from this this key level. As always SL should be above the protected swing. Confirmation switch on LTF is advantage.
⏳ Stay patient Model2 dynamics is usually slower.
🎯 Target: Full CLS range.
🎥 CLS Model 2 Video Explanation 📚 Bullish CLS Strategy Structure ⚠️ Risk Control is Key to Long Term Success
📍 Always place a proper stop loss
📍 Manage your risk per trade
📍 Stay disciplined & avoid emotional trading
📍Take the Trade only if you understand logic behind it
📍 Protect Capital First
🚀Boost | 🔁 Share | 💬 Comment | ✅Follow for more CLS setups
Adapt useful, Reject useless and add what is specifically yours.
David Perk
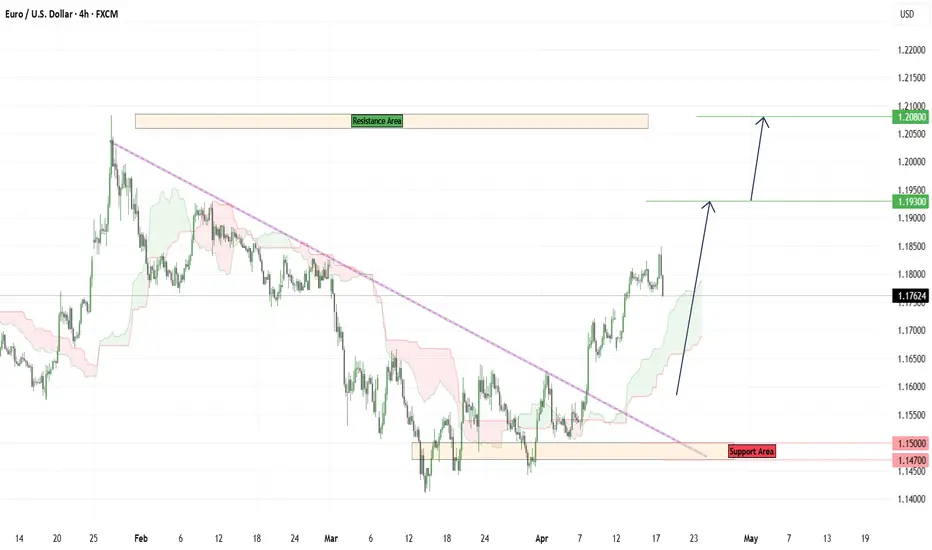
EURUSD – Market Long AnalysisEURUSD – Market Structure Analysis
After an extended corrective phase, EURUSD formed a solid consolidation base, reflecting a period of accumulation. The recent strong bullish impulse indicates a shift in sentiment, as price successfully broke above the descending trendline and short-term resistance, confirming early bullish strength.
At the moment, price is holding above the reclaimed structure and building support around the recent breakout zone. This behavior highlights increasing buyer control, and as long as this structure remains valid, further upside continuation remains favorable.
📊 Key Trading Scenarios
✅ Bullish Scenario 🚀
* Price maintains strength above the 1.1700 – 1.1650 support region
* Continued formation of higher highs & higher lows confirms bullish structure
🎯 Target 1: 1.1930
🎯 Target 2: 1.2080
❌ Bearish Scenario ⚠️
* A confirmed breakdown below 1.1500 may weaken bullish momentum
🎯 Downside Target 1: 1.1470
🎯 Downside Target 2: 1.1400
📍 Critical Levels to Monitor
🔴 Immediate Resistance: 1.1930
🔴 Major Resistance: 1.2080
🟢 Key Support Zone: 1.1700 – 1.1650
⚠️ Trading Insight
Price is currently reacting after a strong bullish breakout and is holding above a key support region. Sustaining above this level would strengthen the bullish continuation outlook, while a failure to hold may trigger a corrective move toward lower demand zones.
Note:
This analysis is based on current price action and market structure. Market conditions can change at any time—always apply proper risk management.
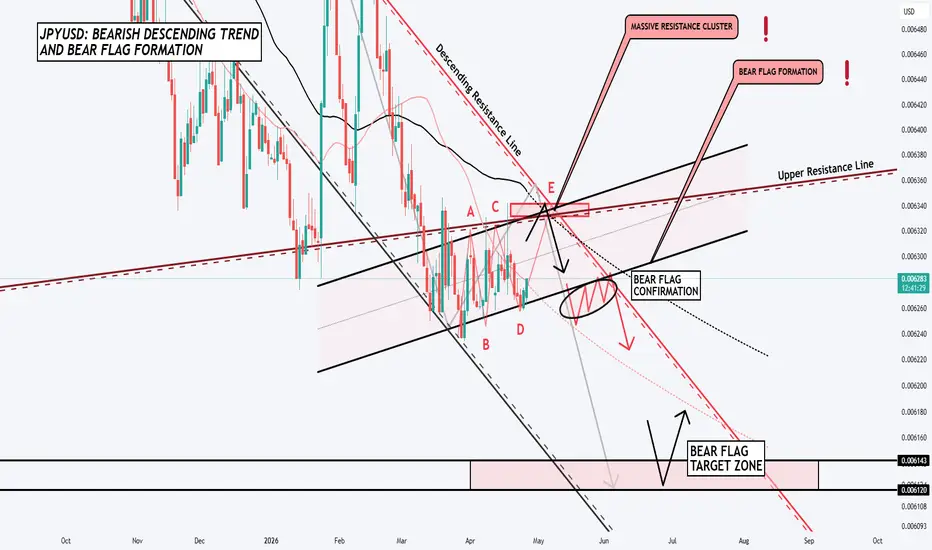
JPYUSD: Descending Trend and Bear-Flag Point to Bearish Target!Hello There,
welcome to my new analysis about JPYUSD on the daily timeframe perspective. JPYUSD emerged with strong bearish pressure increasing bearish alignments and is forming one lower low after another. Right now, I have spotted a lot of signs that point towards the bearish direction's continuation.
When looking at my chart, we can watch there how JPYUSD pulled back from this crucial descending resistance line several times. This is a strong resistance, which will likely keep being a resistance within the next times. Also, JPYUSD has this upper resistance line as a major resistance.
The fact that JPYUSD now trades below the upper resistance line makes it a really bearish setup. Below this structure, JPYUSD is forming this determining bear flag formation. The formation is going to complete with a pullback from the massive resistance cluster as seen in my chart.
Once the pullback happens and JPYUSD continues to the downside, it is going to activate the bear flag target zone with a final breakdown below the bear flag lower boundary. Right now, there is not a high possibility of JPYUSD reversing to the bullish side because the resistances and bearish signs are just too strong.
Once the formation has been completed and the final targets reached, further assumptions need to be made. It will be important to determine if JPYUSD has the ability to reverse once the final targets have been reached.
In this manner, thank you a lot for watching!
The support is highly appreciated.
VP
27.04.26 Daily ForecastPairs on Watch -
FX:GBPJPY : This pair is positioned at the highs in a similar structure to USDJPY, however this pair is in session where we know momentum can step in quickly and the small stacks in price can go sooner than we think. I am waiting for price to break out of the small piece of consolidation its currently in and then any lower timeframe continuations I will look to get short.
FX:USDJPY : Price is still looking bullish and has a reason to head to the highs with them being unfulfilled. We can see an expanding type structure is currently forming where it almost becomes a running channel to break out to the upside, if this happens I will look for a lower timeframe flag to get long. The base may not be in just yet which is fine, a bit of patience and wait for the conformation.
FX:GBPUSD : With where the DXY is positioned we could get a position shape up on this pair in either direction. With the gap on the DXY it is whether the fill was enough for it to continue selling, if that is the case we could see price break above the high on GBPUSD and form a continuation where we can get long into the next high.

Euro Bullish Channel - Potential Move to 1.1790 After CorrectionHello traders! Here is my technical outlook based on the current EURUSD (3H) chart structure. EURUSD previously traded within a range, showing consolidation before a breakdown that confirmed bearish pressure. After the drop, price found a bottom and initiated a recovery phase, forming an ascending channel with higher lows. Currently, price is holding above the 1.1710 buyer zone, which acts as strong support, while approaching the 1.1790 resistance level (seller zone). At the same time, a breakout from the previous structure and continued respect of the trendline indicate growing bullish momentum. As long as EURUSD holds above the 1.1710 support and respects the ascending channel, the bullish bias remains valid. A potential bounce from this zone could push price toward the 1.1790 resistance (TP1). Please share this idea with your friends and click Boost 🚀

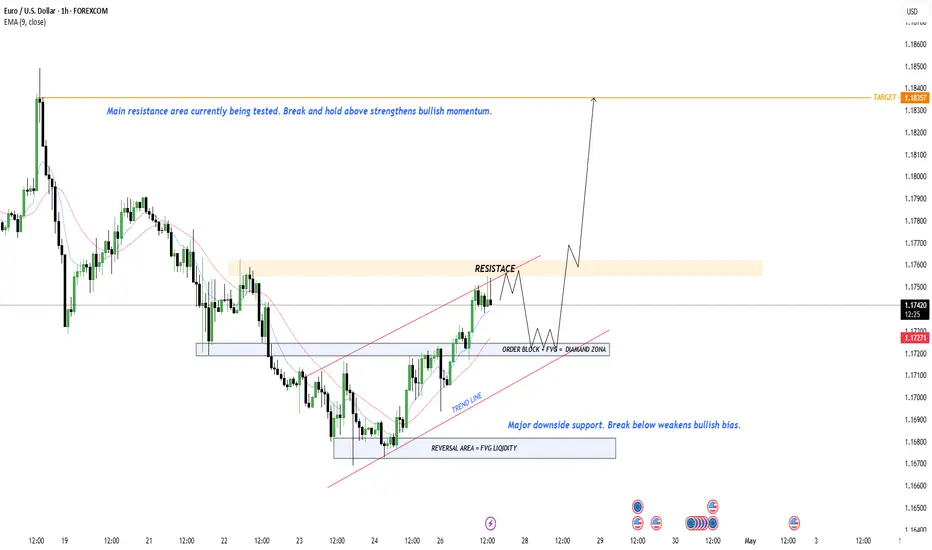
EURUSD 1H: Approaching Resistance After Trendline BounceEURUSD is approaching a key resistance zone after a bullish move from the order block and trendline support. The structure shows higher lows, indicating strengthening bullish momentum while price remains supported above the demand zone.
If price breaks and holds above the 1.1760 resistance area, continuation toward the 1.1835 target becomes more likely. However, rejection from resistance could lead to a pullback toward the 1.1720 order block support before another bullish attempt.
Bias:
Bullish while price holds above the order block and trendline support, with upside potential toward 1.1835.
Educational purposes only — not financial advice.
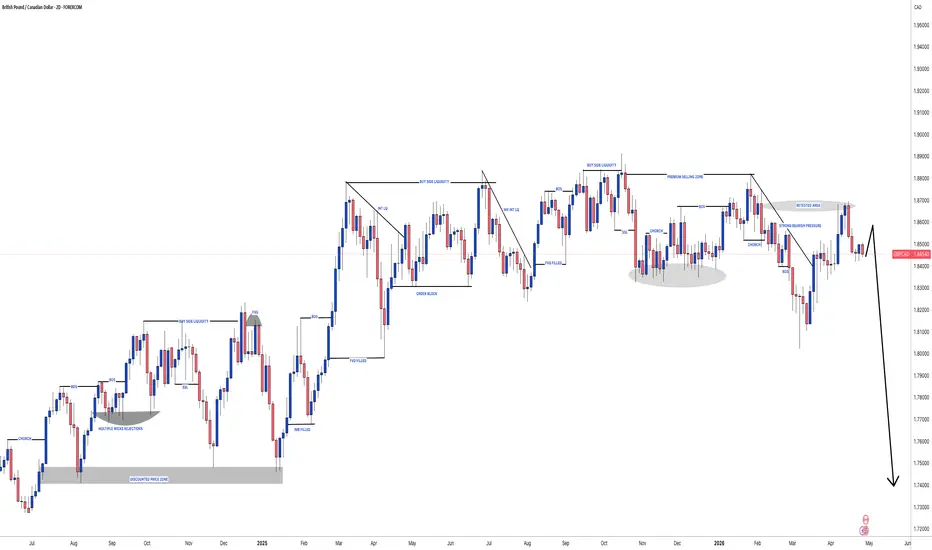
#GBPCAD: Up To +1100 Pips Selling Opportunity, One Not To Miss! Dear fellow traders,
The GBPCAD pair has been consolidating for two days. It’s trading in a range pattern and hasn’t shown a clear trend yet. To confirm a trend for this trade, we need a strong bearish impulse move that pushes the price to its yearly low. As shown on the chart, we can enter the trade and set our take profit at the arrow end.
Good luck and trade safely!
The Setupsfx_ Team
Descending Trendline Breakout – Bullish Targets Ahead Price has decisively broken above a strong descending trendline that had been acting as dynamic resistance for an extended period, indicating a clear shift in market structure. This breakout suggests that sellers are losing control while buyers are stepping in with increased momentum.
Before the breakout, price was consolidating near a well-defined demand zone, showing signs of accumulation. The move above the trendline confirms bullish intent, especially as price is now attempting to hold above this level—potentially turning previous resistance into new support.
If this structure holds, the market is likely to continue its upward move toward the next key resistance levels marked as targets at 187.311 and 187.707. These zones represent areas where price may face reactions, but a strong bullish push could lead to continuation beyond them.
Overall, as long as price maintains support above the broken trendline and continues forming higher lows, the bullish outlook remains valid. Any rejection or breakdown below the trendline, however, could signal a false breakout and shift the market back into consolidation or bearish pressure.

EURUSD Bearish Reversal at Resistance – Shorts FavouredEUR/USD is currently experiencing a bearish trend, confirmed by both technical indicators and fundamental factors chart shows price within a descending channel, forming lower highs and lower lows, indicating sellers are in control.
EURUSD the trend remains bearish, with the EMA50 providing dynamic resistance. The Elliott Wave pattern and price action point to a further drop below 1.1700, confirming the downward momentum. If 1.1700 breaks, the pair could quickly head toward 1.1625, which is a crucial support level. on the fundamental side, the US Dollar remains strong due to ongoing inflationary concerns and hawkish Fed expectations, delaying rate cuts into late 2026. This is keeping US yields elevated, further pushing the dollar up and applying pressure on EUR/USD. Additionally, geopolitical tensions in the Middle East are fueling a risk-off sentiment, where the dollar benefits as a safe haven. On the euro side, Germany's growth forecast has been downgraded, and overall Eurozone growth is slowing, adding further bearish pressure to the EUR.
Moreover, the European Central Bank (ECB) remains uncertain about future rate hikes, which is making investors cautious about the euro, despite rising inflation from energy costs linked to the ongoing conflict in the Middle East. The ECB's indecision about further tightening contrasts with the Fed’s clear stance, creating further divergence between the euro and dollar.
Tecnically the combination of strong US fundamentals, weak Eurozone outlook, and bearish technical signals all suggest that EUR/USD will likely continue to trend lower, targeting 1.1660 and 1.1625. A break below these levels could lead to further downside, with key levels around 1.1600 to watch closely.
You may find more details in the chart,
Trade wisely best of luck buddies.
Ps; Support with like and comments for better analysis Thanks for Supporting.

GBP/USD: The Big Squeeze! Bullish Breakout Incoming?Cable is showing some serious high-voltage action on the 4-hour chart. We are currently witnessing a massive battle at the Strong Resistance Line, and the bulls look like they are winning the war of attrition.
The Current Tape 📽️
After a period of heavy volatility, the price has settled into a very tight Triangle Pattern right under the major diagonal ceiling. In trading, when a pair consolidates at the very top of a range rather than rejecting it, it usually suggests that big players are absorbing the selling pressure to prepare for a breakout.
Why I’m Watching 1.3550 🔍
The Accumulation: Notice the sequence of higher lows within the triangle. Every dip is being bought faster than the last one.
The Resistance: We have touched this macro line multiple times. The more a level is tested, the weaker it becomes.
The Projected Path: I’m expecting a brief liquidity hunt—maybe a quick wick lower to grab some stops—followed by a sharp impulsive move above the resistance.
The Roadmap 🎯
Trigger Zone: A clean 4H candle close above 1.3550 is the green light.
Primary Target: 1.3650 (The next major structural peak).
The Safety Net: As long as we hold above 1.3480, the bullish thesis remains the dominant play.
Summary 💡
Don't get chopped up in the sideways movement. The real money will be made on the breakout confirmation. If the bulls can flip this "Strong Resistance" into a new floor, we could see a very fast run toward the 1.3700 handle.
What’s your take? Are you waiting for the 1.3550 break or are you already positioned? Drop your thoughts below! 👇

EUR/CAD: Strong Bearish Pressure📉EURCAD is currently experiencing significant bearish pressure this morning.
A bearish breakout of the support line of a flag pattern, observed within a clear intraday downtrend on an hourly timeframe, provides strong confirmation of this movement.
I anticipate that the price will soon reach the 1.5967 level.

USDCHF – Follow the Trend!USDCHF is currently trading below a strong resistance / supply zone.
This area has acted as resistance multiple times before… and now it’s being retested again.
As long as price holds below this zone, the bias remains bearish and we will be looking for trend-following short setups.
Clean structure. Clear level. Simple plan.
Will sellers step in again? 🤔
⚠️ Disclaimer: This is not financial advice. Always do your own research and manage risk properly.
📚 Stick to your trading plan regarding entries, risk, and management.
Good luck! 🍀
All Strategies Are Good; If Managed Properly!
~Richard Nasr

EURJPY - The end of the correction will lead to an uptrend FX:EURJPY remains in a bullish trend. Signs of the correction coming to an end are emerging, which generally gives the market a chance to continue its upward movement.
The currency pair has been in a bullish trend since last March. Technically, the bullish structure remains intact. The weak Japanese yen is supporting the euro’s upward movement.
Technically, the price is breaking through the resistance of the local correction and local consolidation. If the bulls keep the price above 186.8–186.87, we can expect growth to continue in the medium term.
Resistance levels: 187.92, 187.70
Support levels: 186.87, 186.43
A retest of 186.87 and price consolidation above that level will confirm the price’s readiness for growth. Zones of interest: 187.7–187.95
Best regards, R. Linda!

GBPUSDHello Traders! 👋
What are your thoughts on GBPUSD?
The GBPUSD chart is currently at a critical decision zone, with price reacting to a strong cluster of resistance factors.
Price continues to move within a descending channel, indicating that the overall trend remains bearish unless a valid breakout occurs.
The highlighted resistance area is acting as a strong supply zone, where sellers have repeatedly stepped in and pushed price lower.
The 0.618 Fibonacci level is perfectly aligned within this zone, adding further strength to the resistance.
As long as price remains below this resistance area, the dominant bias stays bearish, and it is expected that after some consolidation in this zone, price will move toward lower targets.
Feel free to like and share your thoughts in the comments! ❤️
EURUSD: Massive 1:9 RR Trade | RBS & Gap ConfluenceRBS zone (Resistance Become Support). The second zone is a 4H timeframe Gap, which aligns with the 8H timeframe. Price got rejected on the 1H timeframe. Stop Loss is 13 pips, and the target is 126 pips. We need a 1H candle close below 1.16792 to continue towards the final target

GBPUSD Downtrend Continuation: Sellers in ControlGBP/USD is showing a bearish reaction mainly due to a confluence of technical resistance and underlying fundamental pressure.
GBPUSD the market likely performed a buy-side liquidity sweep above recent highs, triggering stop orders before reversing downward. This is a common smart money pattern that leads to bearish continuation On the fundamental side, the move is supported by relative strength in the US Dollar and/or weakness in the British Pound. This can be driven by factors such as:
On the technical side, price rallied into a strong resistance / supply zone around 1.3550–1.3580, which has previously acted as a rejection area. The market attempted to break higher but failed, forming rejection wicks and weak follow-through, indicating that buyers are losing strength. Additionally, price respected a descending trendline, confirming that the upside momentum is limited. This type of behaviour often signals a distribution phase, where institutional traders sell into buying pressure.
You may find more details in the chart,
Trade wisely best of luck buddies.
Ps; Support with like and comments for better analysis Thanks for Supporting.

USDCAD - BEARISH MOVE!Hello traders,
the USDCAD price has formed a rectangle pattern.
Currently, the support level (1.36436 – 1.36312) is broken,
so I expect a bearish move.
🎯 TARGET: 1.35810

EURUSD - H4 - Wave 4 completedI think wave 4 is complete, so we expect a price rally that should take last high.
There is an AB=CD pattern also (yellow).
Best Regards.

Selling EURUSD I’m looking for sells on EURUSD at a fib level currently we could counter trend and be in buys as long as it bounces on the fib above

AUDCAD Potential Upsides! Hey Traders, in today's trading session we are monitoring AUDCAD for a buying opportunity around 0.97600 zone, AUDCAD is trading in an uptrend and currently is in a correction phase in which it is approaching the trend at 0.97600 support and resistance area.
Trade safe, Joe.
