GOLD - Technical AnalysisICMARKETS:XAUUSD bounced off the 4668 support level toward the end of Friday’s session following a long squeeze, thereby breaking the local bearish structure. The market’s next move depends on geopolitical developments.
The dollar closed Friday in the red, and technically, the index looks poised to continue its decline. Oil is stagnant. Gold, technically, is still under pressure from bears, but Friday’s session closed above Thursday’s close, which gives us positive signals, provided that the fundamental and geopolitical backdrop supports the market. (The previous idea—a break below 4668—remains valid, provided gold returns to that level.) This coming week, all eyes are on the U.S.-Iran negotiations, as well as fundamental data: the Fed’s rate decision, the regulator’s meeting, and GDP and inflation figures.
Resistance levels: 4740, 4795
Support levels: 4668, 4644, 4600
Technically, at the moment, I expect a bounce from 4700 (4688) and a retest of the 4740 liquidity zone. A close above 4740 will open the door for continued growth toward 4800.
However, if the price fails to react at 4700 and retreats to 4668, the likelihood of a further decline will resume.
Best regards, R. Linda!
Wave Analysis

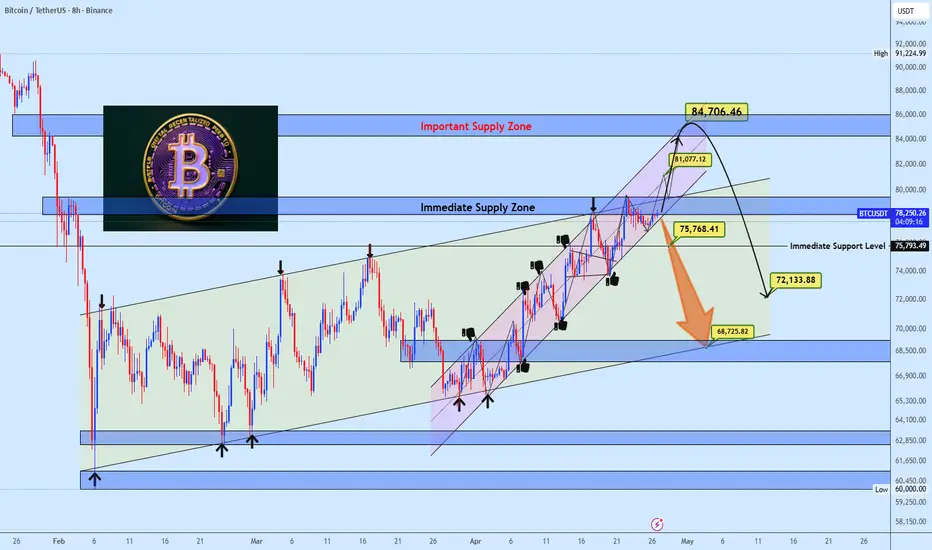
Bitcoin at Make or Break Zone 84K? or Back to 68K?Bitcoin is testing a high confluence resistance zone at 79K–80K right now. This level sits directly on the upper boundary of the major ascending channel (higher timeframe) a proven supply zone that has repeatedly rejected price in the past.
The broader structure is still bullish, but the current impulsive leg looks extended after completing a clean 5-wave move. We are now transitioning into a potential Wave 5 extension, which often produces one final push into the 81K–84K supply zone before exhaustion kicks in a classic fakeout scenario.
Momentum is already fading as price grinds into resistance. This raises the risk of a short-term top, though it could also play out as consolidation before the next leg higher.
Bearish scenario (higher probability if rejected here):
Break and close below 75K support confirms weakness → initial target 72K, then deeper pullback into the 68.7K–68K demand zone (lower channel boundary).
Bullish scenario:
Clean breakout + sustained close above 84K invalidates the rejection thesis and opens the path toward $102k.
Price is at a decisive inflection point, and the reaction here will define the next major move.
Bitcoin Rally Failed Near the Top — Is a Bigger Drop Next?As I expected at the start of the week—just like I mentioned in the previous daily timeframe post — Bitcoin ( BINANCE:BTCUSDT ) began to decline from around the resistance lines, resistance zone($79,500-$78,750), and the 21_SMA(Weekly). In recent hours, this decline has been continuing with solid momentum.
From a classical technical analysis standpoint, it looks like Bitcoin, on the 4-hour timeframe, is forming an Adam & Adam Double Top Pattern(AADT) —one of the valid types of double-top patterns. A notable sign is that the right top is approaching the neckline with strong momentum, which adds to the pattern’s reliability.
From an Elliott Wave Theory perspective, it seems Bitcoin has completed its main wave 4 right near the resistance lines.
Also, we can see a negative Regular Divergence(RD-) between the last two peaks.
Since the S&P500 index ( FX:SPX500 ) is near its all-time highs, we must also keep an eye on it. If the S&P corrects from these highs, Bitcoin’s decline could be amplified due to their correlation. This increases the likelihood of further downside.
I expect that after breaking the support zone ($77,160-$76,740) and the neckline, Bitcoin could drop at least to around $74,900. If the downward momentum is strong, we could look for lower targets.
Target: $74,900
Stop Loss: $81,000(Worst)
Cumulative Short Liquidation Leverage: $80,100-$79,540
Cumulative Long Liquidation Leverage: $76,980-$76,200
Cumulative Long Liquidation Leverage: $74,500-$73,500
CME gap: $84,560-$79,660
CME gap: $69,535-$70,055
CME gap: $67,570-$67,170
What’s your view on Bitcoin? Could it push toward $80,000, or should we anticipate a deeper correction?
💡 Please respect each other's opinions and express agreement or disagreement politely.
📌Bitcoin Analysis (BTCUSDT), 4-hour time frame.
🛑 Always set a Stop Loss(SL) for every position you open.
✅ This is just my idea; I’d love to see your thoughts too!
🔥 If you find it helpful, please BOOST this post and share it with your friends.

WTI Crude Oil Price Analysis – Key Support and Resistance LevelsThis chart provides a professional overview of WTI Crude Oil (US Dollar) price action, highlighting critical support and resistance levels. Key resistance at 108.80 USD suggests potential price rejection, while support
at 93.22 USD offers a strong foundation for possible bullish reversals. The trend line indicates overall bullish momentum, guiding price movement upwards, and traders should monitor for possible price action near these levels.
With target resistance at 113.53 USD, the market may continue to push higher, but price action at these critical zones will dictate the next move. Keep an eye on the support zone at 83.03 USD and 80.00 USD for potential reversals.

XRP – Compression Before Expansion?XRP is currently bullish, trading within a rising wedge in blue.
Momentum is building… but still waiting for confirmation.
For the bulls to take over and kick off the next impulse upward, a clean break above the minor red channel is needed 🚀
Until then, price remains in a compression phase.
Meanwhile, if XRP dips back into the accumulation zone, that would open the door for fresh trend-following long setups from value.
Structure is tightening… move is coming.
Which way do you see it breaking? 🐂🐻
⚠️ Disclaimer: This is not financial advice. Always do your own research and manage risk properly.
📚 Stick to your trading plan regarding entries, risk, and management.
Good luck! 🍀
All Strategies Are Good; If Managed Properly!
~Richard Nasr

EURJPY - The end of the correction will lead to an uptrend FX:EURJPY remains in a bullish trend. Signs of the correction coming to an end are emerging, which generally gives the market a chance to continue its upward movement.
The currency pair has been in a bullish trend since last March. Technically, the bullish structure remains intact. The weak Japanese yen is supporting the euro’s upward movement.
Technically, the price is breaking through the resistance of the local correction and local consolidation. If the bulls keep the price above 186.8–186.87, we can expect growth to continue in the medium term.
Resistance levels: 187.92, 187.70
Support levels: 186.87, 186.43
A retest of 186.87 and price consolidation above that level will confirm the price’s readiness for growth. Zones of interest: 187.7–187.95
Best regards, R. Linda!

EURUSD - H4 - Wave 4 completedI think wave 4 is complete, so we expect a price rally that should take last high.
There is an AB=CD pattern also (yellow).
Best Regards.

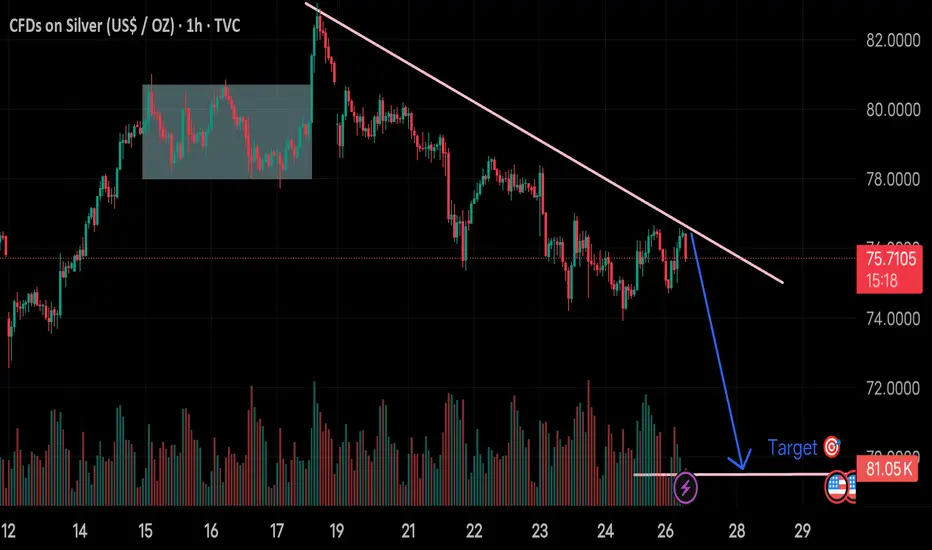
(Silver 1H chart)...(Silver 1H chart).
Price is trending down under a descending trendline
Recent structure shows lower highs + lower lows
I have already marked a horizontal support zone around ~70
Realistic downside targets
If that trendline holds and price rejects again:
Primary target:
70.0 – 69.5 (major support / liquidity zone — matches my marked area)
Extended target (if breakdown happens):
67.5 – 66.5 (next strong support range)
What needs to happen first
For my bearish target to play out cleanly:
Price should reject the trendline again (~76–77 area)
Then break below ~73.5 support with momentum
Invalidation
My idea weakens if:
Price breaks and holds above the trendline (~77.5–78)
Bitcoin at a Turning Point: Rally or Top? (12H)This analysis is an update of the one you can find in the related publications section.
The diametric structure we had identified for Bitcoin is still valid, but wave E has extended slightly.
In this update, we have optimized and revised the supply zone, and it is expected that wave E will complete within the red box.
However, since Bitcoin has broken a mid-term resistance trendline and there are still two waves remaining in the diametric pattern, we will consider two scenarios moving forward:
Scenario 1:
After the completion of wave E, if no deep drop occurs and wave F finishes within the green zone, Bitcoin could complete wave F, pull back to the broken trendline, and then form a strong bullish move as wave G potentially reaching up to the 90K range.
Scenario 2:
If wave F experiences a deep drop and the green zone is broken to the downside with strong 12 hour or daily candle bodies, it is likely that the top of this pattern has already been completed at wave E. In this case, we may not see significant bullish movement in wave G, and the price could move toward the 62K range.
Considering the ongoing tensions in the Middle East and how developments may impact the crypto market positively or negatively, we remain prepared for both scenarios. Therefore, monitor these key levels closely.
If you have a coin or altcoin you want analyzed, first hit the like button and then comment its name so I can review it for you.
Do you also think BITCOIN is bullish?

GOLD WEEKLY CHART MID/LONG TERM ROUTE MAPHey Everyone,
On the weekly timeframe, price action is currently consolidating within a defined range between the 4627 Goldturn support and the 4882 Goldturn resistance levels.
The market structure reflects a broader consolidation phase, with price respecting these key boundaries. As long as the 4627 support level holds with ema5, the probability remains for a continued push toward the 4882 resistance, where price may look to test the reaction zone.
Key confirmations to monitor:
A weekly candle body close above or below these levels and/or 5 EMA cross and lock above or below to confirm direction.
This will help determine whether the market is preparing for a breakout into a new range or continuation within the current structure.
From a structural perspective, the Goldturn ascending channel remains relevant.
A confirmed move beyond either boundary, supported by channel structure, will provide clearer direction for the overallall long term trend.
We will continue to track weekly developments and update accordingly as price action evolves.
Mr Gold

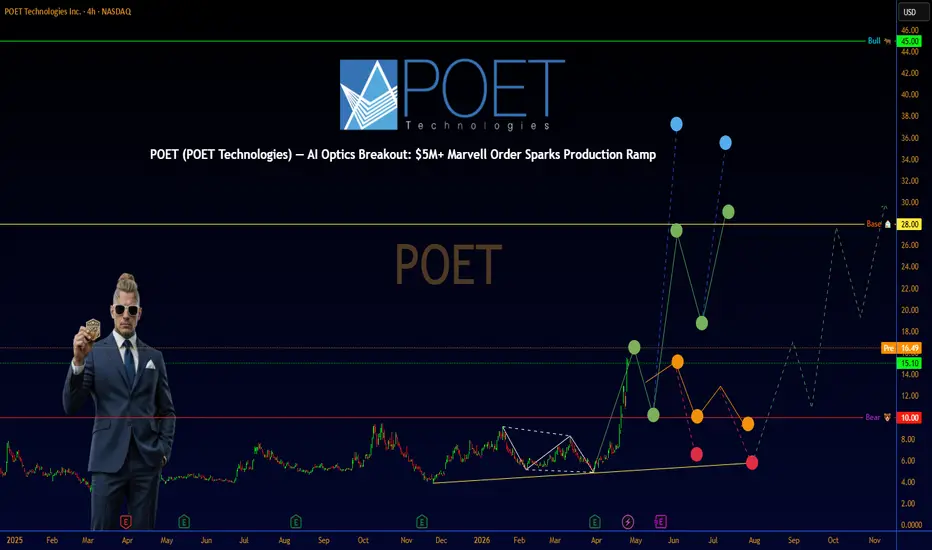
POET (POET Technologies) — AI Optics Breakout: $5M+ Marvell Ordr💡 POET (POET Technologies) — AI Optics Breakout: $5M+ Marvell Order Sparks Production Ramp
**SECTION 1 — Executive Summary** 💼
POET Technologies is at a pivotal commercialization inflection with its Optical Interposer platform solving critical power and bandwidth bottlenecks in AI data centers just as hyperscalers accelerate 800G/1.6T+ optical interconnect deployments. Recent confirmation of production orders exceeding $5 million from Marvell-linked customers plus massive capital raises position the company for its first meaningful revenue ramp in 2026. Overall rating: Buy. 12-month price target: $28 (blended DCF and peer comps methodology incorporating initial optical engine shipments plus TAM capture in AI photonics). The single biggest reason to own this stock right now is POET’s disruptive wafer-scale integration technology delivering lower cost/power optical engines at the exact moment AI infrastructure demand is exploding. The single biggest risk is execution slippage on volume production scaling against well-funded competitors.
**SECTION 2 — Business Overview** 🏢
POET Technologies develops and commercializes advanced photonic integrated circuits using its proprietary Optical Interposer platform that integrates lasers, modulators, detectors, and waveguides onto a single silicon chip for high-speed optical data transmission. Revenue breakdown (latest available): Primarily non-recurring engineering (NRE) and early product revenue from optical engines and light sources with 100 percent tied to AI/data center and telecom applications (no geographic split publicly detailed yet). Business model generates revenue through design wins, NRE fees, and high-margin optical engine/module sales with future recurring potential via licensing and volume shipments to hyperscalers and module makers. Competitive moat comes from patented passive alignment and wafer-scale semiconductor manufacturing that eliminates costly active alignment steps used by traditional photonics players delivering superior cost, power efficiency, and scalability for 800G/1.6T+ AI interconnects.
**SECTION 3 — Financial Deep Dive** 📈
Key metrics (most recent publicly available as of Q4 2025 ended Dec 31 2025; source: company filings Apr 1 2026):
Revenue: $341k (Q4 2025) vs $29k (Q4 2024); TTM ~$1.07M.
Net income: -$42.7M (Q4 2025).
EPS: -$0.32 (Q4 2025, non-GAAP context similar).
Gross margins: Not yet meaningful at commercial scale.
Free cash flow: Negative reflecting R&D and ramp investments.
YoY growth rates: Revenue +1,075 percent (Q4) but from tiny base; net loss improvement on per-share basis.
Balance sheet health: Cash and equivalents ~$430M post-2025/early-2026 financings; low debt; strong liquidity.
Cash flow quality: Operating cash flow negative but aligned with pre-revenue ramp phase (no red flags).
Capital allocation: Heavy focus on R&D, manufacturing partnerships, and production scale-up with recent equity raises funding AI optics acceleration.
**SECTION 4 — Growth Analysis** 🚀
Total addressable market (TAM): Global optical transceiver market projected to reach $27.6B by 2030 (CAGR 16.8 percent 2026-2030 per industry reports); AI-specific segment within silicon photonics/optical engines exceeding $20B+ opportunity by late 2020s. Current market share: Nascent but first production orders signal entry into high-growth AI segment. Key growth drivers for next 3-5 years: Initial shipments of POET Infinity optical engines (800G/1.6T), partnerships with module makers (Lessengers, LITEON), and hyperscaler adoption for AI clusters. Management guidance points to 2026 as inflection with 30k+ engine shipments targeted; analyst consensus more cautious near-term but aligned on long-term optics boom. Growth primarily organic via proprietary platform rather than acquisition-dependent.
**SECTION 5 — Valuation** 📊
DCF analysis: Base case assumes revenue ramp to hundreds of millions by 2028-2030 on optical engine adoption, 40 percent+ gross margins at scale, WACC 12 percent (reflecting early-stage risk), terminal growth 4 percent . Implied value supports $28 target. Comparable company analysis (peers as of April 2026): Broadcom, Marvell, Coherent (optics proxies) trade at 20-40x forward sales on AI growth; early-stage photonics names at premium to revenue. Historical valuation range (limited): Pre-commercial volatility with recent surge. Bull target $45 (accelerated 1.6T+ wins); Base $28; Bear $10 (delayed shipments). Current price ~$15 offers ~87 percent upside to base target.
**SECTION 6 — Risk Analysis** ⚠️
1. Production execution and yield ramp delays (high probability/impact): Triggered by manufacturing scale challenges; watch quarterly shipment updates and partner confirmations.
2. Intense competition from established photonics players (medium-high): Broadcom, Intel, Ayar Labs; monitor design win announcements.
3. Dilution from additional capital raises (medium): Though cash is now strong; track balance sheet updates.
4. Macro/AI capex slowdown (medium): Hyperscaler spend cuts; watch big-tech guidance.
5. Regulatory/PFIC tax or listing risks (low-medium): Recent U.S. redomicile plans mitigate; monitor shareholder vote.
Short interest elevated but declining post-rally per recent data. Insider activity shows confidence via retained holdings. No major accounting quality flags.
**SECTION 7 — Catalyst Calendar** 📅
Next earnings date: Mid-May 2026 (Q1 2026 results with likely production update). Upcoming events: First optical engine shipments targeted Q3 2026; potential additional design wins from Foxconn/Luxshare. Macro events: AI infrastructure capex announcements from NVIDIA/Meta/Google. 12-month timeline: Q2 earnings August, volume production milestones late 2026, potential U.S. listing progress.
Global optical transceiver market exploding on AI demand underpins massive TAM.
AI-specific optical engine packaging trends show clear shift toward co-packaged solutions where POET competes.
**SECTION 8 — Technical Analysis** 📈
Primary Chart: Daily timeframe, 1-year view shows explosive breakout in April 2026 from multi-month base around $5-7 to new 11-year highs near $15+ with massive volume. Price action well above both 50-day and 200-day moving averages confirming strong uptrend. RSI (14) elevated but not extreme (~70+ on surge days) with room before overbought; MACD bullish crossover with expanding histogram. Major support zone $10-12 (prior breakout), resistance $18-20. Visible chart patterns: Clear higher highs/lows since March lows plus volume climax on news. Technical implication: Bullish continuation into May earnings if momentum holds with potential for further extension on positive updates.
**SECTION 9 — The Verdict** 🏆
Bull case ($45 target, 35 percent probability): Multiple design wins and 2026 shipments exceed expectations driving re-rating to AI infrastructure leader.
Base case ($28 target, 45 percent probability): Steady order execution and cash burn management deliver first profitable trajectory.
Bear case ($10 target, 20 percent probability): Ramp delays or competitive losses lead to dilution and sentiment reset.
Expected value calculation: Probability-weighted price target = $28.50. Final recommendation: Buy with High conviction. The 30-second elevator pitch: POET is the rare early-stage photonics pure-play with proven tech, massive cash, and first commercial orders exactly as AI data centers demand cheaper/faster optical engines — positioning it for explosive growth in a $20B+ TAM.
**Sources**
POET Technologies Investor Relations (poet-technologies.com) Q4 2025 results and MD&A Apr 1 2026; Yahoo Finance/Seeking Alpha financial data and news Apr 2026; company press releases on Marvell/Celestial AI orders Apr 2026; industry reports on optical transceiver market (Business Research Company, LightCounting) 2026 forecasts; MarketBeat/TipRanks analyst commentary Apr 2026.
What are your thoughts on POET? Drop them below 👇
#POET #AIOptics #SiliconPhotonics #OpticalInterposer #DataCenterAI #MarvellOrder #PhotonicsStock #800G #1.6T #AIBoom
USDJPY 30Min Engaged ( Bullish & Bearish Reversal Detected )HANZO MARKET LIQUIDITY REPORT
USDJPY
Timeframe: 30min (Volume Basis)
Scale: Higher Timeframe Context / Deep Volume analysis
━━━━━━━━━━━━━━━━━━━━━━
Market Observation
This analysis is focusing on structural behavior, liquidity zones, Volume analysis
and key areas of interest within the current range.
━━━━━━━━━━━━━━━━━━━━━━
Market Bias
Full liquidity Map
━━━━━━━━━━━━━━━━━━━━━━
🔥Bullish Reversal
Key Volume Zone : 159.020
🔥Bearish Reversal
Key Volume Zone :159.980
━━━━━━━━━━━━━━━━━━━━━━
5 reasons / For Bullish Reversal
Liquidity pool: 159.00 is a round-number magnet where sell-side stops commonly sit (sellside liquidity).
Engine confluence: Hanzo engine shows 1H liquidity-hunt + 4H reversal, consistent with a sweep lower then bounce.
Discount entry logic: Buying after a dip into the lower edge is a discount approach versus buying mid-range at 159.16.
Front-run buffer: 159.02 slightly front-runs 159.00 to reduce missed fills during fast taps.
Clear mean-reversion target: TP 159.70 aims back into the range toward prior dealing area, not an extended breakout.
━━━━━━━━━━━━━━━━━━━━━━
5 reasons / For Bearish Reversal
Liquidity pool: 160.00 is a major round-number magnet where buy-side stops commonly sit (buyside liquidity).
Engine confluence: With 1D liquidity-hunt and 4H reversal, a push into 160.00 can be a stop-run before rotation lower.
Premium entry logic: Selling near the upper edge is a premium entry versus selling mid-range.
Front-run buffer: 159.98 slightly front-runs 160.00 to improve activation probability.
━━━━━━━━━━━━━━━━━━━━━━
Structure Factors:
• Higher timeframe Volume reaction level
• High-volume / Hidden
• Range Defend structure
• Volume Stacking
• Quarter Volume
• Fibo Defend Volume

Gold 30Min Engaged ( Bullish & Bearish Reversal Detected )HANZO MARKET LIQUIDITY REPORT
Gold
Timeframe: 30min (Volume Basis)
Scale: Higher Timeframe Context / Deep Volume analysis
━━━━━━━━━━━━━━━━━━━━━━
Market Observation
This analysis is focusing on structural behavior, liquidity zones, Volume analysis
and key areas of interest within the current range.
━━━━━━━━━━━━━━━━━━━━━━
Market Bias
Full liquidity Map
━━━━━━━━━━━━━━━━━━━━━━
🔥Bullish Reversal
Key Volume Zone : 4680 Area
🔥Bullish Reversal
Key Volume Zone : 4700
🔥Bearish Reversal
Key Volume Zone : 4725 Area
━━━━━━━━━━━━━━━━━━━━━━
5 reasons / For Bullish Reversal
Discount location: 4680 is positioned as a “buy-the-dip” area relative to current 4704, aligning with 1D bullish compression (accumulation-type behavior).
Liquidity logic: A push lower into 4680 is consistent with a sellside liquidity sweep before a rebound (common during compression).
alignment: 1H reversal supports the idea of a short-term turn after a dip; we’re waiting for price to come to the level.
Mean-reversion target: TP 4720 targets a return to the upper dealing area without requiring a full breakout (higher hit-rate in ranges).
━━━━━━━━━━━━━━━━━━━━━━
5 reasons / For Bearish Reversal
Premium location: 4725 is a “sell-the-pop” area above current price, fitting the 4H bearish reversal (supply overhead).
Buyside liquidity magnet: Moves into the 4720–4725 area often tag stops above recent highs before rotating (buyside liquidity grab).
alignment: With 4H reversal, rallies are more likely to be sold until 4H structure flips back bullish.
Rotation target: TP 4690 aims for a pullback into the range/acceptance zone, consistent with compression behavior.
━━━━━━━━━━━━━━━━━━━━━━
Structure Factors:
• Higher timeframe Volume reaction level
• High-volume / Hidden
• Range Defend structure
• Volume Stacking
• Quarter Volume
• Fibo Defend Volume

ETHEREUM - Huge Elliott Waves Formation Ethereum is currently approaching the final stage of a global accumulation phase, structured as a complex W–X–Y–X–Z correction , which began after the breakdown of the previous impulsive cycle (1–5) and the following ABC corrective move.
Macro Structure: After the completion of the bullish impulse (1–5), the market transitioned into a corrective regime, forming an extended and complex structure rather than a simple pullback:
The initial decline formed an ABC correction, marking the shift from trend to accumulation
This was followed by a broader WXYXZ formation, typical for prolonged accumulation phases in high-timeframe markets
The final Z-leg acted as a liquidity sweep, breaking below prior structure and forcing capitulation
Formation of the Current Range: The bottom formation (WXYXZ) created a structural floor, from which the current range developed. Since then:
Price has been consolidating within a rising channel / range
Volatility has been compressing under a major resistance zone
Market behavior aligns with re-accumulation rather than distribution
This suggests that the market is absorbing supply, not distributing it.
XY Development: From the upper resistance zone, price formed a corrective XY structure, which is critical for understanding current positioning:
Wave X → Y defined the internal corrective leg within the broader accumulation
The Y wave established a key support trendline (dynamic support)
This trendline is currently being respected, with price bouncing directly from it
This reaction confirms that the structure remains technically valid and buyers are defending higher lows within the range.
In conclusion , Ethereum appears to be in the final stage of a prolonged accumulation phase, where a completed correction and a well-defined structural support are now supporting the price. This combination suggests that the current consolidation is more likely a phase of compression before expansion rather than distribution. As long as key support levels hold, the chances of going up are much higher, with a breakout above resistance potentially marking the beginning of a new impulsive leg in the cycle.

Buy the Dip: Gold ready to bounce from 4660–4640!Gold prices didn't move dramatically during the day, mostly fluctuating narrowly around 4700. However, from a short-term perspective, gold repeatedly encountered resistance in the 4730-4750 area, indicating a clear bearish trend and maintaining an overall weak pattern. It's unlikely there will be a significant rebound before breaking through the 4730-4750 range.
Although the short-term downtrend is quite evident, the defensive strength of the key support area below should not be underestimated. Therefore, gold will generally maintain a range-bound trend, with multiple bottoming and rebounds being particularly noticeable. The lack of sustained bullish or bearish trends has resulted in range-bound trading with resistance above and support below. The support level in the 4660-4640 area below is particularly evident.
Therefore, since gold is still maintaining a volatile trend, this provides opportunities for both long and short positions to profit.
Short-term technical support levels: 4660-4640 / 4620-4600
Short-term technical resistance levels: 4730-4750 / 4800-4820
Therefore, in short-term trading, I would prioritize buying gold in the 4670-4650 range; if gold rebounds to the 4720-4740 range, I would consider shorting gold.

ELLIOTT WAVE & MOMENTUM ANALYSIS: XAUUSD (APRIL 27, 2026)
1. Momentum Analysis
The divergence between timeframes suggests the market is in a critical transitional phase:
– D1 Timeframe: Currently reversing to the upside. If this reversal is maintained, we could see 3–5 days of bullish or sideways-upward price action.
– H4 Timeframe: Currently in a downtrend, but price is moving sideways. This sideways or bearish pressure is likely to continue until H4 momentum reverses upward or enters the oversold zone.
– H1 Timeframe: Currently in the overbought zone and preparing for a bearish reversal. A short-term corrective drop is expected here.
2. Elliott Wave Structure
– Daily Timeframe (D1): Bullish Scenario – If today's candle closes green (bullish), it confirms a 3–5 day upward move.
– Since the recent correction was shallow, price is likely developing Wave D with the potential to break previous highs. A more distinct correction (Wave E) may appear afterward.
– 4-Hour Timeframe (H4): Transition between Correction and Reversal – Current Structure: Wave W has completed with a clear 3-wave structure. The current sideways movement is compressing, indicating a time-based equilibrium following the correction.
– Two potential scenarios:
1. Scenario 1 (Preferred): The correction is finished; price follows the D1 momentum to start a new bullish leg.
2. Scenario 2: This sideways phase is Wave X, to be followed by another leg down (Wave Y) before a major rally.
– Confirmation point: Observe the peaks and troughs when H4 momentum reverses. Higher Lows (HL) will confirm the uptrend; Lower Highs (LH) will indicate a continued downtrend.
– 1-Hour Timeframe (H1): Short-term Battleground – Current strong resistance: 4725.
– If the current upward move is an ABC structure (black): The target for Wave C completion is around 4754.
– If price fails to break 4725, it will likely return to test the support at 4656.
3. Trading Plan
– Sell Zone – Entry Zone: 4753 – 4755 (Expecting Wave C completion on H1).
– Stop Loss (SL): 4775.
– Take Profit (TP): TP1: 4725 | TP2: 4706 | TP3: 4685.
– Buy Zone – Entry Zone: 4661 – 4663 (Strong support area, aligned with D1 trend).
– Stop Loss (SL): 4641.
– Take Profit (TP): TP1: 4697 | TP2: 4706 | TP3: 4725.

Gold prices are fluctuating slightly with a bearish bias.What recent news has influenced the price movements of gold and crude oil? How should we assess the future direction of gold?
Gold prices fell under pressure, dropping to around $4,672 before rebounding, continuing the previous correction. Despite continued tensions in the Middle East, gold failed to find significant support and instead declined under the influence of macroeconomic factors, indicating that the current market pricing logic has shifted from simple safe-haven demand to a rebalancing of "interest rates and inflation expectations." Affected by the tense situation in the Middle East and rising energy prices, market concerns about inflation have intensified again. Coupled with the expectation that the Federal Reserve will maintain high interest rates, this has weakened the attractiveness of gold. Although safe-haven demand remains, the high-interest-rate environment has become the dominant factor, limiting the upside potential for gold. Logically, rising oil prices often push up overall inflation levels through energy cost transmission, and rising inflation expectations directly affect the path of monetary policy. The market currently widely expects the Federal Reserve to keep interest rates unchanged at this week's meeting. The expectation of high interest rates significantly weakens the attractiveness of gold as a non-interest-bearing asset. In a high-interest-rate environment, funds tend to flow to assets with yield attributes, thus putting downward pressure on gold.
This week will also see the release of key US data, including Q1 GDP and March PCE figures. Market focus will quickly shift from the negotiating table in Islamabad to the decision-making sessions of major central banks. The intensive meetings of the Federal Reserve, the Bank of Japan, the European Central Bank, and the Bank of England will be crucial variables determining the fate of gold. If the Federal Reserve releases any hawkish signals this week regarding rising inflation and the need to maintain tight monetary policy, gold prices could face a deeper correction.
Gold price trend analysis:
Today's gold trading recommendations focus on the resistance level of $4740-50 and the support level of $4650-55. Currently, you can consider shorting gold near $4740.

Analytics: market outlook and forecasts
WHAT HAPPENED?
Last week, after correcting to the $75,000-$74,000 zone, bitcoin continued its upward movement and updated the formed maximum. However, then the price was in a narrow sideways range for most of the week – it hardly moved.
The buyer maintained the advantage by absorbing sales with limit orders. By Monday, the buyer attempted to update the maximum again, but to no avail.
Now the range has expanded to $79,500-$77,000, volumes remain low, and the market is shrinking. At the same time, sellers continue to exert pressure.
WHAT WILL HAPPEN: OR NOT?
The base case scenario is continued growth. This is possible both from the current levels during further trading, and after a false breakdown of the sideways minimum.
If the $76,500-$75,800 zone is tested and there is a reaction, long positions can be considered in order to update the current maximum.
It’s too early to open short positions. However, such a scenario is not excluded: if the price goes lower and there is no reaction, we’ll monitor the formation of a downward structure and update our forecast.
Buy zones
$76,500–$75,800 (local buyer aggression)
$73,200–$72,000 (initiative volume)
$70,000–$68,700 (selling absorption)
$67,500–$66,500 (accumulated volumes)
$62,500 level
$47,000–$40,000 (daily buy zone)
Sell zones
$82,000–$85,500 (volume anomalies)
$87,600–$90,500 (accumulated volumes)
IMPORTANT DATES
Macroeconomic developments this week:
• Tuesday, April 28, 3:00 (UTC) — announcement of Japan's interest rate decision;
• Tuesday, April 28, 14:00 (UTC) — publication of the U.S. Consumer Confidence Index for April;
• Wednesday, April 29, 12:00 (UTC) — German Consumer Price Index for April is published;
• Wednesday, April 29, 14:30 (UTC) — publication of data on crude oil reserves in the United States;
• Wednesday, April 29, 18:00 (UTC) — announcement of the US Federal Reserve's interest rate decision, as well as the FOMC statement;
Wednesday, April 29, 18:30 (UTC) — FOMC press Conference;
• Thursday, April 30, 1:30 (UTC) — publication of the index of business activity in the Chinese manufacturing sector for April;
• Thursday, April 30, 8:00 (UTC) — publication of German GDP for the first quarter of 2026;
• Thursday, April 30, 11:00 (UTC) — announcement of the UK interest rate decision for April;
• Thursday, April 30, 12:00 (UTC) — publication of the Bank of England's letter on inflation;
• Thursday, April 30, 12:30 (UTC) — publication of US GDP for the first quarter of 2026, as well as the basic price index of US personal consumption expenditures for March and the number of initial applications for unemployment benefits in the United States;
• Friday, May 1, 13:45 and 14:00 (UTC) is the publication of the index of business activity in the US manufacturing sector for April.
*This post is not a financial recommendation. Make decisions based on your own experience.
#analytics

#NIGHTUSDT Fails Bullish Shift While Respecting Supply ZonesYello Paradisers! Are you tracking the evolving structure on #NIGHT (NIGHTUSDT), or are you still reacting to every small move while smart money continues to distribute within the range?
💎#NIGHTUSDT has printed a clear Selling Climax (SC), where aggressive sell-side pressure initially got absorbed, hinting at a possible reversal. However, unlike a typical bullish accumulation, the market failed to produce a strong Change of Character (CHoCH) or any confirmed shift in structure to the upside.
💎Instead of transitioning into accumulation, price continued to respect the bearish market structure, forming lower highs and weak rallies. The lack of bullish follow-through after the SC suggests that demand is not strong enough to take control.
💎The market attempted minor upward moves, but each rally was capped within well-defined bearish supply zones, where sellers consistently stepped in. This clean reaction from supply confirms that smart money is likely distributing rather than accumulating.
💎Currently, price is reacting again from a key Supply Zone (~0.0365–0.0380), showing rejection and continuation to the downside. As long as price remains below this zone, the bearish structure remains intact.
💎The marked Possible Break of Structure (BoS) level around 0.0345 is a critical support. A clean break and acceptance below this level would confirm continuation of the bearish trend and signal further downside expansion.
💎It’s important to understand that in weak markets, Selling Climaxes without follow-through often lead to continuation, not reversal. The absence of a strong Sign of Strength (SOS) reinforces the bearish bias.
💎Looking ahead, the primary Draw on Liquidity (DOL) lies below the current structure, with price likely seeking lower liquidity levels once support is taken.
💎However, if price manages to reclaim and hold above the Supply Zone (~0.0380) with strength, that would invalidate the bearish outlook and open the door for a potential structural shift.
Discipline is key, Paradisers! Don’t assume reversals, let the market confirm. Follow the structure, respect the supply zones, and avoid getting trapped by weak rallies.
MyCryptoParadise
iFeel the success 🌴

ATOMUSDT: WCL Retest Before The Next Bullish Expansion?OKX:ATOMUSDT is showing an interesting continuation structure on the 4H chart.
After building a bullish ABC sequence from the April low, price expanded strongly into the blue ABC target zone and swept the external liquidity sitting above the previous high. That move was not random. It completed the first bullish objective and forced late buyers into the market near the top of the local expansion.
Now the important part is the reaction after the target.
Price is currently pulling back from the blue C area, and the cleanest bullish scenario would be a deeper retracement into the blue WCL zone. This area also lines up with internal liquidity, which makes it a logical reload zone if buyers are still in control.
The setup is simple:
Price already reached the first bullish target.
External liquidity has been taken.
Now price may need to rebalance lower into internal liquidity.
If the WCL holds, the next logical expansion target becomes the higher green ABC target around the 2.10–2.19 area.
I am not interested in chasing price in the middle of the range. The better trade location is lower, inside the WCL, where risk can be defined cleaner and buyers have a reason to step back in.
The key confirmation for me would be a bullish reaction from the WCL, ideally with a liquidity sweep, displacement, and a 4H or lower-timeframe market structure shift. Without confirmation, the zone is just a zone.
Invalidation would come if price accepts below the WCL with bearish displacement, because that would weaken the bullish continuation idea and suggest the market is not ready for the higher C target yet.
For now, ATOM is in a “pullback before continuation” structure — not a blind buy, not a prediction, just a mapped sequence with clear liquidity logic.
Main idea:
Let price come back into value. Let the WCL prove itself. Then look for continuation toward the higher C target.
Not financial advice. This is only my personal market analysis and trading framework.

XAUUSD NEXT MOVE (READ CAPTION)Hi trader's what do you think about gold
Gold is currently trading in a bullish market structure, supported by consistent buying pressure at key demand zones. The trend remains upward, and short-term pullbacks are being treated as opportunities to enter in the direction of the trend.
🟢 Support Zone: 4,676 – 4,662
This zone is acting as a strong bullish demand area. As long as price holds above this range, the bullish momentum remains intact and buyers are likely to stay in control.
🔴 Resistance Zone: 4,730
The 4,730 level is the nearest resistance where price may face temporary rejection or consolidation before the next move.
🔴 Supply Zone: 4,766
The 4,766 level is a major supply and distribution zone. This area could act as the primary upside target if bullish momentum continues, where selling pressure may appear.
📈 Market Bias
Above 4,676 – 4,662 → Bullish continuation likely
Pullbacks toward support → Buy-on-dips opportunity
Break above 4,730 → Opens path toward 4,766 supply zone
Break below 4,662 → Bullish setup invalidated
Overall, Gold favors a buy-on-dips strategy while price remains above key support zones
please like comment and follow thank you

Daily live plan with XAUUSD using EasyFIBO in 15m 20260427Daily live plan with XAUUSD using EasyFIBO in 15m 20260427

Still Buying Gold? 4,780 Might Wipe You OutThat move into the highs wasn’t strength, it was a setup. The market ran liquidity into the top, printed a clean distribution, then flipped structure with a sharp CHoCH. Since then, price hasn’t looked bullish at all… just controlled selling inside a descending range.
What stands out is how every push up gets capped. No real continuation, just slow grinding moves that keep trapping late buyers. That’s usually not accumulation, that’s distribution playing out on a lower timeframe.
The zone I’m watching is 4,760–4,780. That’s where the last supply sits and also the top of the current range. If price pushes back into that area, sweeps some buy-side liquidity, and fails to hold, I’m looking for shorts. Ideally, I want to see a rejection or some form of trap before entry, not chasing in the middle.
Below, the liquidity is obvious. Range low around 4,660 is the first target, but realistically, once that gets hit, sell-side liquidity under it is likely getting cleared too.
Only thing that breaks this idea is if price starts accepting above 4,780 with strong H1 closes. If that happens, the whole structure shifts again and I step aside.
Right now it just looks like a classic trap at the highs before continuation down.
You fading the highs here or waiting for confirmation?
