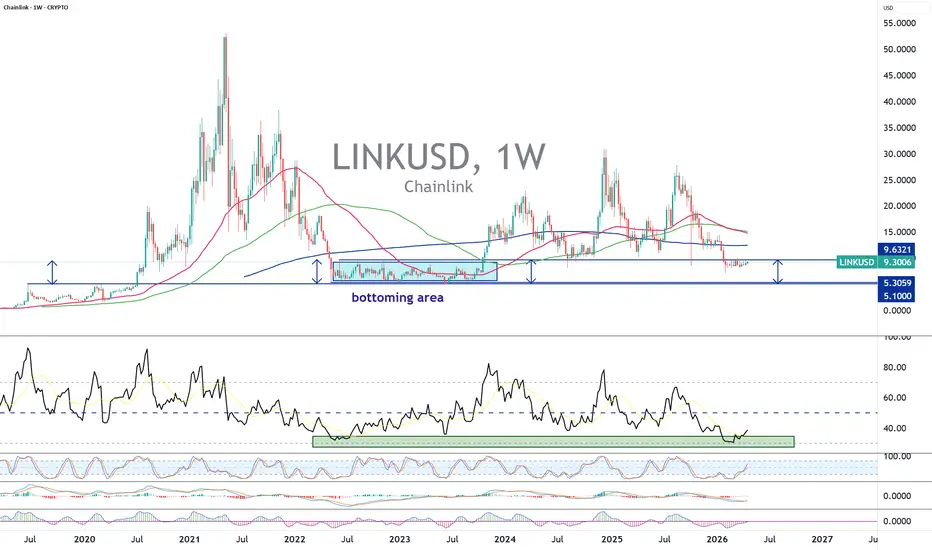
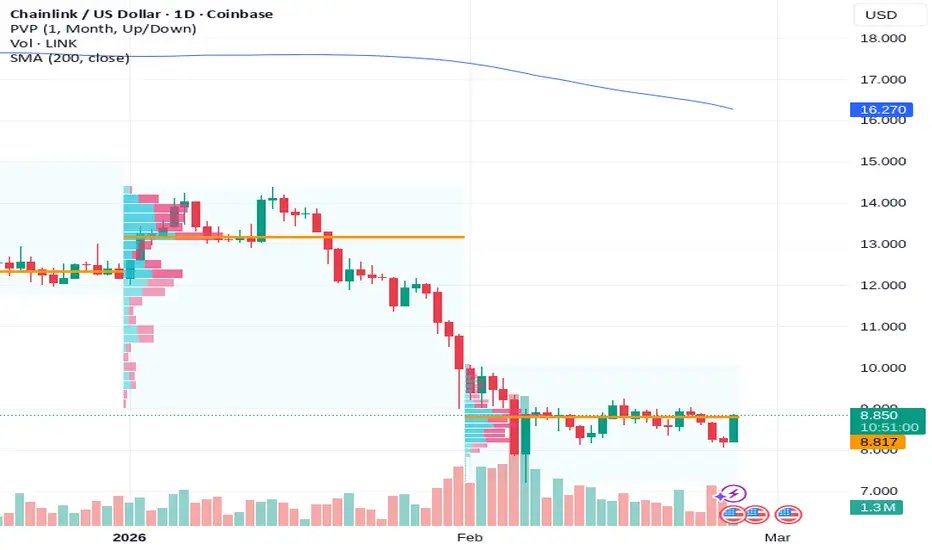
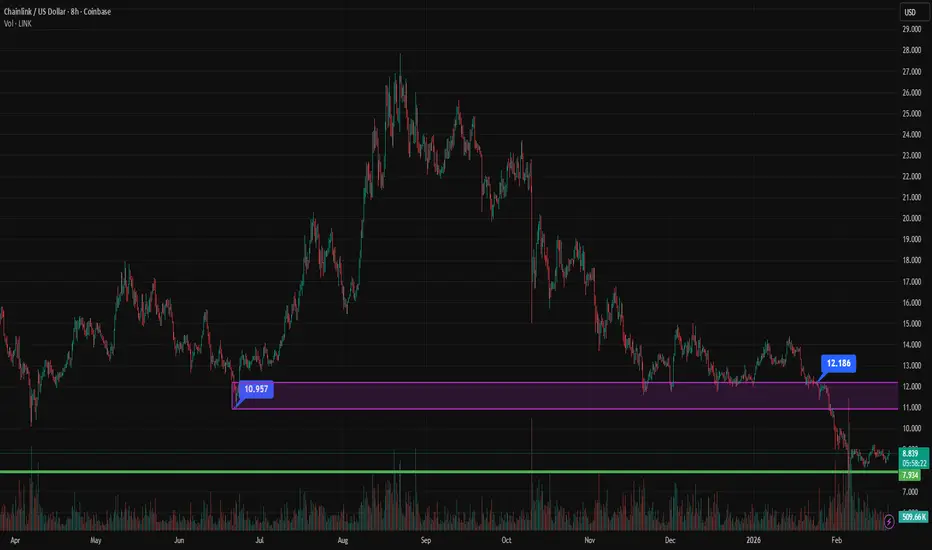
LINK, accumulation zone between $5 and $9While the Clarity Act is in its final phase of drafting and validation for the United States Senate, altcoins that are critical within the interoperability and decentralized finance (DeFi) segment are those that will benefit the most from the adoption of the Clarity Act as a law in the United States.
The CLARITY Act aims to create a clear legal framework for crypto-assets in the USA:
• Separation between the SEC and the CFTC (securities vs commodities)
• Legal status of tokens
• Rules for exchanges
• Framework for DeFi and stablecoins
Among the cryptocurrencies that will benefit the most due to their critical role and their current institutional adoption, there is the crypto LINK. The latter has the strongest fundamentals in interoperability related to DeFi, and the token is currently located in a long-term technical accumulation zone between $5 and $9.
Beyond this technical perspective, Chainlink’s positioning is based on a structural role in the architecture of tokenized financial markets. Indeed, in an environment where equities, bonds, and other real-world assets are expected to be issued and traded on-chain, the central question becomes that of data reliability. Chainlink responds precisely to this need by providing decentralized oracles capable of delivering reliable external data to smart contracts.
This role is all the more strategic within a regulated framework such as the one implied by the CLARITY Act. Financial institutions, subject to strict requirements in terms of compliance and risk management, cannot operate without auditable and secure data flows. In this context, Chainlink establishes itself as a critical infrastructure enabling the connection between traditional systems and public blockchains.
Furthermore, the rise of tokenized products (on-chain ETFs, tokenized bonds, decentralized money markets) mechanically strengthens the demand for robust oracle solutions. Each tokenized asset requires price updates, rate references, or reliable external events, all use cases directly addressed by Chainlink.
Thus, the combination of a major regulatory catalyst and a key infrastructure positioning could justify a re-rating of the token over the medium term. From this perspective, the zone between $5 and $9 appears as a strategic accumulation phase that already worked perfectly at the end of the previous bear market in 2022.
The chart below shows Japanese candlesticks on weekly data for the LINK/USD crypto.
DISCLAIMER:
This content is intended for individuals who are familiar with financial markets and instruments and is for information purposes only. The presented idea (including market commentary, market data and observations) is not a work product of any research department of Swissquote or its affiliates. This material is intended to highlight market action and does not constitute investment, legal or tax advice. If you are a retail investor or lack experience in trading complex financial products, it is advisable to seek professional advice from licensed advisor before making any financial decisions.
This content is not intended to manipulate the market or encourage any specific financial behavior.
Swissquote makes no representation or warranty as to the quality, completeness, accuracy, comprehensiveness or non-infringement of such content. The views expressed are those of the consultant and are provided for educational purposes only. Any information provided relating to a product or market should not be construed as recommending an investment strategy or transaction. Past performance is not a guarantee of future results.
Swissquote and its employees and representatives shall in no event be held liable for any damages or losses arising directly or indirectly from decisions made on the basis of this content.
The use of any third-party brands or trademarks is for information only and does not imply endorsement by Swissquote, or that the trademark owner has authorised Swissquote to promote its products or services.
Swissquote is the marketing brand for the activities of Swissquote Bank Ltd (Switzerland) regulated by FINMA, Swissquote Capital Markets Limited regulated by CySEC (Cyprus), Swissquote Bank Europe SA (Luxembourg) regulated by the CSSF, Swissquote Ltd (UK) regulated by the FCA, Swissquote Financial Services (Malta) Ltd regulated by the Malta Financial Services Authority, Swissquote MEA Ltd. (UAE) regulated by the Dubai Financial Services Authority, Swissquote Pte Ltd (Singapore) regulated by the Monetary Authority of Singapore, Swissquote Asia Limited (Hong Kong) licensed by the Hong Kong Securities and Futures Commission (SFC) and Swissquote South Africa (Pty) Ltd supervised by the FSCA.
Products and services of Swissquote are only intended for those permitted to receive them under local law.
All investments carry a degree of risk. The risk of loss in trading or holding financial instruments can be substantial. The value of financial instruments, including but not limited to stocks, bonds, cryptocurrencies, and other assets, can fluctuate both upwards and downwards. There is a significant risk of financial loss when buying, selling, holding, staking, or investing in these instruments. SQBE makes no recommendations regarding any specific investment, transaction, or the use of any particular investment strategy.
CFDs are complex instruments and come with a high risk of losing money rapidly due to leverage. The vast majority of retail client accounts suffer capital losses when trading in CFDs. You should consider whether you understand how CFDs work and whether you can afford to take the high risk of losing your money.
Digital Assets are unregulated in most countries and consumer protection rules may not apply. As highly volatile speculative investments, Digital Assets are not suitable for investors without a high-risk tolerance. Make sure you understand each Digital Asset before you trade.
Cryptocurrencies are not considered legal tender in some jurisdictions and are subject to regulatory uncertainties.
The use of Internet-based systems can involve high risks, including, but not limited to, fraud, cyber-attacks, network and communication failures, as well as identity theft and phishing attacks related to crypto-assets.
In-depth trading ideas
Chainlink approaching $10 breakout as traders defend $9 supportCurrent Price: 9.29 (Analysis was generated on Monday Morning)
Direction: LONG
Confidence level: 62%(Several professional traders referenced a $9.50-$10 upside range and identified strong support between $8.50 and $8.80. Price is currently near the lower boundary of the range, creating a favorable risk-reward for a long trade. However, limited sentiment volume reduces confidence slightly.)
Targets
Target 1: 9.60
Target 2: 10.00
Stop Levels
Stop 1: 8.78
Stop 2: 8.50
Key Insights:
Here's what's driving this setup. Several professional traders consistently referenced a short‑term range between roughly $9.50 and $10.00. That level appeared multiple times across trader discussions, which tells me it's the main upside zone traders expect LINK to test this week.
Another important piece is support positioning. Multiple traders pointed out downside protection areas between $8.50 and $8.80, with deeper structural support around $8.15 if the broader range breaks. Since the current price is sitting near the lower portion of the trading band, traders see this area as a favorable spot to attempt longs rather than chasing strength.
There's also a structural narrative developing. Several traders highlighted Chainlink as a core infrastructure token tied to real‑world assets and cross‑chain messaging, and that long‑term narrative continues to support accumulation behavior when price dips toward support.
Recent Performance:
You can see this dynamic in recent price action. Chainlink has been oscillating around the $9.20–$9.50 area, failing to break higher but also repeatedly bouncing from the low‑$9 region. This type of compression typically precedes a volatility expansion, and traders are watching whether the next move pushes toward the upper boundary near $10.
Expert Analysis:
Traders focusing on the charts are paying attention to the $9.50–$10.00 resistance band. Several professional traders mentioned that if LINK can push through that zone, momentum traders could step in quickly. Round numbers like $10 often trigger algorithmic buying and stop‑runs.
At the same time, downside risk isn't ignored. A few traders warned that losing $8.78 support could open the door toward the mid‑$8 range. That's why the trade setup many traders are discussing involves entering near current levels with risk defined just below that support cluster.
News Impact:
Recent developments also support the bullish case. Institutional experimentation with Chainlink’s CCIP infrastructure and broader derivatives availability are expanding liquidity and exposure for the token. While these developments don't guarantee a rally this week, they strengthen the underlying narrative that large financial institutions are actively testing Chainlink technology.
Trading Recommendation:
Putting it all together, the setup favors a LONG trade from the lower end of the current range. The collective wisdom of professional traders points to a push toward $9.60 first and potentially $10.00 this week if momentum builds. I’d look for entries around the current zone with stops below $8.78, allowing the trade enough room while protecting against a breakdown. If $9.60 breaks cleanly, momentum could carry LINK toward the psychological $10 barrier quickly.
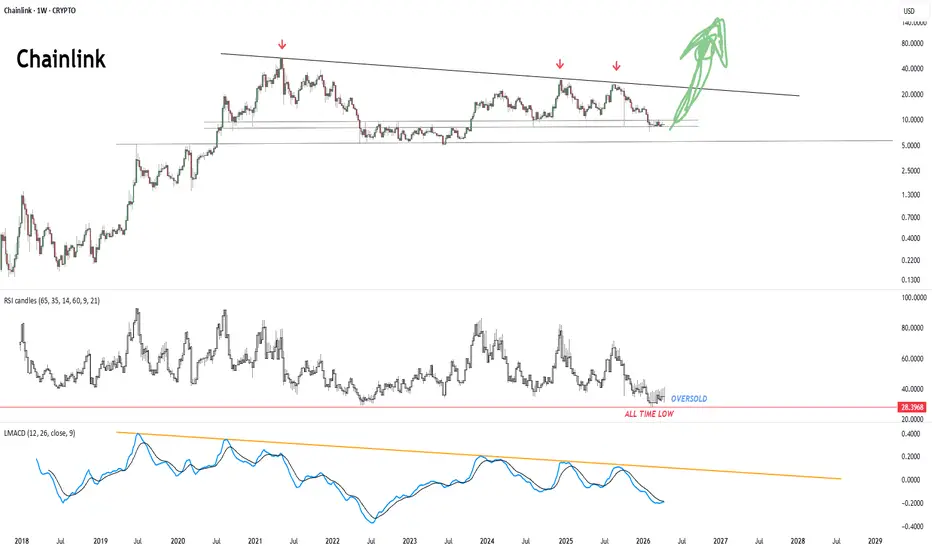
LINK/USD All-Time Low RSI Meets the $25B RWA BoomBIST:LINK Chainlink
If you are looking for the most extreme divergence between price sentiment and network fundamentals in the current market, look no further than the Chainlink (LINK) 1-Week chart.
Here is the professional breakdown of why this specific technical structure, combined with 2026’s macro narratives, is flashing a generational accumulation signal:
(All-Time Low RSI)
The most critical piece of alpha on this chart is the momentum oscillator. The Weekly RSI has plummeted to 28. As marked on the chart, this is an absolute ALL-TIME LOW for Chainlink's relative strength. Historically, whenever top-tier infrastructure assets reach this level of momentum exhaustion while maintaining structural support, it marks the final transfer of wealth from impatient retail to institutional smart money.
Multi-Year Descending Resistance & Accumulation Zone
Price action is currently boxed between a massive multi-year descending trendline (the black line capping highs since the 2021 peak) and the historical horizontal accumulation block ($5 - $10 range). The price is compressing heavily into the apex of this structure.
Fundamental Catalyst: The RWA Infrastructure Monopoly
Technical charts need fundamental fuel for macro breakouts, and Chainlink has the ultimate catalyst in 2026. The tokenized Real World Asset (RWA) market has now surpassed $25 billion in on-chain value. None of this institutional capital can securely move on-chain without oracle networks and cross-chain connectivity protocols (like CCIP). Chainlink is bridging these crypto-native solutions to a massive, traditional user base. You cannot have the RWA super-cycle without Chainlink.
We have a textbook setup: An infrastructure monopoly facilitating a $25 billion RWA market , trading at an all-time low weekly RSI. The compression under the macro trendline is reaching its final stages.
Bearish Momentum(Not financial advice, but I do enjoy the comments.)
All the smaller SMAs are all smacking into the 200sma and rejecting lower. The 10 is under the 20 (bear control), and the 200 has proven itself as major resistance still (bear market in-tact).
LINK is sitting right near a minor trendline support.
This is going to get interesting.
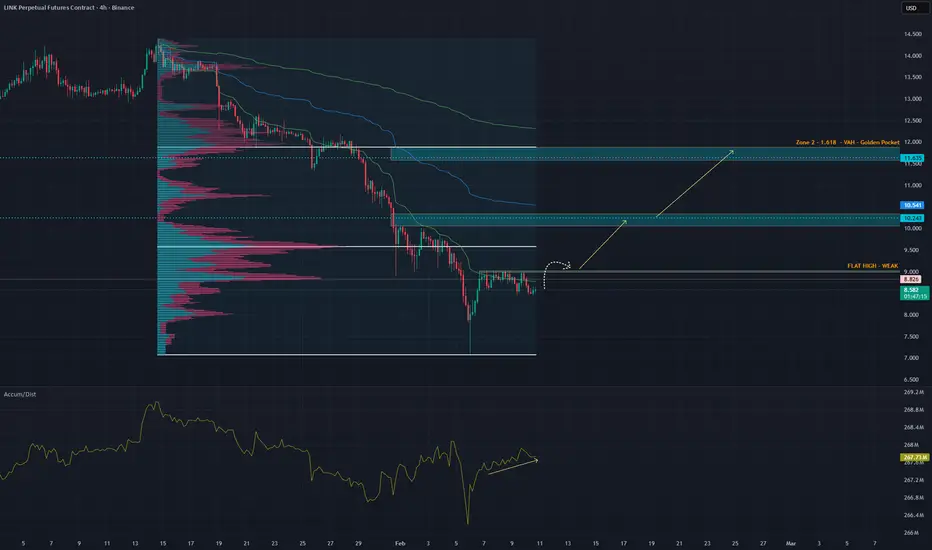
Is Chainlink on the verge of entering a downtrend?After a liquidity grab at $10, is Chainlink about to shift into a downtrend?
If the $8.6 support flips into resistance, there’s a possibility it could move toward the $6 level.
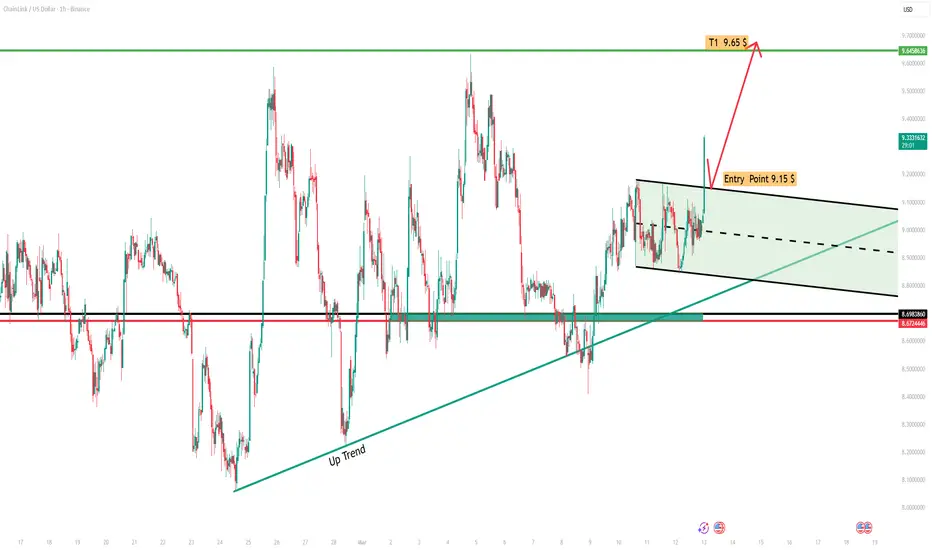
link / USD (1H)The chart shows a clear bullish market structure supported by a rising uptrend line from the recent swing low. Price is currently consolidating inside a descending triangle / bullish continuation wedge, which typically forms before a breakout in trending markets.
Market Structure
The overall trend remains bullish as long as price holds above the ascending trendline.
Price is compressing between:
Descending resistance (upper black trendline)
Rising support from the broader uptrend.
This tightening price action indicates accumulation before expansion.
Key Levels
Entry Point: $9.15
A confirmed breakout above the descending resistance would signal momentum continuation.
Target 1 (T1): $9.65
This level represents the next major horizontal resistance and the projected move from the triangle breakout.
Major Support Zone: $8.67 – $8.70
Previously acted as resistance and is now flipped to demand/support.
Bullish Scenario
If LINK breaks and holds above $9.15 with strong volume:
Momentum traders may push price toward $9.65.
A clean break above $9.65 could open the path toward the $10 psychological level.
Bearish Scenario
Failure to break the triangle and a drop below the pattern support could lead to:
Retest of the $8.70 demand zone.
Losing this level would weaken the bullish structure and invalidate the current setup.
Trading Perspective
Bias: Bullish continuation
Best Strategy: Trade the breakout confirmation above $9.15 rather than anticipating it.
Risk Management: Stop below the triangle support or below $8.85 depending on risk tolerance.
✅ Conclusion:
LINK is in a bullish consolidation within an uptrend. A breakout above $9.15 is likely to trigger momentum toward $9.65, aligning with the continuation pattern forming on the 1-hour timeframe.
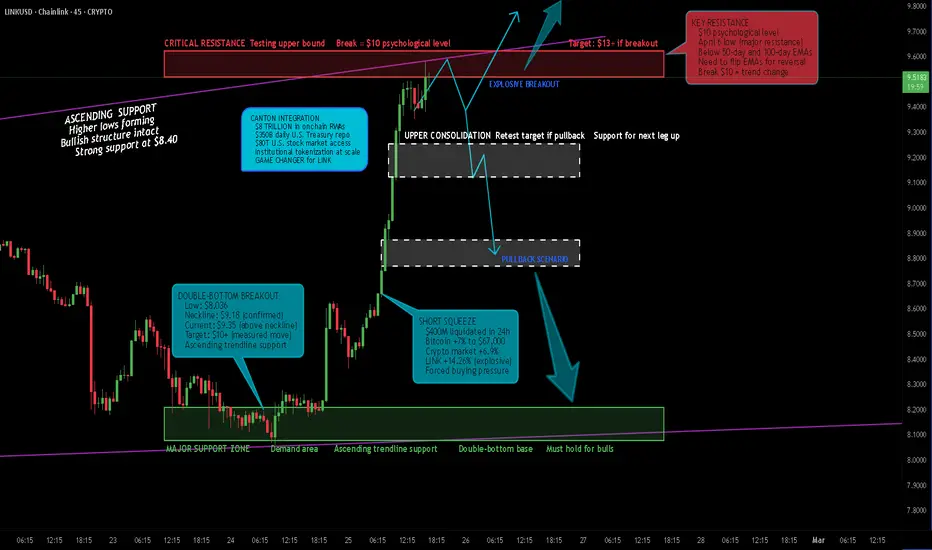
LINK - Explosive 14% Rally! Canton Integration + Short Squeeze !
What's up traders! 👋
Chainlink is EXPLODING right now with a 14% rally to $9.35 - the highest level since February 5! We've got MASSIVE bullish momentum from the Canton Network integration, crypto-wide short squeeze ($400M liquidated), and LINK ETF inflows. Let me break down what's happening on the 45-minute chart and why the next move could be MASSIVE.
The Setup
LINK is trading at $9.35 after SURGING 14.26% today, breaking out from consolidation and testing resistance at $9.40-$9.60. Price is riding an ascending trendline with explosive volume - this is a POWERFUL breakout with the $10 psychological level in sight.
The big question: Does this break above $10 for a run to $13+, or do we get a pullback to $9.10 consolidation before the next leg up?
Why This Setup Matters
EXPLOSIVE 14% rally today (highest since Feb 5)
CANTON NETWORK INTEGRATION (institutional tokenization)
Crypto-wide SHORT SQUEEZE ($400M liquidated in 24h)
LINK ETF inflows: $10M this month, $85M total
Bitcoin +7% to $67,000 (altcoin rally)
Crypto market cap +6.9% to $2.38 trillion
Ascending trendline support (purple line)
Testing resistance at $9.40-$9.60 (red zone)
$10 psychological level next target
Strategic LINK Reserves: 2.17M tokens ($19.7M)
Chainlink = infrastructure backbone for DeFi
The News Context - February 25, 2026
This is where it gets EXPLOSIVE - fundamentals are MASSIVELY bullish:
Bullish catalysts (DOMINANT):
CANTON NETWORK INTEGRATION (Feb 25) - GAME CHANGER
Chainlink Data Streams, SmartData, Proof of Reserve live on Canton
Canton: $8 TRILLION in onchain RWAs, $350B daily U.S. Treasury repo
24/5 Equities Streams unlocks $80 TRILLION U.S. stock market
Institutional tokenization at scale (regulated markets)
Chainlink = data backbone for institutional finance
CCIP (Cross-Chain Interoperability Protocol) coming to Canton
LINK PRICE +14.26% today to $9.35 (3-week high)
CRYPTO-WIDE SHORT SQUEEZE: $400M liquidated in 24h
Bitcoin +7% to $67,000 (altcoin rally)
Ethereum +12% above $2,000 (risk-on)
Crypto market cap +6.9% to $2.38 trillion
LINK ETF INFLOWS: $10M this month, $85M total
Grayscale GLNK: $61M, Bitwise CLNK: $9.75M
Strategic LINK Reserves: 2.17M tokens ($19.7M)
Chainlink accumulating LINK with off-chain fees
$28 TRILLION in transaction value enabled
Majority of DeFi secured by Chainlink
Recent integrations: Robinhood, Arc, World, MagaEth
Institutional adoption: Swift, Euroclear, Mastercard, UBS
Ascending trendline support holding
Trading volume +70% to $1.44B
Derivatives volume +112.93% to $1.39B
Open interest +31.32% to $565.77M
Bearish/Risk factors (WEAK):
LINK still in long-term bear market (down from $27 high)
Below 50-day and 100-day EMAs
Key resistance at $10 (April 6 low)
Risk of DEAD CAT BOUNCE (bull trap)
Potential Iran attack risk (geopolitical)
Technical: Double-bottom at $8.036, neckline $9.18
Need to flip moving averages for confirmed reversal
Key Levels I'm Watching
Resistance:
$9.40-$9.60 - CRITICAL RESISTANCE / Red zone / Current test
$10.00 - PSYCHOLOGICAL LEVEL / Major resistance / April 6 low
$12.00 - Secondary resistance
$13.00 - Major resistance zone / Breakout target
$15.00 - Extended target if momentum continues
Support:
$9.35 - Current price
$9.18 - Double-bottom neckline / Immediate support
$9.10-$9.30 - Upper consolidation zone / Gray zone
$8.70-$8.90 - Lower consolidation zone / Gray zone
$8.40 - Ascending trendline support
$8.10-$8.40 - MAJOR SUPPORT ZONE / Green zone / Demand area
$8.036 - Double-bottom low
Pattern Analysis - Explosive Breakout from Consolidation
Price is breaking out explosively from a consolidation pattern with MASSIVE volume:
Consolidation: $8.10-$9.10 range (several weeks)
Breakout: +14.26% surge to $9.35 today
Ascending trendline: Purple line supporting higher lows
Volume: +70% to $1.44B (explosive buying)
Derivatives: Volume +112.93%, Open interest +31.32%
Double-bottom: $8.036 low, neckline $9.18 (confirmed)
Target: $10 psychological level, then $13 resistance
This is a POWERFUL breakout with strong fundamentals backing it. The Canton integration is a GAME CHANGER for institutional adoption.
Two Scenarios
SCENARIO 1: Breakout Above $10 (PRIMARY - 70% probability)
Price breaks above $9.60 resistance and $10 psychological level, targets $13 major resistance.
Break above $9.40-$9.60 resistance with volume
Reclaim $10 psychological level (April 6 low)
Target 1: $12 (secondary resistance)
Target 2: $13 (major resistance / measured move)
Target 3: $15 (extended target if momentum)
Triggers:
Canton integration momentum (institutional adoption)
Crypto rally continues (Bitcoin to $70K+)
LINK ETF inflows accelerate (institutional demand)
Short squeeze continues ($400M already liquidated)
More institutional integrations announced
Strategic LINK Reserves accumulation continues
DeFi activity increases (oracle demand)
Tokenization narrative accelerates
This aligns with:
Explosive 14% rally today
Canton integration (institutional game changer)
$400M short squeeze (forced buying)
LINK ETF inflows ($10M this month)
Bitcoin +7%, crypto market +6.9%
Ascending trendline support
Double-bottom pattern confirmed
Strategic LINK Reserves accumulation
Chainlink = infrastructure backbone
SCENARIO 2: Pullback to $9.10 Then Long (ALTERNATE - 30% probability)
Price gets rejected at $9.60 resistance, pulls back to $9.10 consolidation, then resumes uptrend.
Rejection at $9.40-$9.60 resistance
Pullback to $9.10-$9.30 upper consolidation
Strong defense at $9.10 = long opportunity
Resume uptrend, break $10, target $13
Triggers:
Profit-taking after 14% rally
Bitcoin pullback (altcoin correction)
Crypto market consolidation
Technical pullback to retest breakout
Geopolitical risk (Iran attack)
This would be a HEALTHY pullback to consolidate gains before the next leg up. The ascending trendline at $8.40 and support zone at $8.10-$8.40 provide strong downside protection.
Canton Network Integration - GAME CHANGER
What Happened (Feb 25, 2026):
Chainlink live on Canton Network (institutional blockchain)
Canton: $8 TRILLION in onchain RWAs
Canton: $350 BILLION daily U.S. Treasury repo transactions
Chainlink Data Streams, SmartData, Proof of Reserve live
24/5 Equities Streams: Access to $80 TRILLION U.S. stock market
CCIP (Cross-Chain Interoperability Protocol) coming soon
Canton ecosystem already using Chainlink in production
Apps: CBTC by BitSafe, Unhedged, Thetanuts Finance, Kairo
Why This Matters:
INSTITUTIONAL TOKENIZATION AT SCALE
Chainlink = data backbone for regulated markets
Real-time pricing, valuation, collateral verification
Supports lending, margining, settlement, risk management
Canton = leading ecosystem for regulated tokenized assets
Chainlink Labs = Canton Super Validator (governance, sequencing)
Integration with traditional financial systems
Unlocks MASSIVE opportunity for institutional finance onchain
Market Impact:
MASSIVELY BULLISH. This is Chainlink becoming the INFRASTRUCTURE BACKBONE for institutional finance. Canton's $8 trillion in RWAs and $350 billion daily repo transactions are HUGE. The 24/5 Equities Streams unlock the $80 trillion U.S. stock market. This is a DEFINING STEP toward institutional finance operating fully onchain.
Crypto-Wide Short Squeeze - $400M Liquidated
What Happened:
$400 MILLION in short positions liquidated in 24 hours
Crypto market cap +6.9% to $2.38 trillion
Bitcoin +7% to $67,000
Ethereum +12% above $2,000
Altcoins posting double-digit gains
LINK +14.26% (among top performers)
Fear & Greed Index: 11 (Extreme Fear) - contrarian signal
Coinbase Premium Index positive (U.S. buyers returning)
Why This Matters:
Crowded short positions forced to cover
Forced buying accelerates rally
Risk-on sentiment returning
U.S. buyers coming back (Coinbase Premium)
Extreme Fear = contrarian buy signal
Altcoins outperforming (LINK high-beta)
Market Impact:
MASSIVELY BULLISH short-term. The $400M liquidation creates forced buying pressure. LINK's high-beta nature means it outperforms in rallies. The Extreme Fear reading (11) is a contrarian signal - markets often bottom at extreme fear.
LINK ETF Inflows - Institutional Demand
The Data:
LINK ETF inflows: $10 MILLION this month
Total LINK ETF assets: $85 MILLION
Current assets: $71 MILLION
Grayscale GLNK: $61 MILLION
Bitwise CLNK: $9.75 MILLION
Contrast: Bitcoin and Ethereum ETFs shedding billions
Why This Matters:
Sustained institutional demand
LINK ETFs gaining while BTC/ETH ETFs losing
Institutional holding patterns (not selling)
Provides underlying support for price
Signals confidence in Chainlink fundamentals
Market Impact:
BULLISH. The fact that LINK ETFs are gaining assets while BTC/ETH ETFs are losing billions shows RELATIVE STRENGTH. Institutions are accumulating LINK despite market weakness.
Strategic LINK Reserves - Accumulation Continues
What's Happening:
Strategic LINK Reserves: 2.17 MILLION tokens
Current value: $19.7 MILLION
Chainlink using off-chain fees to buy LINK
Accumulation will continue for years
Novel fee model: Enterprise revenue → LINK tokens
Why This Matters:
Reduces circulating supply (bullish)
Aligns incentives (fees → token buybacks)
Long-term accumulation plan
Shows confidence in LINK value
Creates buying pressure from protocol itself
Market Impact:
BULLISH long-term. The Strategic LINK Reserves create constant buying pressure as Chainlink converts enterprise fees to LINK tokens. This is a MASSIVE structural tailwind.
Chainlink = Infrastructure Backbone for DeFi & Institutions
Why Chainlink is Different:
$28 TRILLION in transaction value enabled
Secures majority of DeFi
Industry-standard oracle platform
Essential for lending, derivatives, stablecoins
Institutional adoption: Swift, Euroclear, Mastercard, UBS
Top protocols: Aave, Lido, GMX
Recent integrations: Robinhood, Arc, World, MagaEth
Canton integration = institutional tokenization
The Narrative:
Chainlink is INFRASTRUCTURE, not a speculative play. It's the data backbone that enables DeFi and institutional finance onchain. As tokenization accelerates, Chainlink becomes MORE essential, not less. This is foundational infrastructure that benefits as the entire sector scales.
Long-Term Outlook:
MASSIVELY BULLISH. Chainlink is embedded in the infrastructure of crypto and traditional finance. The Canton integration is a DEFINING STEP toward institutional finance operating fully onchain. As tokenization grows, Chainlink's value proposition strengthens.
Technical Analysis - Double-Bottom Breakout
Pattern:
Double-bottom at $8.036 (low)
Neckline at $9.18 (confirmed breakout)
Current: $9.35 (above neckline)
Target: $10+ (measured move)
Ascending trendline support (purple line)
Moving Averages:
Below 50-day and 100-day EMAs (bearish long-term)
Need to flip EMAs for confirmed reversal
$10 is key resistance (April 6 low)
Break above $10 = bullish trend change
Risk:
LINK is still in a long-term bear market (down from $27 high). The current rally could be a DEAD CAT BOUNCE (bull trap) if it fails at $10 resistance. However, the fundamentals (Canton integration, ETF inflows, Strategic Reserves) suggest this is MORE than a technical bounce.
My Game Plan
Bullish scenario (PRIMARY - 70%): I'm MASSIVELY BULLISH here. The Canton integration is a GAME CHANGER - $8 trillion in RWAs, $350 billion daily repo, $80 trillion U.S. stock market access. This is Chainlink becoming the INFRASTRUCTURE BACKBONE for institutional finance. The $400M short squeeze shows forced buying pressure. LINK ETF inflows ($10M this month) show institutional demand. Strategic LINK Reserves create constant buying. The 14% rally today is EXPLOSIVE with strong volume. Ascending trendline support holding. If we break $10, I'm targeting $13-$15.
Alternate scenario (30%): If we get rejected at $9.60, I'm watching for a pullback to $9.10 consolidation. This would be a HEALTHY retest before the next leg up. The ascending trendline at $8.40 and support at $8.10-$8.40 provide strong downside protection. I'd look to long at $9.10 with stops below $8.80.
Key level: $10 PSYCHOLOGICAL LEVEL. Break above = confirmed bullish trend change. Reject = potential dead cat bounce.
The Bottom Line
I'm MASSIVELY BULLISH on LINK here. The setup is EXPLOSIVE:
Bullish factors (DOMINANT):
Canton integration (institutional game changer)
$8 trillion RWAs, $350B daily repo
$80 trillion U.S. stock market access
14% rally today (explosive momentum)
$400M short squeeze (forced buying)
LINK ETF inflows ($10M this month)
Strategic LINK Reserves accumulation
$28 trillion transaction value enabled
Infrastructure backbone for DeFi + institutions
Ascending trendline support
Double-bottom breakout confirmed
Bitcoin +7%, crypto market +6.9%
Bearish factors (WEAK):
Long-term bear market (down from $27)
Below 50-day and 100-day EMAs
$10 resistance (April 6 low)
Risk of dead cat bounce
Geopolitical risk (Iran)
The $10 psychological level is KEY. Break above = long to $13-$15. Reject = pullback to $9.10, then long from there.
The Canton integration is a DEFINING MOMENT for Chainlink. This is institutional finance moving onchain with Chainlink as the data backbone. The fundamentals are TOO BULLISH to ignore.
What do you think? Breakout to $13+ or pullback first? Drop your take! 👇
If this helped, smash that 🚀 Boost button!
Not financial advice. DYOR.
Chainlink stalls below key resistance as downside risk builds:Current Price: 8.88 (Analysis was generated on Monday Morning)
Direction: SHORT
Confidence level: 62%(Several professional traders describe a bearish or range-bound structure below the $9.23 resistance, and repeated failures there outweigh mixed social sentiment.)
Targets
Target 1: 8.40
Target 2: 7.55
Stop Levels
Stop 1: 9.23
Stop 2: 9.50
Key Insights:
Here’s what’s driving this trade. Multiple traders describe LINK as being in sideways-to-bearish consolidation, with no impulsive buying pressure. The market keeps reacting to the same ceiling near $9.20–$9.30, which tells me sellers are still in control there. As long as price stays below that level, the path of least resistance remains lower.
What’s interesting is how often downside levels like $7.55 and even $6.90 come up in trader discussions. That doesn’t mean an immediate crash, but it does signal that if support cracks, traders expect momentum to accelerate quickly. For this week, the $8.40 zone is the first area where short-term buyers may try to defend.
Recent Performance:
LINK has been grinding around the high‑$8 range after sharp multi‑month losses. Short-term bounces have lacked follow‑through, and rallies have been sold into quickly. This kind of price action usually shows distribution rather than accumulation, especially when volume doesn’t expand on up moves.
Expert Analysis:
Several professional traders I tracked emphasized that LINK has not confirmed a macro bottom yet. The structure remains bearish unless there’s a clean break and hold above $9.23. Until that happens, traders are treating strength as an opportunity to fade, not chase. From a weekly trading perspective, that keeps shorts favored near resistance with defined risk.
News Impact:
On the news side, developments like futures listings and ETFs are constructive longer term, but price action hasn’t responded in a meaningful way yet. That disconnect matters. When good news doesn’t push price higher, traders often interpret it as a sign that the market is still working through supply.
Trading Recommendation:
Here’s my take. As long as LINK stays below $9.23, I favor a SHORT position targeting $8.40 first and $7.55 if selling pressure picks up. Risk is clearly defined above resistance, and the reward-to-risk makes sense for a short-term trade this week. I’d size conservatively given mixed sentiment, but structurally, sellers still have the edge.
Chainlink to $11-12 on a nice alt bounceYes, I do realize all these charts look roughly the same, but we gotta take what the market is giving here and what it's giving is boring sideways consolidation (along with plenty of grave dancing by bears on crypto - like EVERY OTHER CYCLE lmao.)
In short, LINK has an opportunity here to send to $11-12 briefly, and then I think it will likely fall to the $4-5 range again where it will be good to accumulate.
LINK - LONG - The Market Is Setting a Trap$CHAINLINK
Sometimes the market does not whisper.
It speaks clearly.
Both stablecoin-margined and coin-margined futures CVD are bleeding. Sellers are active across derivatives, yet price is barely moving. That tells you everything you need to know. Supply is being absorbed.
Today we saw a sharp increase in fresh leverage, and it is overwhelmingly shorts. Net shorts are up almost 4x since yesterday, but price refuses to break down. If this market wanted lower, it would already be there.
On the 4H Binance Perps, momentum is rolling over while price holds structure. A clean hidden bearish divergence, but with no downside follow-through. That is positioning fighting price, not price confirming positioning.
Now add the Accumulation / Distribution read.
After the downside sweep, A/D turns up and keeps rising while price consolidates. That means supply is being absorbed quietly. This is not distribution into strength. This is accumulation into fear. Smart money is active while volatility compresses.
Look at open interest.
OI is rising while price goes sideways. New positions are entering, not exits. Combine that with negative CVD and you get one thing. Aggressive short positioning into a market that is not accepting lower prices.
Now zoom out and look at the liquidation heatmap.
There are clear liquidation clusters stacked above current price. That is where short liquidations live. Liquidity does not block price. It pulls it.
Markets do not move because of opinions.
They move to resolve imbalance.
When shorts pile in, CVD bleeds, OI builds, and price refuses to break down, the path of least resistance often flips hard and fast. Those clusters are not resistance.
They are objectives.
This is not prediction.
This is structure, positioning, and liquidity aligning.
For me, this is an A++ asymmetric setup. Risk is clearly defined. Upside is driven by forced participation.
Targets:
10.20
11.50
Price does not care who is right.
It cares who is trapped.
LINK: Let Bears Do Its Dance.Let beras do its dance ladies and gentlemen .
Link has 2 area for a bounce , which one will be the one?
Well knowing that there's still plenty of TIME on beras side , all we can do is wait, when price is near the vertical blue line then we know that the TIME is near for its next move.
Don't rush a trade always let it come to you.
Use lev wisely.
Play it right...........Play it safe...........Play it The NumberFive Way.
Boost.............Follow..............Comment.

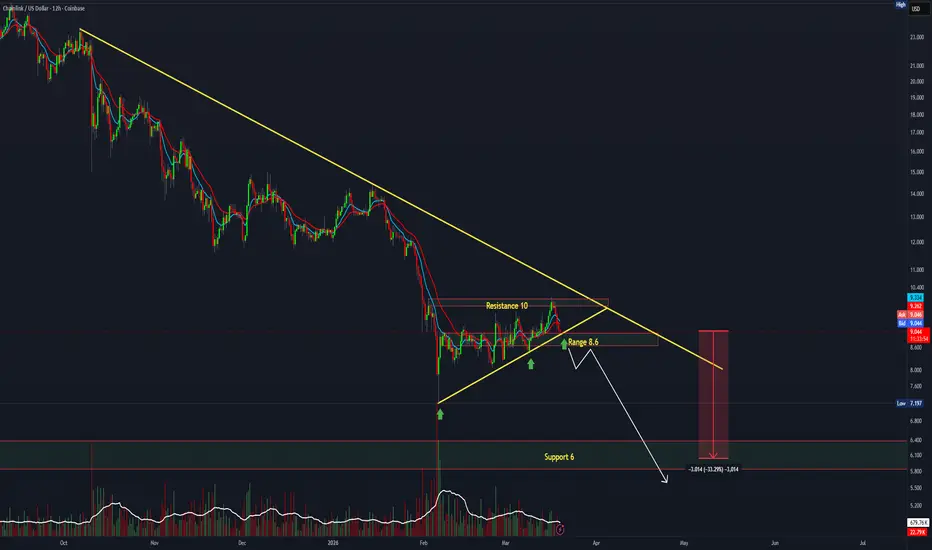
ChainLink Breaks Down: Hold Here or Drop to $6?Chainlink has broken below its previous 3 month support and is now trading within a new 3 month range, which can also be seen in the prior linked charts.
There are two main scenarios to be aware of. At current levels, LINK needs to hold this new 3 month support range to set up the next volatility expansion. As of now, that move is projected toward the end of March (highlighted).
If this 3 month support fails, price could rotate lower into the $6.00–$5.50 zone. That would likely extend the accumulation phase and push the apex out by roughly another month, toward April.
Excited to see how this develops. I remain a strong believer in LINK and its positioning within real world asset tokenization.

Chainlink Head and shoulders almost completeLook at the chart. Speaks for itself. Full reset almost complete, back to baseline. Bigger picture looks like a big adam and eve pattern, would not expose myself to this.

ChainlinkI assume Link could be in this phase of the cycle.
I expect rejection after retest of broken trendline.
Invalidation on return back above trendline.

LINK Spinning Top is Showing Signs of DemandSpinning Top off the 2.272 retracement of wave C. There is potential here for a correction to the upside. Price has made a slightly lower low on the higher time frame 1:1 window combined with the 2.272. Further down below lies an area of higher liquidity, so it's possible that price will be drawn to the lower yellow liquidity line. This area could be minor wave 3 terminal of a 5 wave impulse down.
This Publish Is Intended For Educational Purposes Only

LINK to 3 dollars -- Last exit before the elevator down.Chainlink is flashing a head and shoulders.
It is looking to break the previous bear market lows.
And there are fib retracement confluence projections that align with single digit prices.

LINK - Probable Short Squeeze Lots of equal lows lower for smashing through with potential down -20%.
There are 2 options to find trade opportunities.
1. Retracement to 12.9 and LTF confirm lower
2. A False breakout from 14.4 and LTF confirm lower.

LINK: No Risk No Gain. Link is setting up a range for a bounce over the weekend ladies and gentlemen.
Many ALTs have the same pattern, is it to continue lower? nah, at least not from the 1hr and 4hrs pov.
Play it right........Play it safe...........Know the rules of the game.
Boost.........Follow........Comment.

$LINK Potential Bull – Cycle Main PointsTokenization is the new meta.
Chainlink is front and center.
This is definitely a bit hopeful, timeline could stretch.
Purple Box:
The current trading range where price gravitates.
Red Lines:
Multi-year downtrend lines (coming from the 2021 high of $52 and connecting major tops since then). Price keeps hitting these and getting rejected.
Blue Lines:
Current upward trend line starting from the $8.24 low.
Price bounces off this line multiple times.
Currently low compared to the trend.
Green Line:
The projected upward path if we break higher.
It points to $30–$50 soon after breakout, and $80–$100+ longer-term.
White Line:
Very long-term base support (from the early years).
Orange Line:
Base line for this current cycle (from the recent low).
Light Grey Line (Middle):
The real ceilings where candle bodies (not just wicks).
Dark Grey Line (Top):
Just marks the big upside area ($90–$110) that could be reached by mid 2026 if the breakout happens.
Final thoughts:
Price is squeezed at the bottom of a wedge right on key support.
Hold around $11–$11.50 + close above $13–$14 = bounce should be strong.
Break below $10.80 = dip to $9 first, then possible reload.
Cheers to 2026 and Tokenization.

Chainlink Wave Analysis – 26 January 2026- Chainlink reversed from support zone
- Likely to rise to resistance level 14.00
Chainlink cryptocurrency recently reversed up from the support zone between the long-term support level 11.60 (which has been reversing the price from June) and the lower daily Bollinger Band.
The upward reversal from this support zone stopped the previous minor impulse wave iii from the middle of January.
Given the strength of the support level 11.60 and the oversold daily Stochastic, Chainlink cryptocurrency can be expected to rise to the next round resistance level 14.00, which stopped earlier wave ii.


LINK / USD [Chainlink] EWP TC FIB ANALYSIS WEEKLY TFChainlink macro structure shows a complete intermediate wave 3/C five-wave impulse into the 2021 high. Since then, price has been correcting that entire advance in a higher-degree Wave 4 sideways, unfolding as an A–B–C structure inside a descending corrective channel. Wave (A) completed in 2022, Wave (B) formed a multi-year complex correction, and intermediate wave (C) of primary Wave 4 is projected to continue toward channel support, with termination expected in the $2.50 region. Based on channel geometry and Fibonacci confluence, Wave 4 is expected to complete around December 2026. Until then, all upside remains corrective. Once Wave 4 finishes, Fibonacci extensions and long-term channel projections point toward the $230 region as the terminal target for the final macro Wave 5.
Like and follow for more charts like this.

Chainlink.. hmmLINK often leads bullish rallies, and current chart action suggests a potential breakout for LINK/USD. LFG!
