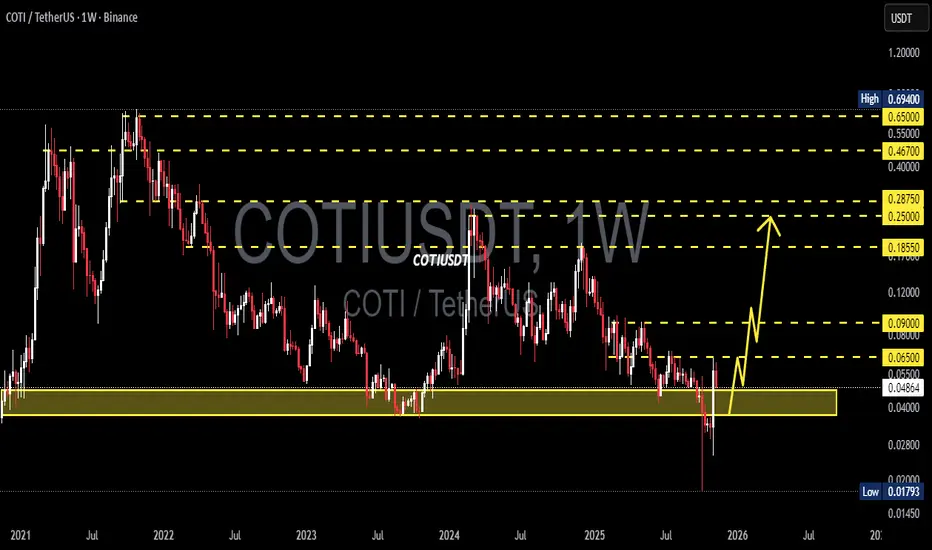
After a sharp decline reaching an extreme low around $0.017, COTI has bounced strongly and managed to close back above the key demand zone at $0.047–$0.037.
This yellow zone isn’t just any level — it represents the last stronghold of buyers, a crucial area that has repeatedly held the price since 2021.
Looking closer, the latest weekly candle shows a deep liquidity sweep followed by a massive rejection — a classic sign that big players might have “cleared out stops” and begun stealth accumulation.
---
⚡ Structure & Pattern
Primary trend: Still macro bearish, but a potential double bottom pattern is forming at the major support area.
Momentum: Buyers are showing strength after a strong lower wick rejection from the zone.
Reversal confirmation: A weekly break and close above $0.065 could open the door for a larger rally.
---
🟢 Bullish Scenario
If the price manages to hold above $0.047–$0.037 and break through $0.065, COTI could extend its move upward toward:
🎯 Target 1: $0.090 (weekly resistance)
🎯 Target 2: $0.1855 (psychological resistance & strong supply zone)
🎯 Extended targets: $0.2875 – $0.4670 if strong market momentum and altcoin rotation occur.
The next few weekly candles will be critical in determining whether this is the start of a true macro reversal or just a technical relief bounce.
---
🔴 Bearish Scenario
However, if the price falls back and closes below $0.037, all bullish bias is invalidated.
Such a move could trigger a continuation to the downside toward:
⚠️ $0.018 (previous low and key liquidity zone).
A confirmed breakdown below this main support would indicate that buyers remain weak and the long-term bearish trend continues to dominate.
---
🧩 Pattern Conclusion
COTI is now at a major decision zone.
The $0.047–$0.037 area is a battlefield between buyers and sellers.
If it holds — a potential reversal is on the horizon.
If it breaks — expect another lower low continuation.
---
🔍 Additional Insight
Many major crypto reversals often begin from structures like this:
Strong rejection from multi-year support
Weekly candle with a long lower wick
Gradual increase in accumulation volume
Thus, this zone is not just a technical bounce area — it could mark the early phase of a shift from distribution to accumulation.
---
#COTI #COTIUSDT #CryptoAnalysis #TechnicalAnalysis #AltcoinSetup #SwingTrade #LiquidityHunt #CryptoReversal #SupportZone #CryptoTrading
✅ Get Free Signals! Join Our Telegram Channel Here: t.me/TheCryptoNuclear
✅ Twitter: twitter.com/crypto_nuclear
✅ Join Bybit : partner.bybit.com/b/nuclearvip
✅ Benefits : Lifetime Trading Fee Discount -50%
✅ Twitter: twitter.com/crypto_nuclear
✅ Join Bybit : partner.bybit.com/b/nuclearvip
✅ Benefits : Lifetime Trading Fee Discount -50%
Disclaimer
The information and publications are not meant to be, and do not constitute, financial, investment, trading, or other types of advice or recommendations supplied or endorsed by TradingView. Read more in the Terms of Use.