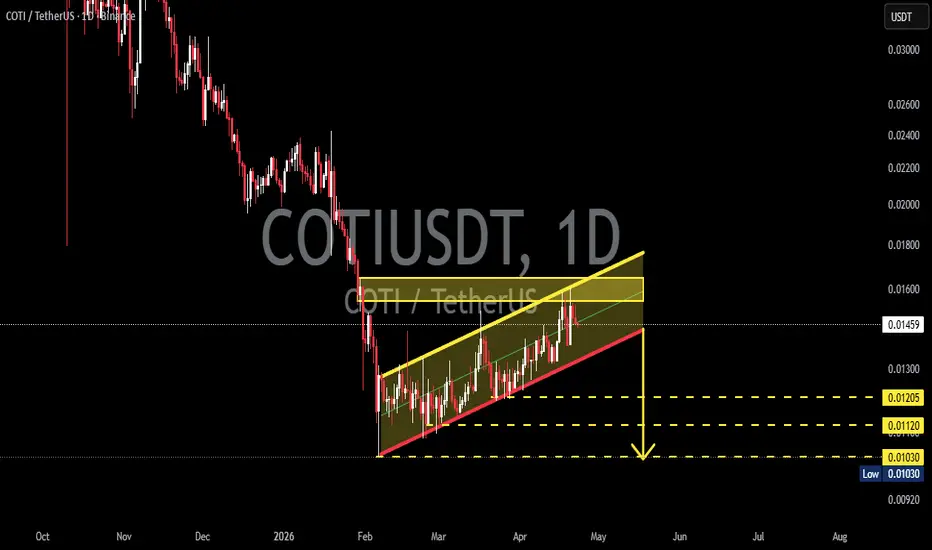
COTI/USDT — Bear Flag: Potential Continuation to the Downside?On the 1D timeframe, COTI/USDT is still within a larger downtrend structure since its peak. After a sharp decline (flagpole), price is now moving upward gradually in a consolidation phase, forming a Bear Flag pattern.
The current structure shows:
A slow and weak upward movement (flag)
Formed within a small ascending channel (yellow zone)
Still unable to break strong resistance
Price is currently positioned near the upper boundary of the flag, approaching resistance.
---
📐 Pattern Identified: Bear Flag
The Bear Flag is a:
> Bearish Continuation Pattern
Key characteristics:
Starts with a sharp drop (flagpole)
Followed by an upward consolidation (flag)
Typically ends with a breakdown continuing the downtrend
This suggests:
> The current upward movement is likely just a temporary relief before another drop
---
🔵 Bullish Scenario
A bullish case becomes valid if:
Price breaks out and closes above the flag resistance (±0.0160 – 0.0170)
Accompanied by increasing volume
Successful retest (resistance turns into support)
Potential targets:
0.0180 – 0.0200
Possible structural reversal if momentum strengthens
📌 This would signal a Bear Flag invalidation and early reversal potential
---
🔴 Bearish Scenario (Primary Outlook)
A bearish continuation is likely if:
Price breaks down from the lower boundary of the flag (support channel)
Closes below the 0.0130 – 0.0120 area
Downside targets:
0.0120 (minor support)
0.0112 (next support)
0.0103 (previous low / major support)
📉 From a theoretical perspective:
> Bear Flag targets can extend based on the length of the previous flagpole, suggesting deeper downside potential
---
📍 Key Levels
Flag Resistance: 0.0160 – 0.0170
Flag Support: ±0.0130
Key Support: 0.0120 – 0.0112
Major Support: 0.0103
---
⚠️ Key Insight
The broader structure remains bearish
Bear Flag indicates trend continuation to the downside
Current area is a critical decision zone for the next major move
---
🏁 Conclusion
COTI is forming a Bear Flag after a sharp decline, signaling a strong probability of continuing the downtrend.
Traders should:
Watch for a breakdown as a potential short opportunity
Wait for a confirmed breakout if considering a bullish scenario
#COTI #COTIUSDT #CryptoAnalysis #TechnicalAnalysis #Altcoin #BearFlag #BearishContinuation #Breakdown #CryptoTrading #SupportResistance #PriceAction
Cotisignals
#COTI (SPOT) entry range(0.07800- 0.09800) T.(0.198) SL(0.07312)BINANCE:COTIUSDT
entry range(0.07800- 0.09800)
Target1 (0.14180) - Target2 (0.198)
1 Extra Targets(optional) in chart, if you like to continue in the trade with making stoploss very high.
SL .1D close below (0.07312)
*** collect the coin slowly in the entry range ***
*** No FOMO - No Rush , it is a long journey ***
**** #Manta ,#OMNI, #DYM, #AI, #IO, #XAI , #ACE #NFP #RAD #WLD #ORDI #BLUR #SUI #Voxel #AEVO #VITE #APE #RDNT #FLUX #NMR #VANRY #TRB #HBAR #DGB #XEC #ERN #ALT #IO #ACA #HIVE #ASTR #ARDR #PIXEL #LTO #AERGO #SCRT #ATA #HOOK #FLOW #KSM #HFT #MINA #DATA #SC #JOE #RDNT #IQ #CFX #BICO #CTSI #KMD #FXS #DEGO #FORTH # AST #PORTAL #CYBER #CLV #RIF #ENJ #ZIL #APT #GALA #STEEM #ONE #LINK #NTRN #COTI ****

COTIUSDTCOTI ~ 6D
#COTI So far it continues to maintain this support block. if you have Conviction on this coin,. This support block would be a very good buy for now.
