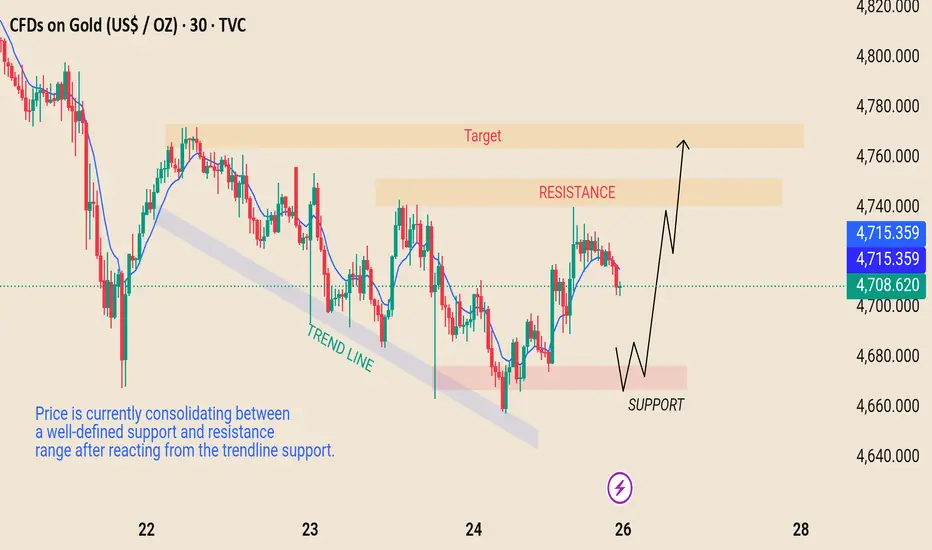
Range Structure: Support Holding, Resistance AheadPrice is currePrice is currently reacting near a short-term resistance zone after bouncing from a defined support area and trendline. Structure shows a potential range with higher lows forming, suggesting buyers are attempting to gain control.
A break and hold above resistance could open the path toward the highlighted target zone, while rejection may lead to another retest of support. Key levels remain clearly defined, so monitoring price action around these zones is important for confirmation.
This analysis is for educational purposes only and not financial advice.
Trend Lines
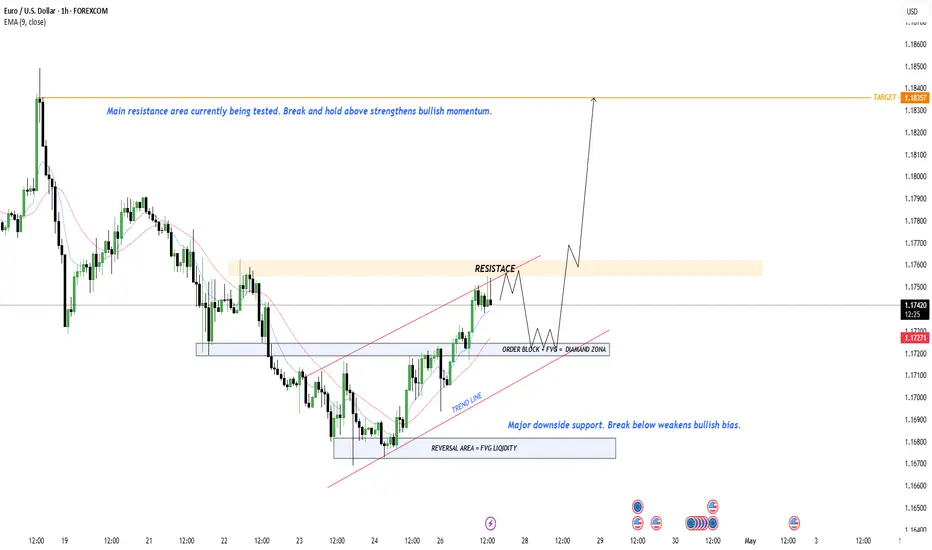
EURUSD 1H: Approaching Resistance After Trendline BounceEURUSD is approaching a key resistance zone after a bullish move from the order block and trendline support. The structure shows higher lows, indicating strengthening bullish momentum while price remains supported above the demand zone.
If price breaks and holds above the 1.1760 resistance area, continuation toward the 1.1835 target becomes more likely. However, rejection from resistance could lead to a pullback toward the 1.1720 order block support before another bullish attempt.
Bias:
Bullish while price holds above the order block and trendline support, with upside potential toward 1.1835.
Educational purposes only — not financial advice.
GOLD - Technical AnalysisICMARKETS:XAUUSD bounced off the 4668 support level toward the end of Friday’s session following a long squeeze, thereby breaking the local bearish structure. The market’s next move depends on geopolitical developments.
The dollar closed Friday in the red, and technically, the index looks poised to continue its decline. Oil is stagnant. Gold, technically, is still under pressure from bears, but Friday’s session closed above Thursday’s close, which gives us positive signals, provided that the fundamental and geopolitical backdrop supports the market. (The previous idea—a break below 4668—remains valid, provided gold returns to that level.) This coming week, all eyes are on the U.S.-Iran negotiations, as well as fundamental data: the Fed’s rate decision, the regulator’s meeting, and GDP and inflation figures.
Resistance levels: 4740, 4795
Support levels: 4668, 4644, 4600
Technically, at the moment, I expect a bounce from 4700 (4688) and a retest of the 4740 liquidity zone. A close above 4740 will open the door for continued growth toward 4800.
However, if the price fails to react at 4700 and retreats to 4668, the likelihood of a further decline will resume.
Best regards, R. Linda!

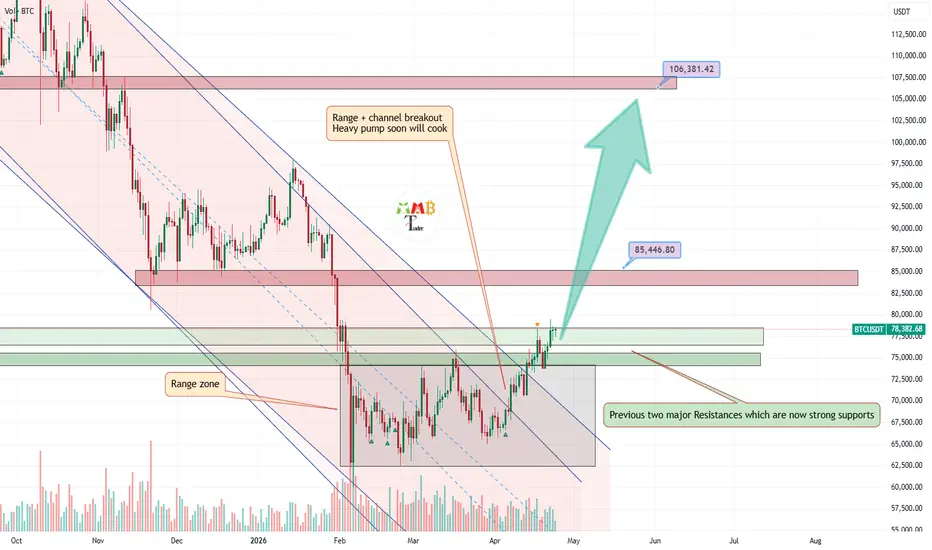
Bitcoin–Descendng Chanel and Trendline Broken, Bull Market aheadBitcoin has achieved a significant technical breakout. Both the daily descending channel and the d escending trendline resistance have now been broken to the upside. This is a major structural shift, as these two confluent resistance levels had been capping price action for an extended period.
Following the breakout, the price has also completed a valid retest of the broken resistances. In technical analysis, a successful retest occurs when the price returns to the broken resistance level (which now acts as support) and holds above it, confirming that the breakout is genuine rather than a false move. Additionally, a period of range-bound consolidation after the breakout further strengthens the new support zone.
Now that the former resistances have been transformed into strong support levels, the path of least resistance is to the upside. The next major psychological and technical target is the 80,000 level. Once Bitcoin is able to break and close above 80K, it is expected to trigger the next phase of the bull market.
This anticipated bull market comes after approximately one year of ranging and dumping, during which Bitcoin consolidated, shook out weak hands, and built a base for the next leg higher.
✍🏼Author's word: Like & comment(your thoughts) if you found it helpful.🩷
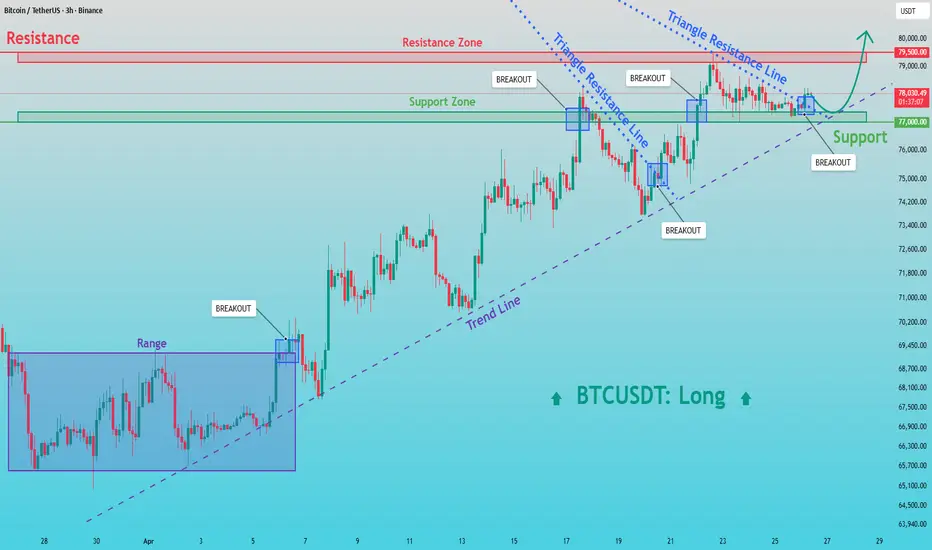
BTCUSDT: Respects Trendline - 79.5K Breakout in FocusHello everyone, here is my breakdown of the current BTCUSDT setup.
Market Analysis
Bitcoin previously traded inside a range. After the breakout, price continued higher and formed an ascending trend with consistent higher lows along the trendline. Later, the market entered a triangle structure, where multiple breakouts and retests confirmed strong buyer control.
Currently, BTCUSDT is consolidating below the 79,500 resistance zone. A recent pullback and reaction from support indicate that buyers are still active, while resistance remains the main barrier.
My Scenario & Strategy
As long as BTCUSDT holds above the 77,000 support and respects the ascending trendline, the bullish scenario remains valid. A bounce from this zone could push price toward the 79,500 resistance (TP1).
However, if price breaks below 77,000 and loses the trend structure, a deeper correction may follow.
That’s the setup I’m tracking. Thank you for your attention, and always manage your risk.
EUR/CAD: Strong Bearish Pressure📉EURCAD is currently experiencing significant bearish pressure this morning.
A bearish breakout of the support line of a flag pattern, observed within a clear intraday downtrend on an hourly timeframe, provides strong confirmation of this movement.
I anticipate that the price will soon reach the 1.5967 level.

XAU/USD | Gold at a Key Decision Level – Waiting for Direction!By analyzing the #Gold chart on the 4H timeframe, we can see that price opened the week with a bearish gap down to around $4672, but buyers quickly stepped in and pushed it back up toward $4739. However, this move lacked continuation and price is now trading around the $4692 region, sitting right at a critical support area.
From a structural perspective, the $4680 – $4700 zone is currently acting as a key demand area. As long as price manages to hold and stabilize above this level, we can expect another bullish attempt toward the nearest supply zones at $4725 – $4750, followed by $4780 – $4820 as the next major resistance cluster. In this case, short-term upside targets would be $4725, $4750, and then $4780.
On the other hand, if price fails to hold above this demand zone and we see a clean breakdown, the market could enter another bearish leg toward lower liquidity levels. In that scenario, the next downside targets would be $4665, followed by $4640, and potentially $4600 as selling pressure builds.
Overall, this is a key reaction zone where the next directional move will likely be determined. Keep in mind that the market remains highly sensitive to geopolitical developments, and any shift in tensions between Iran and the US could quickly change the direction of Gold.
Please support me with your likes and comments to motivate me to share more analysis with you and share your opinion about the possible trend of this chart with me !
Best Regards , Arman Shaban

Gold Rejection From Resistance Targets Lower LevelsGold is pulling back from a lower high and approaching the 0.5–0.618 Fibonacci support zone, where buyers may attempt to stabilize price. The overall structure shows rejection from resistance, suggesting short-term bearish pressure while price remains below the resistance band.
If price reacts positively from the 4,721–4,708 Fibonacci support zone, a corrective move back toward the 4,749 resistance may occur. However, a confirmed break below the 0.618 level could expose the downside toward the 4,669 target zone.
Bias:
Short-term bearish below resistance, with downside risk increasing if Fibonacci support fails.
Educational purposes only — not financial advice.

EURJPY - The end of the correction will lead to an uptrend FX:EURJPY remains in a bullish trend. Signs of the correction coming to an end are emerging, which generally gives the market a chance to continue its upward movement.
The currency pair has been in a bullish trend since last March. Technically, the bullish structure remains intact. The weak Japanese yen is supporting the euro’s upward movement.
Technically, the price is breaking through the resistance of the local correction and local consolidation. If the bulls keep the price above 186.8–186.87, we can expect growth to continue in the medium term.
Resistance levels: 187.92, 187.70
Support levels: 186.87, 186.43
A retest of 186.87 and price consolidation above that level will confirm the price’s readiness for growth. Zones of interest: 187.7–187.95
Best regards, R. Linda!

Gold 30M: Bullish Recovery From Fibonacci SupportGold is rebounding from the 0.5–0.618 Fibonacci retracement zone after forming a short-term higher low, suggesting early signs of bullish recovery. Price is currently approaching a descending trendline resistance, where continuation strength will be tested.
If price holds above the 4,699–4,689 Fibonacci support, buyers may continue pushing toward the 4,739 resistance zone, with a potential extension toward the 4,768 target area. However, rejection at the trendline resistance could lead to another pullback toward the support zone before continuation.
Bias:
Short-term bullish while holding above Fibonacci support, with upside potential toward 4,739 and 4,768.
Educational purposes only — not financial advice.

Bitcoin Rebound Scenario – Push Toward 79,000 IncomingHello traders! Here is my technical outlook based on the current BTCUSDT (1H) chart structure. Bitcoin previously traded within a range, showing consolidation before a breakout that confirmed bullish momentum. After the breakout, price continued higher and formed an ascending structure with consistent higher lows along the trend line. Currently, price is holding above the 77,000 buyer zone, which acts as strong support, while approaching the 79,000 resistance level (seller zone). At the same time, a descending resistance line is limiting upward movement, and a recent rejection suggests short-term selling pressure. As long as BTCUSDT holds above the 77,000 support and respects the ascending trend line, the bullish bias remains valid. I expect a potential rebound from this zone, which could push price toward the 79,000 resistance (TP1). Please share this idea with your friends and click Boost 🚀

AUDCAD Potential Upsides! Hey Traders, in today's trading session we are monitoring AUDCAD for a buying opportunity around 0.97600 zone, AUDCAD is trading in an uptrend and currently is in a correction phase in which it is approaching the trend at 0.97600 support and resistance area.
Trade safe, Joe.

GBPCHF Potential Upsides!Hey Traders, in tomorrow's trading session we are monitoring GBPCHF for a buying opportunity around 1.06000 zone, GBPCHF is trading in an uptrend and currently is in a correction phase in which it is approaching the trend at 1.06000 support and resistance area.
Trade safe, Joe.

Bitcoin Market Structure Shift – From Bearish to BullishBitcoin is transitioning from a bearish trend into a bullish structure after breaking key resistance.
Holding above current levels strengthens the bullish case.
A sustained move could push BTC toward 100K psychological level, then extend toward 115K–126K.
Key Levels:
Support: 70K – 72K
Mid Target: 97,466
Major Targets: 115,926 → 126,241
Not Financial Advice

BTCUSD - Adaptive Regression ViewThis chart is built with two tools: Adaptive Trend Channel and Adaptive Projection.
The goal is to avoid subjective trendlines and let regression channels identify the most relevant trend structure across multiple horizons.
Current BTC structure:
- Very long-term: still upward, but price remains below the channel.
- Long-term: still downward, with price testing the upper side.
- Short-term: strongly bullish, showing a clear recovery impulse.
The interesting part is the conflict between timeframes. BTC has a bullish short-term push, but it still needs to break the larger declining structure to confirm a stronger recovery.
The Adaptive Projection blends these regimes and currently projects a constructive path with +15.4% annualized line return.
To me, this looks like a transition phase: bullish locally, not fully confirmed structurally.

Liquidity Grab Below Support Could Trigger Massive Bull RunGold is approaching a strong support zone near 4285, where a potential liquidity sweep may occur.
A short-term dip into this area could trap sellers before a strong bullish reversal.
If price holds, the next upside targets remain 4989, followed by 5596 and 5844.
Key Levels:
Support: 4285
Targets: 4989 → 5596 → 5844
Not Financial Advice

XAUUSD Long: Supported by Trendline - Recovery Targets 4,780Hello traders! Here’s my technical outlook based on the current XAUUSD (2H) chart structure. Gold previously traded below a descending supply line. After several breakout attempts, price found a bottom at a pivot point and shifted into a recovery phase, forming higher lows.
Currently, price is holding above the 4,660 demand zone, which acts as key support, while approaching the 4,780 supply zone. A recent test and rejection from this area indicates selling pressure, while the ascending trend line continues to support price from below.
As long as XAUUSD holds above the 4,660 support and respects the ascending trend line, the bullish bias remains valid. A bounce from this zone could push price toward the 4,780 resistance (TP1). Manage your risk!

Microsoft Corp. (MSFT): A Clear BreakoutAs of April 24, 2026, Microsoft (MSFT) stock is trading around $423-$424.62, showing a modest daily increase of over 2% despite recent volatility and a broader tech sector consolidation. the stock is recovering from a 52 week low of $356.28 set in March 2026, while analysts maintain a strong buy consensus with a significantly high long term fair value estimate.
Technical outlook:
The stock made an importance breakout around $420-$423 resistance levels, in respect of the structure. After a retest of breakout , price is slowly making a retracement upward. however we anticipate buy continuation.
Key points:
More bullish confirmation at this moment, activates buy position eyeing $470.08, as next potential bullish.
Thanks for reading.

GOLD | Bullish Bias Above 4695 Ahead of Fed & Iran TalksGOLD | Bullish Bias Above 4695 Ahead of Fed & Iran Talks
Gold is holding near 4700 as markets adopt a cautious wait-and-see stance ahead of renewed U.S.–Iran negotiations, the Federal Reserve decision, and broader central bank meetings this week.
Although bullion ended last week under pressure, gold continues to maintain a constructive bullish structure, while inflation risks linked to Middle East tensions remain supportive for safe-haven demand.
Technical Outlook
As long as price holds above 4695, bullish momentum remains active toward 4718 and 4739, with further upside potential toward 4772.
A 1H close below 4695 would signal a corrective pullback toward 4677 and 4658.
However, 4658 remains a critical support zone. A break below this level would shift the structure bearish and open downside toward 4595.
Key Levels
Pivot Line: 4695
Support: 4677 – 4658 – 4595
Resistance: 4718 – 4739 – 4772
Bias: Bullish while above 4695 | Bearish below 4658
Volatility is likely to remain elevated around Fed guidance and geopolitical headlines, making 1H confirmation closes essential for breakout validation.

NZDUSD - Channel Resistance RejectionHello Trading Fam! 👋
Price is in a rising channel and approaching a strong resistance zone.
👉 Idea:
Look for shorts near resistance
Expect a rejection → move back to channel low
📉 Bias: Short at top of channel + resistance confluence
Don’t forget to like and share your thoughts in the comments! ❤️

XAUUSD: Short Wave C Near Sell Zone
Gold is pushing into a sensitive area, but from Kelly’s perspective, the current recovery is more likely the final short wave C of a corrective structure rather than the start of a sustainable bullish trend. What makes this zone especially important is that price is approaching the 4742–4748 sell zone, where the short-term structure may complete before the market begins a new cycle on the higher timeframe.
Technical structure
The current structure shows gold still reacting below near-term resistance, even though the short-term rebound remains in place. Price is moving into a clearly marked supply area, while still trading below the broader strong resistance at 4889, with no decisive breakout strong enough to confirm a higher-timeframe bullish reversal.
What matters here is that this rebound is developing after a multi-leg corrective phase, and the 4742–4748 area aligns with a potential sell region on the chart. That puts the market into a decision zone: buyers would need to push clearly above it to shift the structure, while failure in this area could quickly bring sell-side pressure back.
Key levels to watch:
4742–4748: nearest sell zone
4640: support level confirming short-term weakness
4548: next strong support area
4351: deeper support zone if the new bearish cycle expands
Elliott Wave view
From an Elliott Wave perspective, the current rebound fits best as the final short wave C of the corrective phase. If that count is correct, then the market is approaching the end of the rebound, and the next important move would be the completion of wave C, followed by the start of a new cycle on the higher timeframe.
This is the key point Kelly is focusing on. A final wave C can still look strong in the short term, but if it completes directly into supply and is followed by a clear reversal candle, the market often shifts direction quite quickly. That is why the main focus is not simply that price is rising, but where it is rising into and how it reacts once it reaches that zone.
Fibonacci and liquidity structure
Structurally, the current rebound is also approaching an area that makes sense for a corrective move to complete. Price is moving into a short-term supply region, while lower liquidity still sits below at 4548, and deeper down at 4351.
That keeps the downside scenario technically attractive, especially if wave C ends with a clear rejection candle inside the current sell zone. When supply, wave structure, and liquidity begin to align, the market often reacts in a meaningful way.
What matters next
If gold reaches 4742–4748 but fails to close firmly above that area, while also printing a clear reversal candle, it would suggest that the short wave C may be complete. In that case, the market could begin rotating back towards 4640 first.
If 4640 breaks, the bearish structure would strengthen and open the path towards 4548. If selling pressure expands further in line with the higher-timeframe cycle, then 4351 becomes the deeper technical reference.
On the other hand, if price breaks cleanly above the sell zone and holds there, then the current wave count would lose quality and the chart would need to be reassessed.
Kelly’s view
For Kelly, this is still a wave-C completion setup, not a breakout structure strong enough to justify a broader bullish continuation. The current rebound may still stretch slightly higher, but as long as price is reacting inside 4742–4748, the preferred view remains to watch for reversal confirmation that would signal the end of wave C.
As long as gold cannot decisively break above the current supply zone, Kelly’s bias remains that the market is completing its short corrective rebound and preparing to begin a new higher-timeframe cycle.
Conclusion
Gold is currently trading in its final short wave C, and price has now entered the important 4742–4748 sell zone. This is the area to watch closely, because if a clear reversal candle appears, the market may confirm the end of the rebound and begin a new bearish cycle on the higher timeframe.
The rebound is still visible.
But if wave C finishes inside this supply zone, the more important move in gold may soon return to the downside.

S&P500 INDEX (US500): Bullish Intraday Price Action
A quick follow-up for US500.
I see a strong intraday bullish price action after a retest
of a recently broken structure.
We can expect the price to rise soon.
❤️Please, support my work with like, thank you!❤️
I am part of Trade Nation's Influencer program and receive a monthly fee for using their TradingView charts in my analysis.

GBPAUD - Bearish Retest – Short BiasHello Trading Fam! 👋
Market is overall bearish (downtrend channel).
Price is retesting a key structure/resistance zone.
Confluence with trendline = sell area.
Plan: Look for shorts.
Expectation: price moves lower.
Don’t forget to like and share your thoughts in the comments! ❤️
