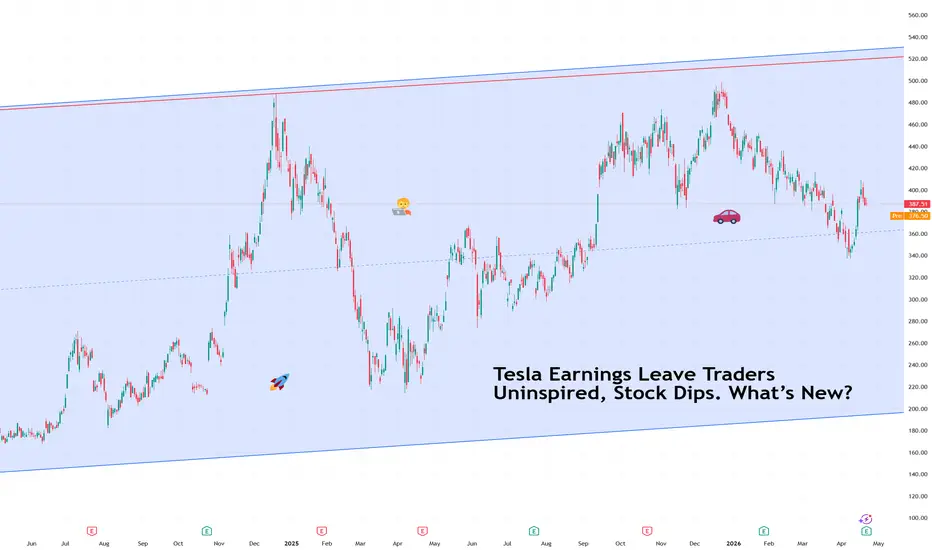
Tesla Earnings Leave Traders Uninspired, Stock Dips. What’s New?Strong numbers arrived. Bigger questions arrived with them.
Tesla NASDAQ:TSLA reported quarterly earnings that technically cleared expectations. Revenue reached $22.4 billion, slightly ahead of forecasts, while adjusted earnings per share landed at $0.41, above the expected $0.36 .
Free cash flow surprised to the upside as well, coming in at $1.4 billion instead of the loss analysts anticipated. On paper, this looked like the kind of report that normally lifts a stock.
Shares did rise briefly in after-hours trading. Then the mood changed during the earnings call. In other words, the earnings season is here and it’s getting heated.
📉 Call Shifted the Narrative
Markets rarely react only to numbers. Guidance often matters more than the quarter itself. During the call, Elon Musk outlined plans for a major expansion in capital spending tied to robotaxis, robotics, trucks, and artificial intelligence infrastructure.
Tesla now expects roughly $25 billion in capital expenditure this year, up from prior guidance of $20 billion. But also, a big increase from last year’s $8.5 billion.
Investors quickly recognized what that means. Higher spending today usually delays profits tomorrow. Enthusiasm faded almost immediately.
🤖 Company Is Changing Shape
Tesla continues to move away from its origin story as a pure electric vehicle manufacturer. The retirement of Model S and Model X reflects that shift. The focus now centers on Cybercabs, humanoid robots, AI chips, and autonomous logistics.
Meanwhile, operating profit rose sharply, climbing 136% year over year to $941 million. Yet the conversation increasingly revolves around what Tesla might become rather than what it currently sells.
🏗️ Capex Is the New Headline
Capital expenditure refers to money spent building factories, infrastructure, and future products. It signals ambition, though it also signals patience is required.
Tesla’s quarterly capex reached $2.5 billion, already elevated. Musk indicated the pace will accelerate significantly as the company develops robotics platforms and builds a massive chip facility tied to its autonomy strategy.
Big Tech rivals plan to spend roughly $660 billion this year on similar infrastructure. Tesla clearly wants a seat at that table.
🚕 Robotaxis Still Live in the Future
The robotaxi story remains central to Tesla’s valuation narrative. The company continues running limited pilot programs in parts of Texas, though Musk indicated meaningful revenue from autonomous ride networks will likely arrive next year rather than immediately.
Investors tend to discount future earnings into today’s stock price. When timelines stretch, patience becomes part of the trade.
🛰️ Musk Ecosystem Expands
Tesla’s strategic orbit (pun intended) continues overlapping with Musk’s broader technology network. The company invested $2 billion into xAI earlier this year, and that stake later converted into equity connected to SpaceX following reshuffling across Musk’s ventures.
Speculation about deeper integration between Tesla and SpaceX continues circulating among analysts. Such moves would reshape how investors interpret Tesla’s identity as both an automotive and infrastructure platform. Especially with the upcoming SpaceX IPO , likely coming in a couple of months.
📊 Familiar Stock Reaction
Tesla’s stock often reacts less to what happened last quarter and more to what investors expect next year.
Adjusted profits rose 56% to $1.5 billion after excluding cryptocurrency losses ($173 million loss on 11,509 Bitcoin BITSTAMP:BTCUSD ) and higher stock-based compensation, yet the market focused on spending plans rather than earnings strength.
That pattern has become familiar. Tesla reports solid results. Musk outlines bigger ambitions. Traders reassess timelines.
🎁 The Takeaway
Tesla delivered a respectable quarter with improving profitability and stronger-than-expected cash flow. But the muted stock reaction reflects a company operating in transition rather than decline.
Markets appear willing to support Tesla’s long-term robotics and autonomy strategy, though they remain cautious about how quickly those bets translate into revenue.
Off to you : Is Tesla still an electric vehicle company with an AI side project, or is it becoming an AI company that happens to sell cars along the way? Share your views in the comments!
Teslastock
Tesla Inc. (TSLA) | Bullish Technical Outlook🚗⚡ TSLA Market Profit Playbook – Bullish Swing Strategy
Asset: Tesla, Inc. (TSLA) - NASDAQ Stock Exchange
Current Price: $445.01 (as of Jan 12, 2026)
52-Week Range: $214.25 - $498.83
📊 MARKET SNAPSHOT – REAL-TIME FEED
Live Price Action:
Current trading at $442.83 with intraday range $438.00 - $444.50
All-time high closing price was $489.88 on December 16, 2025
Average daily volume: 60.35M shares
Market cap: $1.48 trillion
Recent Performance:
Stock gained 19.18% over past 4 weeks as of Jan 6, 2026
Year-over-year performance: +13.27%
🎯 TRADING PLAN: BULLISH SETUP
📍 Entry Strategy: Layered Limit Orders (Thief Method)
This strategy uses multiple buy limit orders to scale into positions at favorable levels:
Layer 1: $430.00
Layer 2: $440.00
Layer 3: $450.00
Note: You can add additional layers based on your risk appetite and capital allocation strategy. This scaling approach reduces average entry cost and manages downside risk.
🎯 Take Profit Target:
Primary TP: $490.00 (near recent all-time high resistance zone)
Reasoning: Price approaching the $498.83 52-week high creates a strong resistance zone where profit-taking is expected. The $490 level acts as a police barricade (strong resistance + potential trap zone).
⚠️ Disclaimer: This is MY target level. You have the freedom to set your own profit targets based on your trading style and risk management. Take profits when YOU'RE comfortable – it's your capital, your decision.
🛑 Stop Loss:
Thief SL: $420.00
Risk Management: Positioned below recent support to prevent minor volatility from triggering exits
⚠️ Disclaimer: This is MY stop-loss level. You're encouraged to set your own stop-loss based on your risk tolerance and account size. Protect your capital at YOUR chosen level.
📈 TECHNICAL ANALYSIS
Chart Structure:
Price currently consolidating in mid-channel after pullback from $498.83 high
Stock lies in middle of wide, weak rising trend in short term with further rise signaled
Support from accumulated volume at $429.24 may hold as buying opportunity
Average True Range: 3.35% daily volatility (medium risk profile)
Key Levels:
Support: $429-430 (volume accumulation zone)
Resistance: $490-498 (police barricade resistance cluster)
🌍 FUNDAMENTAL & ECONOMIC FACTORS
Upcoming Catalysts:
Q4 2025 Earnings Release: Wednesday, January 28, 2026 (after market close)
Expected EPS: $0.45 per share
Q4 deliveries of 418,227 vehicles announced (down 15% YoY)
Delivery Performance:
Full year 2025 deliveries: 1.64M units (down 8.6% from 1.79M in 2024)
Energy storage deployments reached record 14.2 GWh in Q4
Industry Headwinds:
Global EV sales growth expected to slow to 12% in 2026 vs 23% in 2025
Federal EV tax credit expired September 2025, impacting affordability
BYD overtook Tesla as world's largest EV seller with 2.26M units sold in 2025
Technical Sentiment:
Analyst consensus: 20 buy, 10 sell ratings (Neutral overall)
Average 12-month price target: $403.32 (High: $600, Low: $120)
🔗 CORRELATED PAIRS TO WATCH
EV Sector Correlation:
NASDAQ:RIVN (Rivian Automotive) - Direct EV competitor
NASDAQ:LCID (Lucid Group) - Luxury EV segment
NYSE:NIO (NIO Inc.) - Chinese EV manufacturer
Tech/AI Correlation:
NASDAQ:NVDA (Nvidia) - AI chip supplier for Tesla's FSD technology
NASDAQ:MSFT (Microsoft) - Cloud/AI infrastructure plays
NASDAQ:META (Meta Platforms) - Nasdaq-100 stocks historically rise in January 70% of time with 2.5% average return
Key Relationship: Tesla's performance increasingly tied to its AI/autonomous driving narrative rather than pure automotive sales. Monitor semiconductor and tech sector momentum as leading indicators.
⚠️ RISK FACTORS
Earnings Volatility: Q4 earnings could create structural shift if margins compress or delivery guidance disappoints
Competition: Intense competition from Chinese manufacturers, particularly BYD's 28% growth rate
Political Risk: Musk's political activities have triggered consumer backlash in Europe and U.S.
Valuation Concerns: Director James Murdoch sold 60,000 shares at $445.40 on January 2, 2026
🎪 TRADING WISDOM: THE THIEF'S PLAYBOOK
This setup represents a swing trade opportunity in a consolidating market leader. The layered entry approach (Thief Strategy) provides:
✅ Cost averaging benefits
✅ Reduced timing risk
✅ Flexibility to scale position size
Remember: Markets reward patience and discipline. The goal isn't to catch the perfect bottom – it's to position yourself in the profit zone and manage risk effectively.
✨ "If you find value in my analysis, a 👍 and 🚀 boost is much appreciated — it helps me share more setups with the community!"

TSLA Daily Chart: Critical Retest or Continuation Lower AheadTSLA Daily Chart: Uptrend Exhaustion + Signs of Seller Control + Critical Retest or Continuation Lower Ahead
Tesla (TSLA) enjoyed a powerful bullish swing throughout much of 2024-2025, fueled by strong demand, accelerated price action, and impressive extensions that carried the stock toward the $500 level. This extended advance reflected robust buyer conviction and momentum.
However, several technical developments now indicate fading upside momentum and a potential shift in control toward sellers.
Aggressive Downward Leg After Peak Rejection
Following the approach to ~$500, a decisive new leg lower emerged, erasing the majority of those prior gains with notable conviction. This decline halted at fresh support in the ~225 area, where buyers eventually stepped in to defend price.
The speed, volume, and lack of meaningful retracement during this drop were classic signs of aggressive selling pressure overwhelming residual demand.
Weaker Recovery Attempt & Diminishing Momentum
The subsequent leg higher revealed early signs of exhaustion and buyer fatigue. Compared to the prior advance:
Pullbacks were more frequent and deeper.
The recovery required significantly more time (approximately 4-5x longer) to reclaim previous highs.
No new meaningful extensions materialized beyond the prior peak area.
This slower, choppier advance with reduced conviction is a textbook indication that demand is weakening while supply begins to assert itself.
Prolonged Trading Range at the Second Top
At this retested high zone, price has transitioned into an extended consolidation/trading range. The lack of strong follow-through buying, combined with repeated failures to generate sustained upside momentum, suggests sellers are accumulating positions and demand is not yet aggressive enough to reclaim control.
This phase reflects a classic battle between supply and demand, often seen in distribution or early reversal structures.
Current Situation – Neutral-Bearish Bias with Key Confirmation Levels
The overall structure points to a neutral-to-bearish posture in the near term. We are likely in a transitional phase where the balance of power is tilting toward sellers, but confirmation is still required.
Key scenarios to monitor:
A retest of local resistance (near the recent highs or overhead supply zone) could provide a higher-probability area for rejection and downside continuation.
Alternatively, an immediate ease of movement lower—ideally with increased conviction and volume—would confirm seller dominance and target a retest of the prior lows around 225.
My Bias & Plan
Primary expectation: Continued pressure with a likely retest of overhead resistance followed by rejection, or a direct breakdown signaling deeper continuation toward stronger support below (potentially revisiting the 225 zone or lower).
At present, the price action suggests we remain in a Phase B-like environment (accumulation/distribution), where patience is essential. Chasing the current consolidation carries lower probability.
I prefer to wait for clearer confirmation—either a failed retest of resistance with bearish price behavior or decisive downside momentum—before considering directional exposure.
Monitor closely for signs of further weakening (e.g., failed rallies, increasing downside volume, or bearish patterns). The resolution around current levels or on a retest will provide significantly higher-probability information about the next major leg—potentially lower until more robust demand emerges at lower supports.
Patience remains key here. The coming sessions/weeks should reveal whether this is a temporary pause or the early stages of a broader trend shift.

TSLA Risk-Off Structure: Technical Weakness Developing🦹♂️ TSLA — THE HEIST IS ON! Bearish Profit Playbook | Swing & Day Trade 💰📉
"We don't predict markets. We rob them." — The Thief OG Manifesto
🎯 THE MISSION BRIEF
Asset: NASDAQ: TSLA — Tesla, Inc.
Bias: 🔴 BEARISH — The bears are circling the garage!
Style: ⚡ Swing Trade / Day Trade
Current Price (Feb 18, 2026): ~$410 — down ~16% from ATH $489.88 (Dec 2025)
🔫 ENTRY ZONE — Any Price Level (Multi-Entry)
No single magic entry here. Whether you catch it at current levels or on a minor bounce, the bearish structure holds. Scale in smart, use your own risk management — this is YOUR operation.
💡 Enter on confirmed breakdown candles — bearish engulfing, shooting star, or break-of-structure on lower timeframes. Don't chase. Let price come to you.
🎯 TARGET — $370.00
🔹 Strong moving average support converges near this level — a natural price magnet on the way down.
🔹 RSI approaching oversold on higher timeframes — a reaction zone is likely here.
🔹 Bear trap risk near $370 — smart money may defend it aggressively.
🔹 Cross-asset correlations confirm bearish momentum (see pairs section below).
⚠️ Hit your target, take your loot, and vanish. $370 is the exit door — don't miss it!
🛑 STOP LOSS — $450.00
Place SL at $450.00 only after your entry is confirmed with a breakdown signal. Don't pre-set it before confirmation.
🚨 SL placement is YOUR call. Know your risk tolerance, size your position accordingly. The SL is the fire exit — know where it is, but don't stand next to it.
📊 TECHNICAL SNAPSHOT
📉 Trend is bearish — price declining from ATH $489.88 (Dec 2025), lower highs forming.
📊 RSI momentum is weakening on the daily — sellers dominating bounces.
📈 Key MAs converging near $370 as the primary target support zone.
📦 Volume is declining on relief rallies — classic distribution pattern.
🪤 Bear trap risk near target — exit quickly, don't overstay the welcome.
Key levels: 🔴 Resistance $435–$450 (SL region) · 🟡 Mid $395–$400 (bounce watch) · 🟢 Target $370.00
🏦 FUNDAMENTAL ANALYSIS
🔻 EV demand is slowing — BYD and Xiaomi are eating Tesla's lunch, especially in China where Xiaomi's EV outsold Model Y (Feb 2026).
🔻 Operating income at $1.41B reflects ongoing margin pressure — 6th year-over-year decline in 8 quarters.
🔻 Forward P/E remains elevated vs. auto peers — heavy future growth (Cybercab, Optimus) is priced in but undelivered.
🔻 Elon Musk's DOGE involvement creates headline risk and brand damage in key European markets (EU sales declining).
🔻 Tesla's Austin Robotaxis logged 14 reported incidents since launch (June 2025) — regulatory scrutiny rising.
🔻 27-analyst consensus (Feb 17, 2026): HOLD rating, avg price target ~$393–$396 — below current price, implying downside bias.
🟡 Bullish counterpoint — FSD subscriptions at 1.1M+ active users, energy segment growing. Know your enemy before the heist.
🌍 MACRO & ECONOMIC FACTORS
🇺🇸 US tariff uncertainty around EV credits adds policy risk.
📊 Elevated Fed rates keep pressure on high-valuation growth stocks like TSLA.
🛢️ Lower energy prices reduce consumer urgency to go electric.
🌐 Chinese EV makers are gaining global market share aggressively.
🏭 Potential rollback of EV tax credit advantages hurts Tesla's pricing edge.
🔗 CORRELATED PAIRS TO WATCH
Watch these in USD — if they align bearish, your TSLA thesis gets stronger:
🚗 RIVN (Rivian) — EV sector peer. Weakness = sector-wide selloff confirmed.
⚡ NIO (NIO Inc.) — China EV signal. Bearish = global EV demand declining.
📊 QQQ (NASDAQ 100 ETF) — Tech correlation. QQQ breakdown accelerates TSLA drop.
🔋 LIT (Lithium ETF) — EV materials. Declining = demand slowdown signal.
📈 SPY (S&P 500 ETF) — Broad risk-off amplifies the move.
💵 DXY (US Dollar Index) — Rising DXY = headwind for growth stocks.
🪙 ARKK (ARK Innovation ETF) — Growth/innovation proxy. ARKK weak = TSLA weak.
💡 Confluence signal: QQQ + ARKK both falling + DXY rising = TSLA bearish momentum on steroids. ✅
📋 TRADE SUMMARY
🦹 TSLA THIEF TRADE — BEARISH EDITION
━━━━━━━━━━━━━━━━━━━━━━━━━━━━━━━━
📌 Asset : TSLA (Tesla, Inc.)
📅 Date : Feb 18, 2026
💰 Entry : Any Level (Multi-Entry)
🎯 Target : $370.00
🛑 Stop Loss : $450.00
📊 Bias : 🔴 BEARISH
⏱️ Style : Swing / Day Trade
━━━━━━━━━━━━━━━━━━━━━━━━━━━━━━━━
🎭 THIEF OG NOTE
🎩 Dear Ladies & Gentlemen — Fellow Thief OGs,
I am NOT recommending you follow only my TP ($370) or SL ($450) blindly. These are coordinates on the heist map — your execution is your own mission. Make money → Take money → Walk away clean. That's the Thief Code. 💼
Trade at your own risk. Never risk more than you can afford to lose.
✨ "If you find value in my analysis, a 👍 and 🚀 boost is much appreciated — it helps me share more setups with the community!"
📜 Disclaimer: This is a Thief Style Trading Strategy — shared purely for educational and entertainment purposes only. This is NOT financial advice. All trade ideas are for informational use only. Past performance does not guarantee future results. Always conduct your own due diligence. This is just for fun. 🦹♂️💰
Published by: The Thief OG Trader | TradingView Ideas | Feb 2026

Tesla: Struggling to Gain MomentumTesla’s share price has recently been sluggish and, despite several attempts, has struggled to gain meaningful upward momentum. Our primary expectation is that the stock will regain upward pressure and set a new high for green wave . Only after this move do we anticipate a corrective phase that should push price below support at $367.72. Ultimately, we expect the corresponding low to form near $297.83. In our alternative scenario, Tesla may have already completed green wave alt. with the most recent significant peak. In this case, we would expect direct sell-offs below support at $367.72 (probability: 33%).

Price Reacting at Major Resistance with Downside TargetsThis 1-hour TSLA chart shows a strong bullish recovery following a clear change of character (CHoCH), with price trending higher inside an ascending channel. The recent move has brought price into a key resistance zone, where rejection is starting to appear.
A Fair Value Gap (FVG) is highlighted near the resistance area, suggesting potential for a short-term retracement. If price confirms weakness, the chart outlines two downside targets, with the first target aligned near prior structure support and the second target at a deeper demand zone.
Overall, the chart reflects a wait-and-react scenario, where rejection from resistance could lead to a corrective move, while holding above structure would keep the bullish trend intact.

Is Tesla Setting Up for a Rebound? Key Entry Levels Inside🎯 TSLA: The "Thief Strategy" Playbook | Swing/Day Trade Setup 📈
🔥 Quick Overview
Asset: Tesla, Inc. (TSLA)
Bias: 🐂 BULLISH
Strategy Type: Thief Layering Entry Method
Risk Level: Medium-High (Swing/Day Trade)
💰 The "Thief" Entry Strategy Explained
The "Thief Strategy" uses multiple limit orders (layering method) to accumulate position at different price levels. Think of it like setting traps at various floors of a building—you catch opportunities wherever price decides to visit! 🎣
📊 Entry Zones (Layer Your Orders):
Layer 1: $430.00
Layer 2: $435.00
Layer 3: $440.00
💡 You can add more layers based on your own risk appetite and account size. The beauty of layering? You average your entry and reduce timing risk!
🛡️ Stop Loss (SL):
Thief SL: $415.00
⚠️ Important Note: This is MY stop loss level based on the Thief Strategy framework. You're the captain of your own ship! 🚢 Adjust your SL based on YOUR risk tolerance and account management rules. Trade at your own risk—make money, take money, manage wisely!
🎯 Target (TP):
Primary Target: $490.00
🚨 Why $490? This zone represents a confluence of:
Strong resistance area
Potential overbought conditions
Historical trap zone where bulls get exhausted
📢 Thief OG's Reminder: I'm NOT saying you MUST take profit only at my TP level. If you see profits that make you smile, SECURE THEM! 💵 The market gives, and the market takes. Be greedy when you can, be smart always.
🔍 Technical Analysis Breakdown
Tesla is showing bullish momentum structure with potential for continuation toward the $490 resistance zone. The layering strategy allows us to build position as price potentially dips into demand zones before the next leg up.
Key Technical Levels:
Support Zone: $430-$440 (Our entry layers)
Invalidation: Below $415 (Stop loss)
Resistance Target: $490
📌 Related Pairs to Watch (Correlation Play)
Understanding correlated assets helps confirm your thesis:
AMEX:SPY (S&P 500 ETF)
TSLA often moves with broader market sentiment
Watch SPY for overall risk-on/risk-off environment
NASDAQ:QQQ (Nasdaq 100 ETF)
Tech-heavy index where TSLA is a major component
Strong correlation with TSLA price action
NASDAQ:NVDA (NVIDIA)
Both are high-beta tech growth stocks
Often move together during risk appetite shifts
TVC:DXY (US Dollar Index)
Inverse correlation: Strong dollar = pressure on growth stocks like TSLA
Weak dollar = tailwind for equities
💡 Key Point: If SPY/QQQ are bullish + DXY weakening = Strong confirmation for TSLA upside!
⚡ Trading Tips for Thief OG's
Don't FOMO — Let price come to your layers
Manage position size — Each layer should be equal weight
Trail your stop — Once profitable, protect gains
Watch volume — Confirm breakouts with volume spikes
Stay flexible — Market conditions change; so should you!
🎬 Final Words
This setup is all about patience, precision, and profit extraction! 🎯 The Thief Strategy isn't about stealing from the market—it's about being SMART and setting yourself up for success with calculated entries.
Remember: The best trades are the ones where you're prepared, not scared! 😎
✨ If you find value in my analysis, a 👍 and 🚀 boost is much appreciated — it helps me share more setups with the community!
#TSLA #TeslaStock #SwingTrading #DayTrading #ThiefStrategy #LayeringStrategy #StockMarket #TradingIdeas #TechnicalAnalysis #BullishSetup #TradingStrategy #RiskManagement #StockTrading #MarketAnalysis #TradingCommunity

Tesla Stock Lifts 2025 Gains to 20% as Traders Eye Santa RallyA megacap squeezing in one more rally before year-end? Yes, please.
🚗 A Holiday Glide Higher for Tesla Shares
Tesla NASDAQ:TSLA is heading into December with solid momentum. Coming into Monday, the stock has risen 20% since January, putting it on track for a third straight annual gain .
Investors will gladly take it. Tesla isn’t exactly a low-volatility cuddle toy — this is a stock that fell 65% in 2022, then turned around and doubled in 2023, then tacked on another 63% in 2024.
Still, the long arc is impressive: since Tesla's 2010 IPO, the stock has only posted annual declines twice — in 2016 and that infamous crash year of 2022. This year’s 20% gain looks tame by Tesla standards, but context matters: tame is good.
🎅 Santa Rally Season: Will Tesla Join the Party?
This is the time of year when traders start looking for that special year-end swing called Santa rally.
Fortunately, December has been good to Tesla shares. Really good. The stock has risen in more than half of all Decembers since its flotation 15 years ago, with nine monthly gains and six declines over its life as a public company.
Why does the Santa rally happen?
• Some say it’s psychology: investors in a good mood tend to buy.
• Some say it’s portfolio managers smoothing out their year-end reports.
• Others point to tax strategies, retail flows, or just holiday optimism.
No one really knows — which makes it the perfect market myth. But if Santa does show up this year, Tesla benefits. A few cheerful sessions could be enough to lock in another positive annual finish.
Just don’t confuse December with easy money. Historically, it’s just as volatile as every other month — and sometimes worse.
🔥 When December Isn’t So Jolly
Want a reminder that Tesla can rewrite the script in both directions? Look no further than December 2022, when the stock plunged 37% in a single month.
Back then, investors worried CEO Elon Musk’s bold acquisition of Twitter (now X) was consuming far too much of his attention — at the cost of Tesla’s market cap.
The 2025 backdrop is far calmer. Today’s concerns are more traditional Tesla fare:
• How many cars will it deliver?
• What will margins look like?
• Is the growth runway intact?
• What type of robots will Elon talk about on the next call?
December can still swing.
📦 Deliveries: The Real Catalyst on Deck
But traders love a year-cap rally. Even more so when there’s something to bet on.
Expectations for Tesla’s Q4 2025 deliveries sit between 507,000 and 512,000 vehicles, a number that would help confirm a steady, if not explosive, growth narrative.
More importantly, full-year 2025 deliveries are projected to exceed 2 million units, aligning with Elon Musk’s long-term growth target of 20–30% year-over-year production.
In Tesla’s world, hitting numbers is the difference between “Tesla has momentum” and “Tesla is broken again.”
That means Q4 data — arriving Thursday, January 1 or Friday, January 2, 2026 — will be key for this year’s narrative. The numbers drop early in the morning while everyone is still recovering from celebrations, and suddenly your phone buzzes with either joy or existential dread.
Earnings are a big factor, too. The next report date, as per the earnings calendar , is set for January 28.
🎁 The Takeaway: A Rally Within Reach
Tesla’s 20% gain in 2025 looks solid heading into the final stretch, and seasonality is on its side.
• December tends to be kind.
• Santa rallies tend to lift boats.
• Analysts are optimistic about deliveries.
• The stock has historical resilience.
But this is still Tesla — a stock with a personality, a fanbase, a fierce opposition , and a volatility profile that can make your stomach churn.
Off to you : How do you see Tesla stock performing in December? Share your views in the comments!

Tesla Reversal Signal Triggered at the 200 SMA!TSLA 🚗 Bullish Pullback Playbook — Smart Layered Entry Setup!
📈 Asset:
TSLA — Tesla Inc. (NASDAQ)
Swing Trade Playbook | Trend-Continuation Setup
🧠 Market Thesis
TSLA shows a bullish pullback into the 200-Day Simple Moving Average, a level historically respected by trend-followers. The latest Heikin-Ashi Doji Reversal signals buyers regaining momentum ⚡ — suggesting the pullback is stabilizing and demand is stepping back in.
This combination of trend support + reversal confirmation forms the core of this structured swing setup.
🎯 Plan Overview
A clean bullish continuation strategy using a refined layered entry method (professionally framed as “scaled limit entries”). This maintains your signature thief-style energy, but aligned with TradingView rules and presentation standards. 😎
🟢 Entry Plan (Layered / Scaled Limit Orders)
Using a scaling approach allows better average pricing during volatility.
Proposed buy-limit layers:
Buy Limit 1 → $420.00
Buy Limit 2 → $410.00
Buy Limit 3 → $400.00
👉 Traders may increase or reduce the number of layers based on risk tolerance and personal strategy.
🔻 Stop-Loss (Risk Control)
A defensive stop-loss is placed near $380.00, below recent liquidity pockets and under the 200 SMA structure.
⚠️ This level is optional — traders should select their own SL based on personal risk management.
🎯 Take-Profit Zone
Target area sits around $470.00, where:
Major historical resistance awaits
Overbought conditions often develop
High-volume sellers tend to re-enter
This zone is treated as a profit-taking escape point, but traders can exit based on their own judgment.
📡 Related Markets to Watch (Correlation Insight)
Keeping the global view helps improve trade confidence:
NASDAQ:QQQ — High correlation with mega-cap tech, TSLA often follows Nasdaq momentum.
NASDAQ:NDX — Strong tech index correlation; strength supports TSLA continuation.
SP:SPX — Broad-market risk sentiment gauge.
NASDAQ:NVDA / NASDAQ:AMD — Momentum flow in growth-tech impacts liquidity rotation into TSLA.
AMEX:XLY — Consumer Discretionary ETF (TSLA is a major component).
Key takeaway:
Strong tech-sector momentum + risk-on environment = enhanced TSLA bullish continuation probability 📊⚡
🧰 Notes for the Community
Dear Traders (Thief OG-style Family 😄) —
SL/TP levels shared here are only examples for educational purposes. You’re always free to manage your own positions using your own risk preferences. Trade smart, trade safe, trade stylish. 💼✨
✨ “If you find value in my analysis, a 👍 and 🚀 boost is much appreciated — it helps me share more setups with the community!”
This is a thief-style trading strategy presentation strictly for fun and educational purposes. Not financial advice.
#TSLA #Tesla #SwingTrade #BullishSetup #LayeredEntries #HeikinAshi #200SMA #NASDAQ #MomentumTrading #TechnicalAnalysis #TradingView #RiskManagement #TraderLifestyle #StockMarket

TESLA IS ENTERING A CRITICAL ZONETesla currently remains in an uptrend while moving inside the existing ascending channel. The most recent reaction came from the trendline, but an important structure has formed above: a clear double top pattern . After the pattern completed, price declined and is now retesting the neckline, which has already acted as resistance. The 50 EMA is also positioned at this same level, adding confluence.
According to the mechanics of the double top, the expected downward projection is typically equal to the distance between the top of the pattern and the neckline. That measured move aligns almost perfectly with the lower support zone and the 200 EMA , forming a strong confluence area.
Additionally, there is an imbalance inside that lower region, which commonly pulls price back to fill it. RSI has formed a downtrend and is moving toward the 30 level, which supports the likelihood of a continued decline.
If price breaks above both the RSI downtrend and the neckline, the move back upward along the channel becomes possible. However, the bearish confirmations remain strong unless a significant positive catalyst invalidates the setup.

TSLA Losing Momentum – Uptrend Breakdown RiskLooking at the current picture, both news flow and technical signals show that Tesla is entering a challenging phase. A series of recent negative developments — from large funds selling off, to declining sales in China, and Elon Musk potentially taking a loss on his latest share purchases — have clearly shaken market confidence. As a result, TSLA has been under continuous selling pressure, and its price action has weakened significantly compared to the previous bullish period.
On the chart, the resistance area around $447 continues to act as a “steel ceiling”: every touch has been firmly rejected. The recent strong bearish candle pushed TSLA back into the Ichimoku cloud, breaking the short-term upward structure. More importantly, the price is now at risk of losing the uptrend line that has held since April, indicating that medium-term bullish momentum is fading.
If TSLA fails to reclaim the $430–$447 zone in the next recovery attempts, a drop toward $329 becomes a very realistic scenario — this level has been a major support in the past and aligns with the lower boundary of the primary trend channel.

TSLA Plunging? The Fake Rebound Before the Real Crash!Tesla (TSLA) is entering a challenging phase as a wave of negative news hits from both fundamental and technical sides. Sales in China — Tesla’s second-largest market — have dropped to their lowest level in three years , sparking fears that real demand for EVs is cooling. At the same time, Elon Musk’s massive $1 trillion compensation package has raised concerns among investors who believe Tesla’s current valuation far exceeds its actual profit potential.
On the daily chart, TSLA is showing clear signs of weakness after an extended uptrend. The price is now testing the medium-term ascending trendline around the $430 zone . If buying pressure fails to hold this level, there’s a strong chance the price will break the trendline and enter a deeper correction phase .
In the short term, Tesla could continue to drop toward the $400 area , where strong support and the Ichimoku cloud base converge. Any rebounds, especially near the $450 resistance zone, should be viewed as opportunities for sellers to re-enter rather than signs of recovery.

Tesla Stock Wobbles as Profit Dives 37%, Revenue Pops. Now What?Tesla NASDAQ:TSLA posted a 12% jump in revenue on Wednesday, reaching $28.1 billion, well above Wall Street’s $26.37 billion estimate. And yet, the stock slipped nearly 1% on the day before paring back that loss with a 2.3% Thursday gain.
Why? Because profits fell faster than Cybertruck’s reputation — a 37% plunge year over year, with adjusted earnings per share at 50 cents versus the expected 54 cents.
It’s a classic Tesla paradox: sales are booming, but margins are thinning, and Wall Street can’t decide whether to cheer the top line or cry over the bottom one.
🏎️ The Cost of Staying in the Fast Lane
Tesla’s secret sauce has always been scale — crank out more cars, dominate market share, and let profits follow. But this quarter, the recipe’s a bit off. Automotive revenue rose 6% to $21.2 billion, yet net income plunged to $1.37 billion from $2.17 billion a year earlier .
What happened? Price cuts. Lots of them. Musk has been slashing sticker prices across markets to stay ahead in the EV race — great for consumers, painful for margins. Add a 50% spike in operating expenses (thanks, humanoid robots and AI labs), and suddenly that sleek electric machine looks a lot less money-making.
Still, Tesla’s revenue growth means one thing: demand isn’t dead. The EV slowdown hasn’t reached Palo Alto yet.
💰 Bitcoin Bounces
In a crypto-centric subplot, the company made $62 million from its Bitcoin BITSTAMP:BTCUSD stash last quarter.
The crypto’s 5% rise — ending the quarter around $114,000 — gave Tesla’s treasury a nice digital cushion. The company held roughly 11,000 Bitcoins during the three months through September.
🧠 The $1 Trillion Question
And then there’s the other storyline — the Elon Musk Show. Musk wrapped up the earnings call by pivoting from profits to power. Specifically, his proposed $1 trillion pay package , which he insists isn’t “compensation” at all but a question of “control.”
“I just don’t feel comfortable building a robot army here and then being ousted because of some asinine recommendations from ISS and Glass Lewis,” Musk quipped, slamming the proxy firms as “corporate terrorists.”
His plan is to secure roughly mid-20s voting power to keep Tesla’s destiny firmly in his hands while still, as he puts it, being “fireable if I go insane.”
If approved, Musk’s stake could surge from 13% to nearly 29%, giving him the leverage he says he needs to push Tesla toward an $8.5 trillion valuation — complete with robotaxis, humanoid bots, and up to 12 million cars sold annually.
🧾 The Takeaway
The stock is up roughly 16% in 2025, clawing back some early-year losses, but it still lags the Nasdaq Composite NASDAQ:IXIC and other mega-cap peers like Nvidia NASDAQ:NVDA and Meta $META.
The near-term question is simple: can Tesla tighten costs without killing growth? The long-term one is bigger: can Elon Musk lead the company into its next chapter without turning every quarter into a cliffhanger?
That said, the earnings season continues and the next batch of big tech heavyweights is right around the corner.
Off to you : What’s your take on Tesla and Musk’s lofty vision north of $1 trillion? Share your thoughts in the comments!

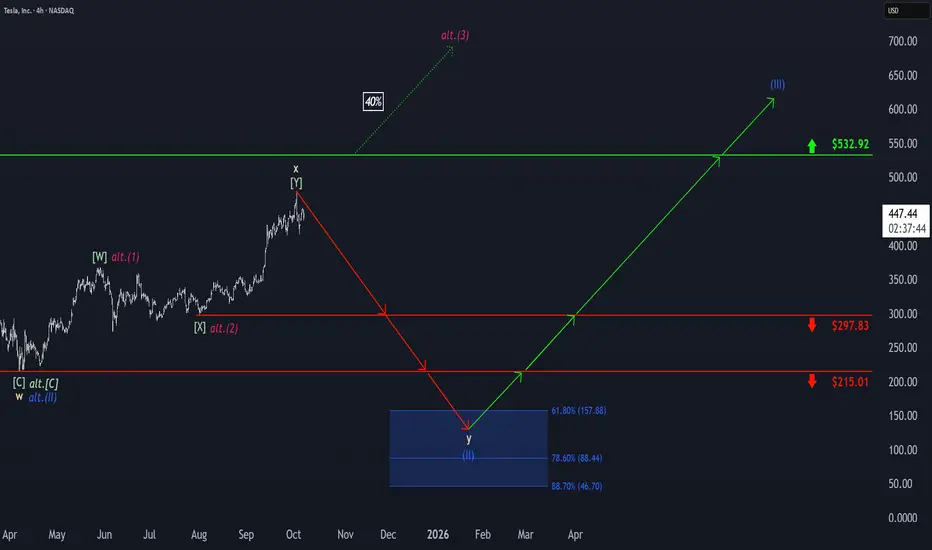
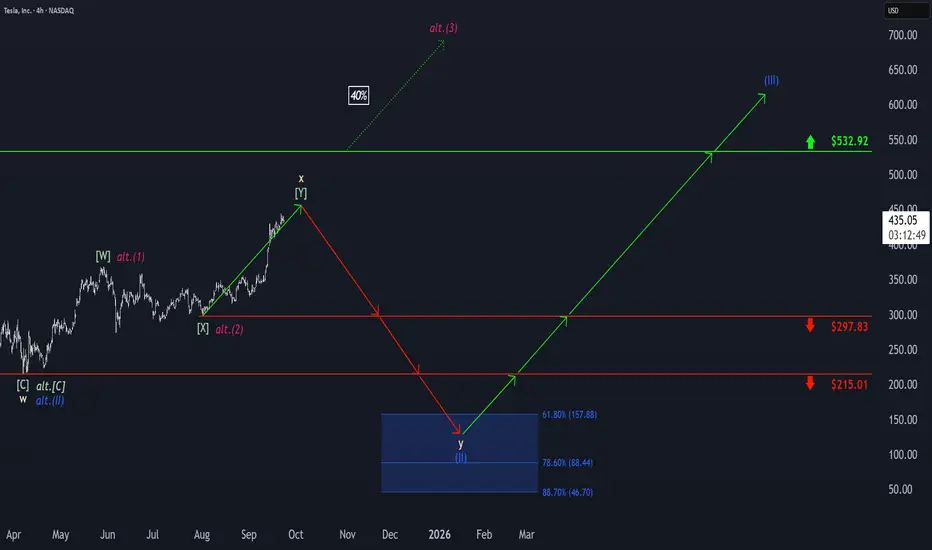
Tesla: Top Established!Tesla initially hit a new high before quickly reversing course with a notable move to the downside. As a result, we now view the corrective upward movement of beige wave x as complete and anticipate further sell-offs as part of wave y. The stock is expected to gradually break below the support levels at $297.83 and $215.01, ultimately reaching our blue Target Zone between $157.88 and $46.70, which we have identified for the final corrective low of blue wave (II). However, there remains a 40% chance that TSLA will not reach the blue zone at all but instead will break out directly above resistance at $532.92. In this case, we would consider blue wave alt.(II) already complete and locate the stock in a sustained (magenta) upward impulse. Even in our primary scenario, the new uptrend of the regular wave (III) is ultimately expected to surpass the $532.92 resistance.
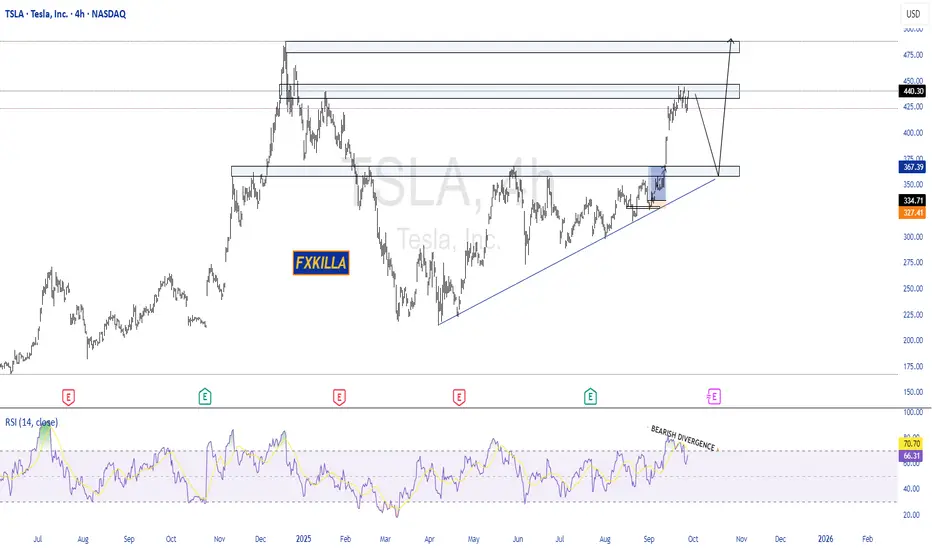
TESLA HIGH PROBABILITY SETUPS SOON!!!🚨 TESLA HIGH PROBABILITY SETUPS 🚨
* Here We Can See The Next Potential Moves For TSLA Coming Hours/Days.
* Keep Your Eyes Close On Your Trading Positions.
* Happy PIP Hunting Traders.
FXKILLA.
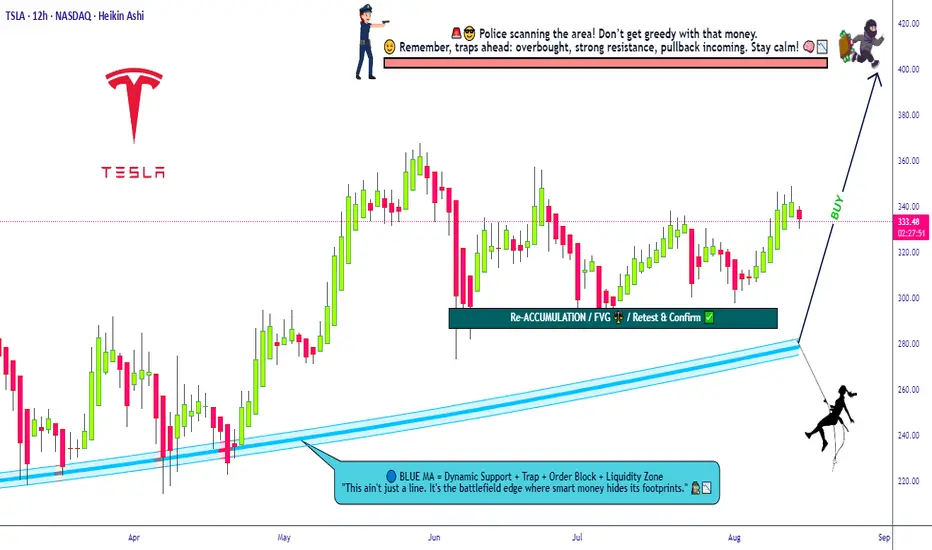
Bullish Tesla Mission Activated – Grab the Loot Now!💎🚨 TESLA STOCK MARKET HEIST PLAN 🚨💎
🕵️♂️ Attention All Thief OG’s, Chart Ninjas & Wall Street Pickpockets!
We’re gearing up for a full-blown Tesla loot mission — bullish, layered, and locked on target! 📈💰
🎯 Plan:
Bullish Layered Entry Strategy 🤑
We’re stacking multiple BUY LIMIT layers like a pro bank job:
💵 (330.00) | 💵 (320.00) | 💵 (310.00) | 💵 (300.00)
(You can add more layers if you want to steal bigger)
🛑 Stop Loss:
The Thief’s SL @ 280.00 💣
📌 Adjust to your own risk — every crew member knows their escape route!
Remember: A good thief never leaves fingerprints, only profits.
🏆 Target:
🚓 Police barricade at 420.00 — better vanish before the sirens!
🎯 Secure the main loot at 400.00 before making a clean getaway.
💡 Thief Strategy Tip:
Layering lets you grab more loot if price dips — like breaking into multiple vaults.
Keep your disguise on and watch the charts — Wall Street guards are always watching. 👀🖤
⚠️ Warning for the Crew:
Major news drops = cops on every corner.
Stay hidden, trail your stops, and protect the stash.
💥 Smash the ❤️ LIKE button if you’re in for this Tesla mission!
📌 Follow the crew for more Thief Trader blueprints — next heist drops soon!
Tesla: Upward Momentum PersistsTesla’s upward momentum has persisted, with the beige wave x still having some room to run. However, we expect the corrective top to form well below resistance at $532.92, which should then trigger the final selling phase within the broader correction. Ultimately, wave y is projected to approach our blue Target Zone between $157.88 and $46.70, completing the large blue wave (II) in that range. Afterward, we anticipate a new wave (III) uptrend. That said, there remains a 40% probability that price may not reach the blue zone, as wave alt.(II) could have already completed at $215.01. In this scenario, TSLA would already be developing a magenta upward impulse and could break above the $532.92 level directly and sustainably.
Tesla on Track – Golden Zone Respect Leading to $867 TargetAs we discussed in the earlier setup, Tesla retraced beautifully into the golden zone (62–79% retracement area) after sweeping sell-side liquidity. This zone aligned with a higher-timeframe order block, providing strong confluence for a bullish reaction.
The price has since respected that golden zone, confirming buyers stepped in aggressively and validating the bullish bias. From here, the market structure points toward continuation to the upside, with immediate targets at prior buy-side liquidity pools, eventually extending toward the $867 region, a level that aligns with the 100% Fibonacci projection and liquidity resting above previous highs.
This setup illustrates a textbook ICT/SMC play:
Liquidity Sweep ✅
Golden Zone Respect ✅
Strong Bullish Reaction ✅
Clear Buy-side Targets Ahead ✅
If momentum holds, Tesla remains positioned for a multi-month expansion leg toward the $867 target zone.
⚠️ DYOR: Not financial advice. Always confirm setups with your own framework and risk management.

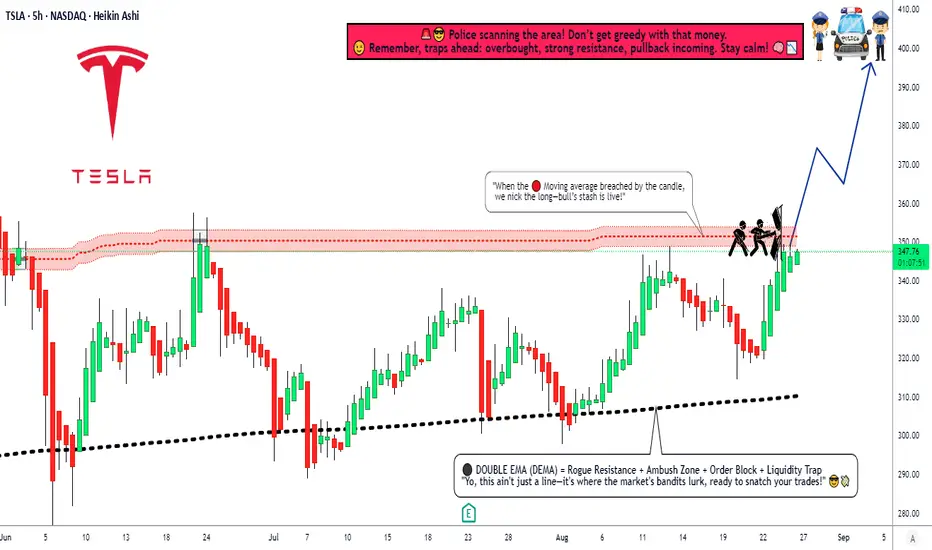
TSLA Breakout Play: Time to Steal Some Profits?🚨 TESLA INC (TSLA) HEIST PLAN - BULLISH SWING/Day LAYUP! 🚨
Yo, Thief OG's! 🐱👤🤑 Time to swarm the TSLA vault. The blueprint is set for a major bullish score. Our intel says the cops (bears) are losing their grip. Let's get this money! 💰💸✨
🎯 THE MASTER PLAN: BULLISH BREAKOUT (PENDING ORDERS)
Based on the Thief Trading Style™ technical analysis, we're plotting a bullish heist on TSLA. We wait for the breakout confirmation, then we strike with precision using our layered entry strategy.
Asset: TESLA INC (TSLA)
Trade Type: Swing / Day Trade
Bias: BULLISH ⬆️⚡
📍 ENTRY: THE HEIST INITIATES (SET YOUR ALARMS! ⏰)
Primary Entry: Breakout and close above $355.00 ⚡
THIEF'S LAYERED ENTRY STRATEGY: 🎯
Don't go all in at one price! We use multiple limit orders to layer into the position after the breakout confirms the move. This is how the pros (and thieves) do it!
Layer 1: Breakout Entry @ $355.00
Layer 2: Pullback Entry @ $350.00
Layer 3: Pullback Entry @ $345.00
Layer 4: Pullback Entry @ $340.00
Layer 5: Pullback Entry @ $335.00
(You can add more layers based on your own capital and risk appetite, you savage!)
📌 IMPORTANT: SET A TRADINGVIEW ALARM at $355.00! This is your signal that the heist is a GO! Don't get caught sleeping. 🛌💤
🛑 STOP LOSS: THE ESCAPE ROUTE
Thief SL for Breakout Entry: $320.00
⚠️ HEAR ME, HEAR ME! Dear Ladies & Gentleman (Thief OG's), adjust your SL based on your own strategy & risk! I am not your financial advisor; I'm just the guy with the blueprint. 🗺️ Place your SL ONLY AFTER the breakout happens. Protect your capital at all costs!
🎯 TARGET: CASH OUT & VANISH
Primary Target: $400.00 🚀
The police barricade is thick up there! 🚓🚧 Once the money is in the bag, don't get greedy! Escape with the stolen profits before they catch you!
Note: Dear Thief OG's, I am not recommending you use only my TP. Take profits at your own risk and based on your own analysis. Secure the bag when YOU feel comfortable! 💼🔥
💎 THIEF'S FINAL WORDS:
This is not a gamble; it's a calculated heist. Follow the plan, manage your risk, and let's eat! 🍽️
Hit the LIKE button if you're riding with us! ✅
BOOST this idea to empower the thief community! 💪❤️
Follow for more daily heist plans! 🎯
Stay sharp, stay profitable, and remember... in the market, be a thief, not a victim! 🐱💻🚀
NASDAQ:TSLA #TradingView #StockMarket #TradingPlan #SwingTrading #DayTrading #Investing #Bullish #TESLA #ThiefTradingStyle
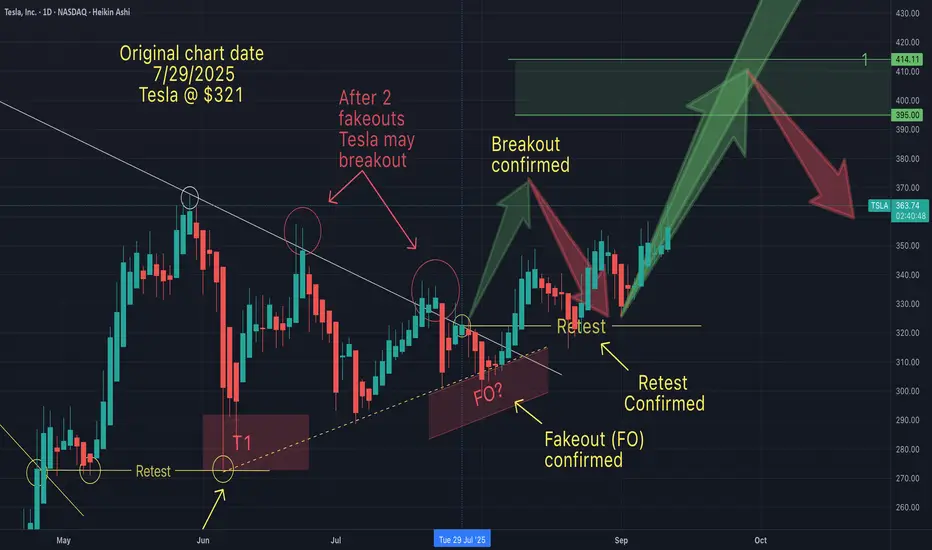
Is Tesla on it's way to $400+On July 29th I suggested that Tesla was about to break out to the upside (after fakeouts).
Then on Sep 4th I suggested that after a restest (of the breakout line), Tesla would begin its climb. This portion of the anticipated pattern now been confirmed.
One question now remains...will Tesla hit my T1 ($395 - $414).
What do you think? I'd like to know what the sentiment is out there. I'd like to hear your thoughts.
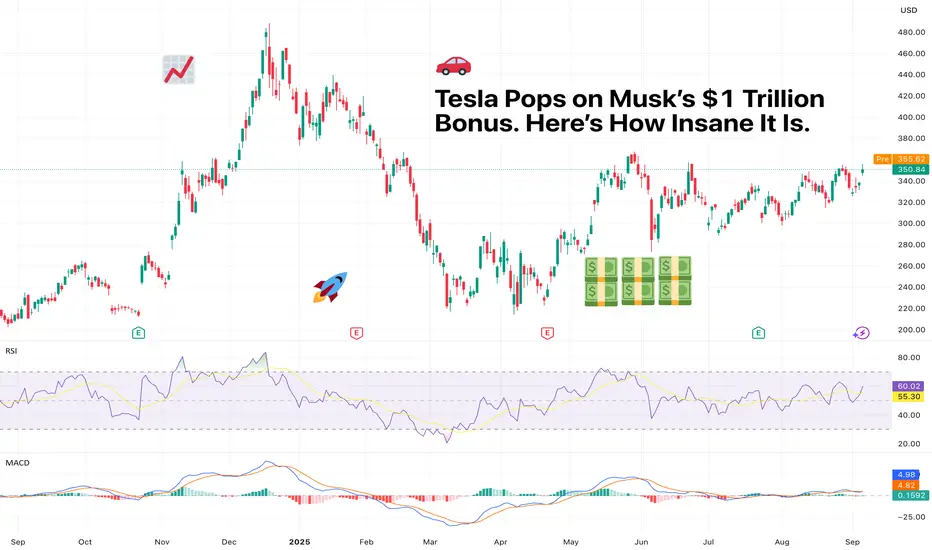
Tesla Pops on Musk’s $1 Trillion Bonus. Here’s How Insane It Is.The mother of all KPIs.
Elon Musk has a new carrot dangling in front of him, and it’s not a Mars colony or a flamethrower.
Tesla’s board is asking investors to approve a bonus so massive, so absurd, so galaxy-brained, that it makes past compensation packages look like pocket change.
Ready? We’re talking about the potential for a $1 trillion payday if Musk manages to drag Tesla to an $8.5 trillion valuation. In ten years.
That’s nearly eight times where it is today. So let’s unpack just how unhinged this deal really is, why Tesla stock popped on the news, and what it would take for Musk to collect.
🚀 The Trillion-Dollar Tease
Tesla stock NASDAQ:TSLA climbed 3.6% Friday on the back of this announcement, not because anything happened then and there, but because something could happen ten years out.
The board dropped the proposal in a securities filing, outlining that Musk could receive up to 423 million shares – worth over $1 trillion – if Tesla smashes through a series of market cap and operational milestones.
In other words, the board is looking to lock Musk in and make sure he doesn’t get distracted by rocket launches, robot brains, or tweeting memes about NPCs at 2 a.m.
💰 What’s the Catch?
The catch is that this isn’t free money. To claim the full $1 trillion, Musk has to lead Tesla into uncharted corporate territory: Boost Tesla’s market cap from $1 trillion to $8.5 trillion by 2035. That’s more than double Nvidia’s NASDAQ:NVDA current valuation ($4.2 trillion) and equal to the GDP of Japan, Germany, and the UK, combined.
Deliver 12 million more EVs (as of this summer, Tesla has managed about 8 million in its entire history).
Land 10 million autonomous driving subscriptions.
Register and operate 1 million robotaxis (Not on the market right now).
Sell 1 million AI robots (Not on the market right now).
Increase adjusted earnings from $13 billion to $400 billion. That’s a 24x jump in profit.
Next stop? Tesla’s earnings report ( Earnings Calendar for reference) in about a month from now.
🪄 The Board’s Spin
Tesla Chair Robyn Denholm called the package “fundamental to Tesla becoming the most valuable company in history.” Translation: Elon, please.
In a letter to shareholders, the board said the award “aligns extraordinary long-term shareholder value with incentives that will drive peak performance from our visionary leader.”
Which is corporate-speak for: We know he’s mercurial, but this should keep him tethered for at least a decade.
⚡ The Stakes for Tesla
Tesla’s stock reaction says investors are cautiously optimistic – emphasis on cautiously. Shares have been down nearly 30% since mid-December, plagued by slowing EV sales , rising competition, and Musk’s very public political feuds (including an ongoing rift with President Trump that’s cost Tesla federal EV incentives).
To make matters trickier, Tesla’s brand halo isn’t as shiny as it used to be. EV rivals like BYD, Rivian, Hyundai, and Mercedes are cutting into Tesla’s dominance, while price cuts have compressed margins.
Analysts expect Tesla to deliver 1.6 million vehicles this year, down from last year’s totals. On top of that, revenue continues to slide, lower by 12% in the last quarter , indicating a shrinking business.
So why the big gamble? Because if this plan works, Tesla wouldn’t just catch up – it would become the undisputed king of EVs, autonomous driving, AI robotics, and energy storage. In other words, a full-blown tech empire.
💰 Musk’s 25% Solution
Part of Musk’s motivation here isn’t just about the money – though a trillion-dollar payday to one person is actually insane. Musk has repeatedly said he wants at least 25% voting control over Tesla to feel “comfortable” keeping his focus there.
Under the proposed plan, if Musk hits every target, his stake in Tesla would rise to 25% from his current holdings of 12%, giving him outsized influence over its future direction. That means if Tesla’s valuation is at $8.5 trillion, he’d be holding shares worth $2.12 trillion. But if he misses? He gets nothing. Zero.
It’s a high-wire act for both Musk and shareholders: reward him with historic wealth if he delivers, but don’t overpay if he falls short.
🤖 Robotaxis, Humanoids, and AI Dreams
A key piece of this plan hinges on Musk’s boldest vision yet: turning Tesla into an autonomous AI platform. Forget just cars – think fleets of robotaxis generating recurring subscription revenue and Optimus humanoid robots replacing repetitive labor in warehouses, factories, and maybe even households.
If this strategy pays off, Tesla won’t just be an automaker – it’ll be an AI-powered infrastructure company. But right now, that future is priced into a present that still depends on selling Model Ys and Cybertrucks.
🔍 The Market’s Split Personality
Wall Street’s reaction has been mixed, and here’s why:
The bulls argue that Tesla has the innovation engine, the brand, and, yes, the Musk factor to make the impossible happen. They point to SpaceX’s reusable rockets and Nvidia’s AI dominance as proof that moonshots sometimes land.
The bears see the trillion-dollar pay package as monopoly money that’ll never be real. Between slowing EV demand, Tesla’s underwhelming Q2 deliveries, and Musk’s penchant for side quests, they’re skeptical Tesla can hit even half of these KPIs.
🏁 The Bottom Line
Tesla’s proposed Musk mega-package is nothing short of audacious. It’s an all-in bet on:
Explosive growth in EVs and autonomous driving
Turning Tesla into an AI + robotics powerhouse
Keeping Musk’s focus locked on Tesla instead of Mars, memes, or political campaigns
Is the plan bold? Absolutely. Is it risky? Without a doubt.
Off to you : Do you believe Musk deserves the “One-Trillion-Dollar Man” (or $2T) title? Or is all that a desperate move to keep him around? Share your thoughts in the comments!
TESLA HIGH PROBABILITY SETUP SOON!!!🚨 TESLA HIGH PROBABILITY BUY SETUP 🚨
* Here We Can See Clearly The Next Potential Move For Tesla Coming Hours/Days.
* Keep Your Eyes Close On Your Trading Positions.
* Happy PIP Hunting Traders.
£ FXKILLA £
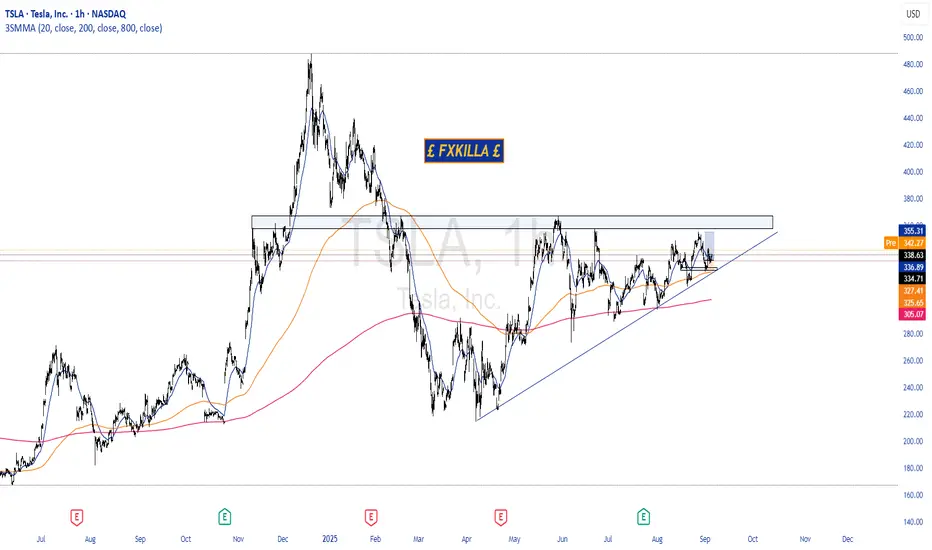
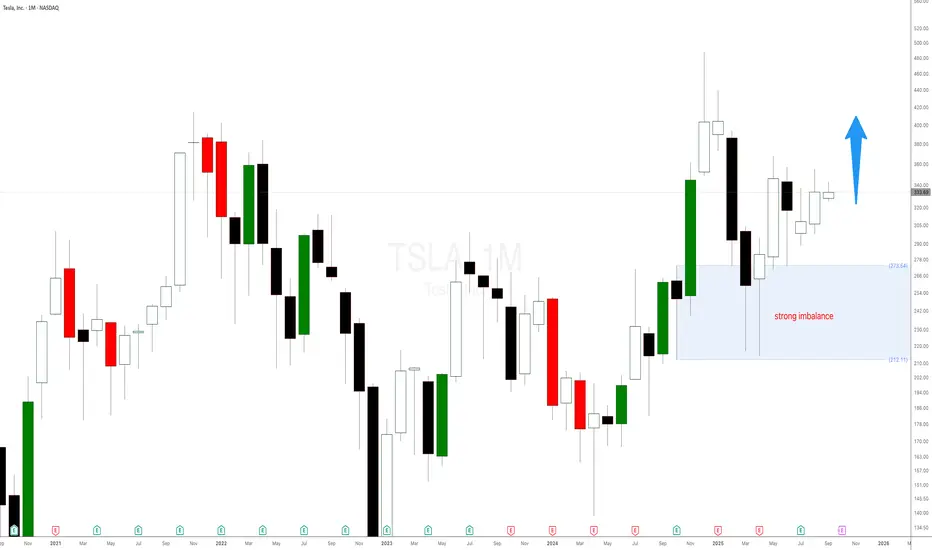
Tesla stock is printing new highs helped by the strong imbalanceTesla stock is printing new highs helped by the strong weekly imbalance as expected and mentioned in a previous Tesla stock analysis. The weekly demand level at $298 is playing out well. There is still a lot of room for NASDAQ:TSLA stock to keep on rallying. You can use the smaller timeframes to add more long positions or new imbalance to trade with even higher probability.