How Traders Build Confidence One Trade at a TimeAnd how you can too.
🧭 Confidence Starts Smaller Than You Think
Confidence in trading rarely arrives as a dramatic breakthrough moment. It usually begins quietly, somewhere between a well-timed entry and a disciplined exit that followed the plan exactly as intended.
Many traders expect confidence to appear after a winning streak. In practice, it grows from consistency rather than excitement. One correctly executed trade builds trust. Two reinforce it. Ten start to feel like structure instead of luck.
Confidence forms when your process begins to feel familiar.
📊 The First Ingredient Is a Repeatable Plan
A repeatable plan means knowing what conditions justify entering a trade and what conditions suggest waiting. Traders sometimes call this a ‘setup,’ which simply describes a recognizable pattern or environment that increases probability.
When traders follow setups consistently, outcomes become easier to interpret. A losing trade feels manageable because it still followed the rules. A winning trade becomes meaningful because it confirms the approach.
Confidence grows faster when decisions feel intentional rather than improvised. (And yes, that includes no revenge trading .)
🧠 Small Wins Train the Mind
Early confidence rarely comes from large profits or the hot trade of the day . It develops through smaller moments that prove discipline works. Waiting patiently for a setup. Respecting position size. Closing a trade according to plan instead of emotion.
These actions build psychological stability. Stability is a big one because markets constantly test patience, timing, and expectations. Sometimes, more than most people can handle.
Over time, repetition turns uncertainty into familiarity, and familiarity makes decisions calmer.
⏳ Reviewing Trades Builds Real Clarity
Professional traders treat review as part of the strategy rather than an afterthought. Looking back at past trades helps identify patterns that charts alone cannot reveal.
A trading journal, which could simply be a record of entries, exits, and reasoning, often becomes one of the most powerful confidence tools available. It transforms memory into evidence. Evidence strengthens conviction.
Confidence feels stronger when supported by observation rather than guesswork.
📉 Losses Still Play a Role
Losses contribute to confidence when they occur inside a structured plan. A controlled loss confirms that risk management is working as intended. Risk management refers to limiting how much capital is exposed on any single idea so that no individual trade can cause lasting damage.
Traders who manage risk effectively begin trusting their ability to stay consistent across changing market conditions (think a wild earnings season or surprise economic data ).
🚀 Confidence Changes How Trades Feel
As confidence grows, hesitation begins to fade. Entries feel clearer. Position sizes feel more appropriate. Decisions arrive with less urgency and more perspective.
Confidence isn’t predicting the market correctly every time — no one can do that, not even your favorite hedge fund bro. It means understanding your approach well enough to execute it without second-guessing each move.
🎁 OK, But How?
Confidence develops through repetition, structure, and reflection rather than dramatic breakthroughs. Each disciplined trade adds another layer of trust between the trader and the process.
Over time, those layers become something powerful: the quiet certainty that you can navigate uncertainty one decision at a time.
Off to you : How do you know you’ve developed enough confidence to be a successful trader? Share your approach in the comments!
Beyond Technical Analysis
EURUSD Bearish Reversal at Resistance – Shorts FavouredEUR/USD is currently experiencing a bearish trend, confirmed by both technical indicators and fundamental factors chart shows price within a descending channel, forming lower highs and lower lows, indicating sellers are in control.
EURUSD the trend remains bearish, with the EMA50 providing dynamic resistance. The Elliott Wave pattern and price action point to a further drop below 1.1700, confirming the downward momentum. If 1.1700 breaks, the pair could quickly head toward 1.1625, which is a crucial support level. on the fundamental side, the US Dollar remains strong due to ongoing inflationary concerns and hawkish Fed expectations, delaying rate cuts into late 2026. This is keeping US yields elevated, further pushing the dollar up and applying pressure on EUR/USD. Additionally, geopolitical tensions in the Middle East are fueling a risk-off sentiment, where the dollar benefits as a safe haven. On the euro side, Germany's growth forecast has been downgraded, and overall Eurozone growth is slowing, adding further bearish pressure to the EUR.
Moreover, the European Central Bank (ECB) remains uncertain about future rate hikes, which is making investors cautious about the euro, despite rising inflation from energy costs linked to the ongoing conflict in the Middle East. The ECB's indecision about further tightening contrasts with the Fed’s clear stance, creating further divergence between the euro and dollar.
Tecnically the combination of strong US fundamentals, weak Eurozone outlook, and bearish technical signals all suggest that EUR/USD will likely continue to trend lower, targeting 1.1660 and 1.1625. A break below these levels could lead to further downside, with key levels around 1.1600 to watch closely.
You may find more details in the chart,
Trade wisely best of luck buddies.
Ps; Support with like and comments for better analysis Thanks for Supporting.

GOLD Price Update – Clean & Clear ExplanationGold market is currently in a broader bearish structure, with price respecting a descending trendline and forming consistent lower highs. This confirms that sellers have been in control over the past sessions. However, in the short term, price is showing signs of a potential bullish retracement from a key demand zone.
Recently, price tapped into a strong support area around 4,690 – 4,700, where buyers stepped in and pushed the market upward. This reaction suggests liquidity was taken from the downside, and now the market is attempting to rebalance.
At the moment, price is trading near an internal structure zone, where we can expect some consolidation or minor pullback before the next move. The highlighted setup shows a possible buy opportunity, but only after a clean reaction or confirmation from this zone.
If buyers maintain control, the next target is the major resistance zone around 4,780 – 4,785, which aligns with the higher timeframe supply and descending trendline. A break above this resistance would signal a potential shift in structure and continuation toward higher levels.
On the downside, if price fails to hold the current zone and breaks below 4,690, it would invalidate the bullish idea and likely lead to a continuation of the bearish trend, targeting lower liquidity levels.
Ps; Support with like and comments for better analysis Thanks for Supporting.

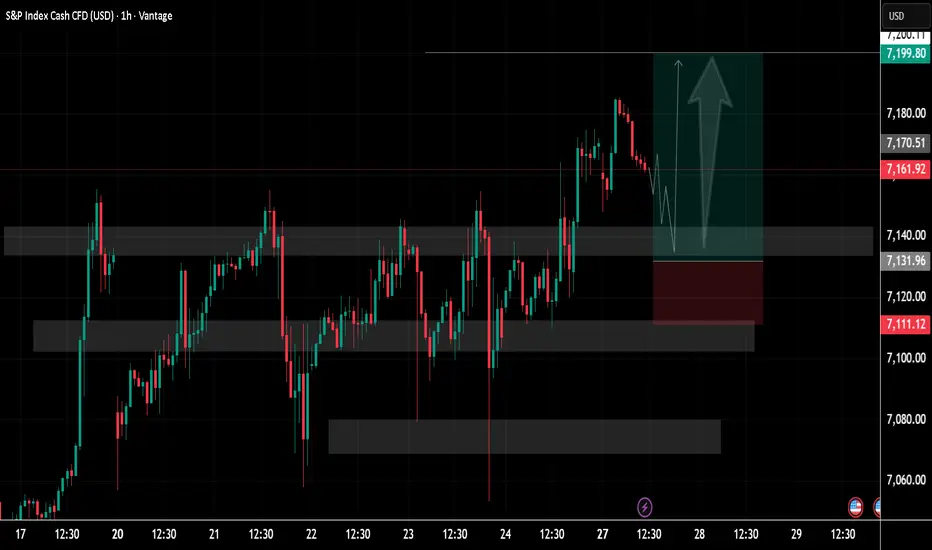
SP500 Price Update – Clean & Clear ExplanationS&P 500 in a structured bullish setup forming after a period of consolidation.
Price action has been ranging between multiple clearly marked zones, with repeated reactions from both demand and supply areas. Earlier sessions show choppy movement, but the market gradually builds higher lows and higher highs, signalling a shift toward bullish control.
A strong impulsive move upward breaks above the mid-range resistance, followed by a modest pullback. The highlighted grey zones represent key support and resistance levels, with the current price hovering just above a previously tested resistance—now acting as potential.
The projected path shows a temporary dip (liquidity grab or retest) before a continuation upward, aligning with a classic break-and-retest bullish structure.
Ps; Support with like and comments for better analysis Thanks for Supporting.
XAUUSDHello Traders! 👋
What are your thoughts on Gold?
The Gold (XAUUSD)chart is currently flashing significant signs of a trend reversal. After a prolonged period of consolidation within a corrective structure, the price has failed to clear a major resistance zone and is now confirming a bearish breakout.
A decisive break has occurred below the lower boundary of the Rising Wedge pattern.
The red box remains a heavy supply zone. Multiple rejections at this level have formed a Lower High structure, indicating that sellers are now firmly in control of the market.
The path of least resistance is now to the downside. As long as the price remains below the broken ascending trendline and the supply zone, the bearish outlook remains intact.
A strong breakout and acceptance above the supply zone would weaken the bearish outlook.
What is the next move for Gold? Share your thoughts and analysis in the comments! 👇
Please like and support if this analysis helps your trading! ❤️
ETH/USDT: Symmetrical Triangle Breakout in Progress!Hi!!!
Ethereum has finally squeezed out of its consolidation phase on the 15M chart. After days of tightening price action, the Symmetrical Triangle has resolved to the upside, signaling a return of bullish momentum.
The Technical Setup:
The Breakout: Price has decisively cleared the upper resistance of the triangle. This move marks the end of the "indecision" phase and the start of a fresh expansion.
Market Structure: We are seeing a clean push away from the apex. The immediate price action suggests buyers are aggressively stepping in to front-run the next leg up.
Resistance Flip: The previous supply zone around $2,335 is now acting as an immediate floor for this move.
Targets in Sight:
🎯 Target 1: $2,351 (The primary measured move of the triangle).
🎯 Target 2: $2,360

GBPUSDHello Traders! 👋
What are your thoughts on GBPUSD?
The GBPUSD chart is currently at a critical decision zone, with price reacting to a strong cluster of resistance factors.
Price continues to move within a descending channel, indicating that the overall trend remains bearish unless a valid breakout occurs.
The highlighted resistance area is acting as a strong supply zone, where sellers have repeatedly stepped in and pushed price lower.
The 0.618 Fibonacci level is perfectly aligned within this zone, adding further strength to the resistance.
As long as price remains below this resistance area, the dominant bias stays bearish, and it is expected that after some consolidation in this zone, price will move toward lower targets.
Feel free to like and share your thoughts in the comments! ❤️
GBPUSD Downtrend Continuation: Sellers in ControlGBP/USD is showing a bearish reaction mainly due to a confluence of technical resistance and underlying fundamental pressure.
GBPUSD the market likely performed a buy-side liquidity sweep above recent highs, triggering stop orders before reversing downward. This is a common smart money pattern that leads to bearish continuation On the fundamental side, the move is supported by relative strength in the US Dollar and/or weakness in the British Pound. This can be driven by factors such as:
On the technical side, price rallied into a strong resistance / supply zone around 1.3550–1.3580, which has previously acted as a rejection area. The market attempted to break higher but failed, forming rejection wicks and weak follow-through, indicating that buyers are losing strength. Additionally, price respected a descending trendline, confirming that the upside momentum is limited. This type of behaviour often signals a distribution phase, where institutional traders sell into buying pressure.
You may find more details in the chart,
Trade wisely best of luck buddies.
Ps; Support with like and comments for better analysis Thanks for Supporting.

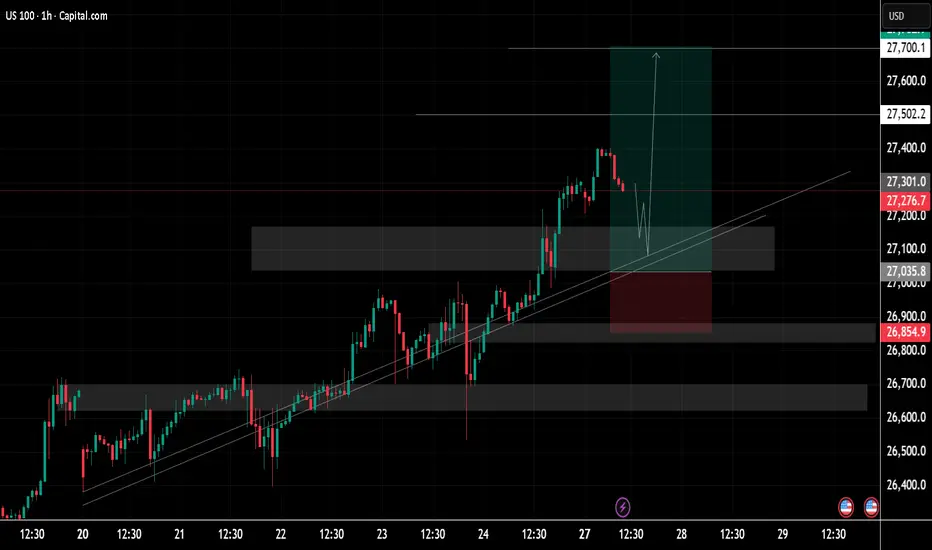
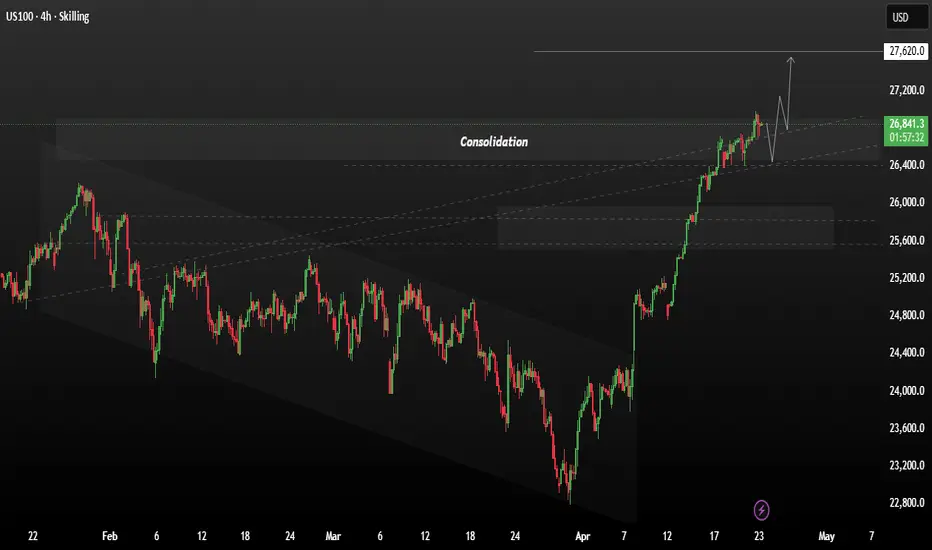
US100 Price Update – Clean & Clear ExplanationUS 100 a strong upward trend, where the price has been consistently respecting an ascending trendline. This suggests the market is bullish and likely to continue moving higher if the support levels remain intact.
In terms of risk management, the stop-loss is set at 26,854, a critical support level. This level is essential for determining the trend's strength; if the price dips below this, the market might experience a significant reversal. The gray areas on the chart indicate possible resistance levels, and the current price action suggests that if the index can break through these levels, it will likely continue its upward momentum, aiming for the next resistance level at 27,700.
For traders, the best strategy right now would be to consider entering a long position as the price approaches the ascending trendline support. This entry should aim for a target at the upper resistance zone around 27,700, with a stop-loss positioned just below the recent low near 26,854 to manage risk. This approach takes advantage of the current bullish momentum while safeguarding against potential downside movement.
Ps; Support with like and comments for better analysis Thanks for Supporting.
XAUUSD holds above 4,670 as gold targets 4,740 and 4,770 XAUUSD holds above 4,670 as gold targets 4,740 and 4,770 this week
Gold starts the week with a firmer technical tone after regaining balance above the 4,670 support area on the 3H chart. The early break in lower-timeframe structure has already been tested, and for now, price is showing that buyers are still willing to defend the near-term floor rather than surrender it.
That makes this week less about chasing momentum and more about whether gold can keep building above support without losing structure again.
At this stage, the chart matters more than the noise.
And the chart is showing a market that is trying to transition from short-term stabilisation into a more constructive recovery leg.
Technical Structure
From a technical perspective, gold has already reacted positively after testing the 4,670 support zone, which is now the key level holding the current bullish intraday structure together.
That area matters because it acts as the immediate base for the latest rebound attempt. As long as price remains above it, the market still has room to rotate higher and challenge the next resistance layers. Once a support level is tested and respected after a structure break, the focus usually shifts to whether price can extend cleanly into the next supply zone. In this case, the first level that matters is 4,740, followed by 4,770 if momentum continues to build.
The broader 3H chart also shows that gold is still trading under a descending resistance line from the previous swing structure. That means the market is improving in the short term, but it is not yet in full breakout territory. Buyers are gaining traction, but they still need to prove they can push through resistance instead of simply bouncing inside a wider corrective range.
Above that, the chart highlights a larger buy-side liquidity zone around the 5,000 region. That is not the immediate target for the start of the week, but it remains the broader upside reference if gold can continue holding its current base and build through the intermediate resistance layers first.
So the structure is currently clear:
4,670 is the key short-term support
4,740 is the first resistance test
4,770 is the next upside layer if momentum expands
holding above support keeps the bullish intraday structure alive
losing 4,670 weakens the current recovery view and forces a reassessment of direction
This keeps gold constructive for the start of the week, but still dependent on confirmation.
Key Technical Levels
Support: 4,670
This is the most important short-term floor on the chart. As long as price holds above it, the rebound structure remains valid.
First Resistance: 4,740
This is the first upside checkpoint. A clean push into this area would confirm that buyers are extending control from the current base.
Second Resistance: 4,770
If gold clears the first resistance zone, this becomes the next level where price may pause, consolidate, or face fresh reaction.
Broader Liquidity Zone: 5,000 area
This is the higher-timeframe upside reference shown on the chart. It remains relevant only if the current bullish structure continues to develop through the week.
Market Scenarios
Scenario 1 – Hold above 4,670 and push into 4,740
This is the preferred opening scenario for the week.
If buyers continue defending 4,670, gold may extend higher into the first resistance area near 4,740. That would confirm that the recent support retest has held and that the market is still building upward from the current base.
Scenario 2 – Consolidate around 4,740 before extending to 4,770
This is the constructive continuation scenario.
Gold may reach 4,740, pause, and then build sideways before attempting the next move higher into 4,770. That would fit a healthy market structure where momentum expands in stages rather than in one straight move.
Scenario 3 – Fail back below 4,670
This is the invalidation scenario.
If price loses 4,670 with clear downside acceptance, the current recovery structure weakens materially. That would suggest the recent upside is no longer holding and that the market may need to reset into a new short-term directional phase.
Market Insight
From my perspective, 4,670 is the line that defines the week.
As long as gold holds above that support, the structure still favours a push toward 4,740 first, and potentially 4,770 if buyers maintain momentum. But this is still a market trading inside a broader technical framework, not a fully confirmed breakout. That is why support matters more than excitement here.
For now, gold is holding structure well enough to keep the upside path active, but the recovery remains valid only while 4,670 continues to hold.

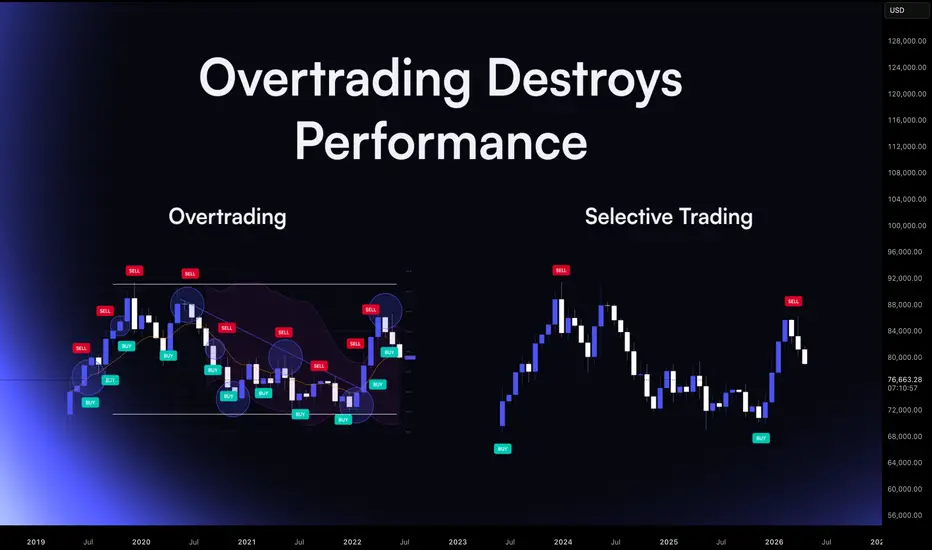
How Overtrading Slowly Destroys PerformanceOne of the most common reasons traders struggle to achieve consistency is not the strategy they use, but how often they trade. Many traders believe that more activity leads to more opportunity. In reality, excessive participation often leads to the opposite result.
Overtrading occurs when traders take positions that do not fully meet their criteria. The trades may look acceptable in isolation, but they lack the structural alignment that defines a high-quality setup.
This behavior usually develops gradually.
At first, the trader takes only clear opportunities. Over time, the desire to remain active increases. Charts are watched continuously, and small movements begin to appear significant. Trades that once would have been ignored start to feel justifiable.
The result is a higher frequency of trades with lower quality.
Each additional trade introduces risk. When these trades are taken without strong structural reasons, the probability of success decreases. Losses begin to accumulate not because the strategy stopped working, but because the trader stopped applying it selectively.
Another problem with overtrading is emotional fatigue.
Every trade requires attention, decision-making, and risk management. As the number of trades increases, mental energy becomes depleted. Decision quality gradually declines. Traders may begin to enter earlier than planned, move stops impulsively, or exit trades prematurely.
This degradation of execution often goes unnoticed at first.
Performance data may show several small losses rather than one large mistake. However, the cumulative effect becomes significant. Over time, a large number of marginal trades erodes profits that stronger setups could have produced.
Transaction costs can also amplify the problem.
Frequent trading increases fees and slippage, especially in fast markets. These costs may appear small on a single trade but become meaningful when multiplied across dozens of unnecessary positions.
Professional traders approach participation differently.
Instead of measuring productivity by the number of trades taken, they measure it by the quality of opportunities selected. Many experienced traders spend long periods observing the market without entering a position. Their goal is to wait for conditions where structure, liquidity, and participation align.
This selective approach reduces exposure to random price movement.
Fewer trades often produce clearer results. Each position is based on a defined thesis, risk is easier to manage, and emotional pressure remains lower because the trader is not constantly reacting to every movement.
The objective in trading is not to be active.
It is to be effective.
A strategy can only demonstrate its edge when trades are taken under the conditions it was designed for. Overtrading weakens that edge by introducing unnecessary exposure to environments where probability is unclear.
Consistency in trading rarely comes from doing more.
It comes from learning when not to act.
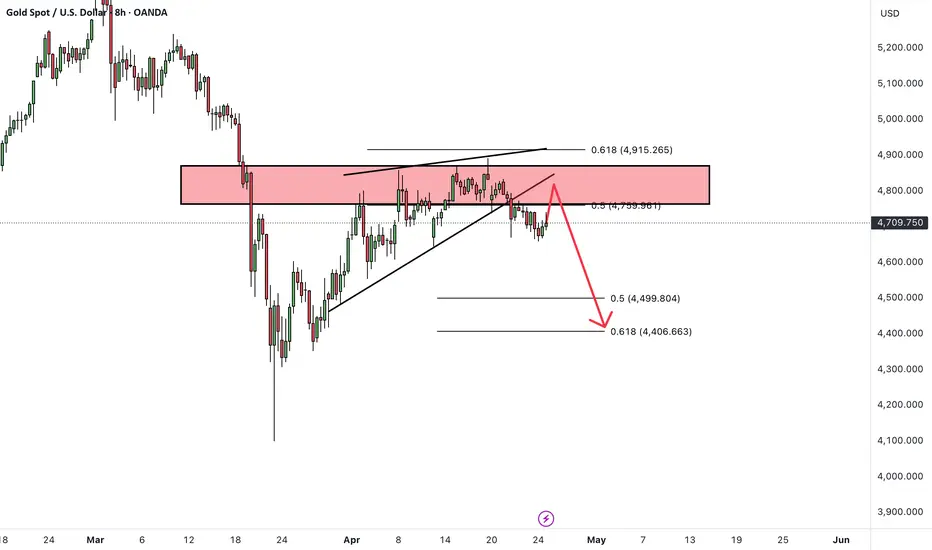
GOLD Sideways Market: Bulls vs Bears at Key LevelsGold is currently trading inside a descending channel, showing a short-term bearish structure. However, price has recently bounced from the lower boundary, creating a range-bound (sideways) environment between key support and resistance levels.
Right now, gold is not trending cleanly in one direction — instead, it is moving both up and down because the market is in a compression phase. This happens when institutions are collecting liquidity on both sides, taking out buyers above resistance and sellers below support. As a result, we see false breakouts and choppy movement, rather than a strong trend.
Another major reason behind this two-sided movement is fundamental uncertainty. Gold is highly sensitive to USD strength, interest rate expectations, and upcoming economic news. When the market is waiting for important data, price tends to stay indecisive, creating a range until a clear direction is confirmed this current structure suggests the market is preparing for a strong expansion move, but direction will only be confirmed after a breakout.
If price breaks and holds above the 4,780–4,800 resistance zone, we can expect a bullish move as buyers take control and push price higher. On the other hand, if price breaks below the 4,660 support level, it will likely continue bearish toward 4,600, following the overall channel direction.
You may find more details in the chart,
Trade wisely best of luck buddies.
Ps; Support with like and comments for better analysis Thanks for Supporting.

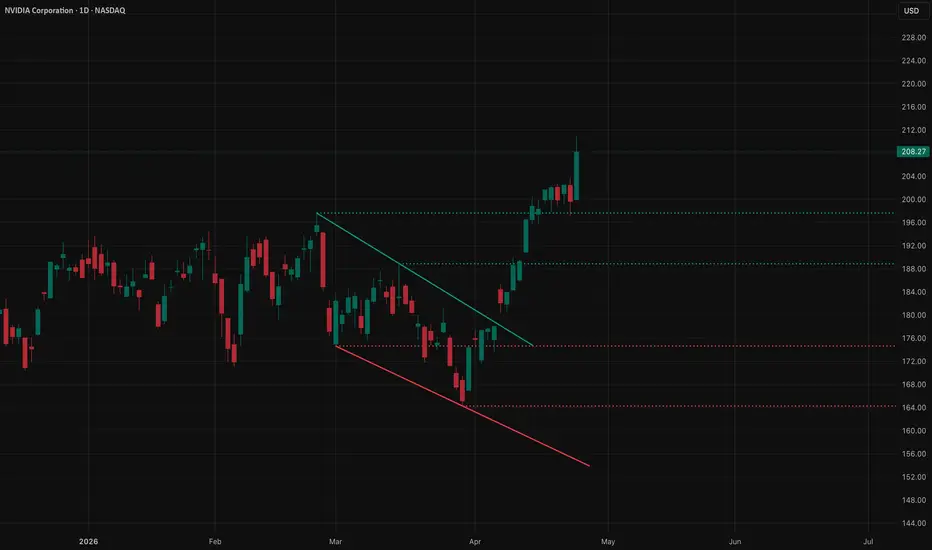
NVDA TA for This Week - April 27NVDA is trading at 208.10, sitting above every meaningful moving average on both the daily and weekly timeframes and pressing into open air above the recent pivot high at 188.88. There is no overhead resistance in the level pack — price has cleared the field. What happens next matters: either this move extends into a genuine continuation leg, or the tape stalls and we start watching the cluster of support structure below for clues on where the next base builds.
This is the kind of price action that looks easy until it isn't.
**1. Context — Bullish Structure, Confirmed**
The weekly structure is clean. NVDA is trading above the weekly 21 SMA at 184.63 and the weekly 50 SMA at 176.00, and the weekly 21 is above the weekly 50 — that's the condition that defines this as a bullish structure. Price is not fighting to reclaim a moving average; it's running above all of them. The daily stack is equally aligned: daily 21 at 187.57, daily 50 at 185.03, and daily 200 at 182.85 are all below current price and stacked in the right order. Every major trend reference is in the bulls' favor.
The weekly 200 SMA at 95.24 and weekly 300 SMA at 69.71 are so far below price they don't factor into near-term trade management. They're context for where the macro floor sits — nothing more right now.
**2. Setup — Extended Rally Into Open Space**
Price has broken through the recent pivot high at 188.88 and is now running without a clearly defined ceiling from this level pack. The move off the recent pivot low at 164.27 has been substantial, and NVDA is now trading roughly 27% above that low. The structure doesn't fit a clean, labeled pattern with conviction, so I'm not going to force one. What I will say is this: price has been trending higher through a stack of support levels that have flipped into a rising floor, and we're now in the upper extension of that move with momentum still pointing up but indicators beginning to flag overextension.
The ATR at 5.45 is the practical measure of daily noise. If you're sizing or placing stops, that's the number doing the work.
**3. Key Resistance — No Overhead Supply, Open Extension**
There are no defined resistance levels above 208.10 in this setup. Price has cleared the recent pivot high at 188.88 and traded through the volume profile's value area high at 191.89. The volume point of control at 188.00 is now below price, as is the VAH at 191.89. There is no pre-defined ceiling to lean against here. That's a double-edged condition — it means there's no resistance to stop a continuation, but it also means there's no price memory above to target precisely. The market is in price discovery above recent structure, and discipline on position sizing matters more in that environment, not less.
**4. Key Support — A Well-Defined Floor Below**
The support structure is layered and relatively close beneath current price.
The first meaningful level is 179.18, which aligns closely with the volume profile's value area low at 177.89 and sits just below the daily 200 SMA at 182.85. A pullback into this zone would be testing a confluence of multiple references — the kind of area where a healthy trend finds footing.
Below that, 174.64 is the next defined support, bracketed by the weekly 50 SMA at 176.00. If price were to reach this area on a pullback, I'd want to see that weekly SMA holding. It's the level the bias rests on: below 176.00 held weekly, the bullish structural argument gets complicated.
The deepest support in play is 164.27, which is also the recent pivot low. That's the swing level that, if broken, changes the character of this move from a healthy trend to something worth reassessing entirely.
The volume POC at 188.00 and VAH at 191.89 are the first zones price would revisit on any near-term pullback — both now acting as short-term support from below.
**5. Targets — Trend Extension**
With no overhead resistance to target precisely, the upside case is open-ended based on this setup. What I can say is that if the trend continues, 191.89 (the VAH) and 188.00 (POC) become the nearest reference points to watch on any dip — reclaiming those quickly on a pullback would signal the trend is intact. Trend extension beyond 208.10 has no defined ceiling here, which means the move lives and dies on momentum and how the indicators behave going forward.
**6. Indicator Confluence — Extended, Watch for Stall**
The daily RSI at 71.5 is overbought. Not catastrophically, but overbought. The weekly RSI at 65.11 is not yet in that territory, which is the mitigating factor — the weekly trend has room to run even while the daily is stretched. Critically, there is no bearish RSI divergence present. That matters. Divergence would be the early warning of trend exhaustion; its absence means the momentum signal is still aligned with the price move.
The daily Stochastic RSI is telling a different story. The K line is at 86.60 and D at 86.57 — they're essentially flat against each other at elevated levels, with the StochRSI itself at 99.36. The weekly StochRSI is at 100, with the K at 93.63 well above the D at 69.60. These are pinned-high readings. They don't predict a rollover, but they do tell you there is very little additional thrust available from momentum alone before a pause or pullback becomes probable. When both the daily and weekly StochRSI are pegged at or near 100, price can still grind higher, but the margin for error on new long entries shrinks.
**7. Levels at a Glance**
Resistance / Upside (above price):
* No defined resistance levels — price is in open extension above 208.10
Support / Downside (below price):
* 191.89 — Volume Area High (VAH), first reference on a pullback
* 188.00 — Volume Point of Control (POC), high-volume support node
* 188.88 — Recent pivot high, now structural reference from below
* 187.57 — Daily 21 SMA, short-term trend reference
* 185.03 — Daily 50 SMA, medium-term trend reference
* 184.63 — Weekly 21 SMA, weekly trend floor
* 182.85 — Daily 200 SMA, long-term daily support
* 179.18 — Defined support, near confluence with VAL and daily 200
* 177.89 — Volume Area Low (VAL), base of volume distribution
* 176.00 — Weekly 50 SMA, structural bias level
* 174.64 — Defined support, inside weekly 50 zone
* 164.27 — Recent pivot low, swing line in the sand
**Final Thoughts**
Bull case: The structural conditions remain intact. Price is above every major moving average, the weekly bias is bullish, and there is no bearish RSI divergence to warn of a reversal. If momentum continues and the daily RSI holds without rolling over sharply, this trend has room to extend into open space above 208.10. Any pullback that holds the 188.00 to 191.89 zone and then reclaims price above the VAH keeps the bull thesis clean.
Bear case: The daily RSI at 71.5 and daily StochRSI pinned near 100 with K and D converging are not bearish signals on their own, but they do flag that the move is stretched. A failure to continue higher, combined with a loss of the POC at 188.00 and then the weekly 50 SMA at 176.00, would start eroding the structural case. Below 176.00, the bullish argument requires reassessment.
**Bottom Line**
NVDA's structure is bullish and the levels confirm it — but price is extended against overbought daily momentum, running in open space with no overhead reference to manage against. Discipline on entries and respect for the support levels below are the job right now.
No hype. No bias. Just levels.
Trade safe. Plan ahead. Win together.
btcusdquick analysis with failure of breaking higher highs, hence the MSS and formed FVG which has been respected and taking quick shorts

XAU UPDATEDYou gonna get another chance at 700,
It may be the last time for this handle.
Some dangers to this. We don’t want to come into 777 first, could actually pose a threat to dump a n 650.
If we get back 700 beforehand, run that shxt up for full target. 🎯

Scalping XAU - Selling pressure below 4700📈 1. Trend : Structure
Looking at the chart:
After the previous decline, price has started forming higher lows, signaling a short-term recovery.
However, the upside remains capped by a strong horizontal resistance + EMA, keeping price contained.
Current structure:
→ Tight range / sideways, with a slight bearish bias
👉 Key observation:
Price is trading between:
An ascending trendline below (dynamic support)
A horizontal resistance zone above (~4,710 – 4,720)
→ This reflects a range + mild compression setup, often preceding a breakout.
📰 2. News Impact
Gold (XAU/USD) is struggling to extend its modest intraday gains but is holding above the $4,700 level during the European session.
Reports suggest Iran has proposed reopening the Strait of Hormuz and easing tensions with the US
Nuclear negotiations are postponed, but peace expectations are improving
👉 Market implication:
Improved geopolitical outlook can reduce safe-haven demand
However, it may also weigh on the USD, indirectly supporting gold
→ Overall: Mixed fundamental backdrop, but slightly supportive for gold in the short term
📊 3. Key Levels
🔴 Resistance: 4,710 – 4,725
👉 Strategy:
→ If price revisits this zone and shows weakness
→ Look for short-term SELL opportunities
🔵 Support: 4,680 – 4,660
4. signal
🔴 SELL GOLD zone : 4709 - 4712
sl: 4717
TP: 4682 - 4660 - 4630

Gold Recovers on Geopolitical Signals, Awaiting a Breakout📊 Market Developments:
Global gold prices are seeing a slight recovery (+0.16%) following reports regarding Iran's proposal, which helped ease previous sell-off pressure. Market sentiment is currently Neutral as investors await new economic data to determine a clearer trend.
📉 Technical Analysis:
- Key Resistance: 4,760 USD and 4,785 USD.
- Nearest Support: 4,700 USD and 4,647 USD.
- EMA: Price is hovering around 4,717 USD, right at the EMA 09 (4,717.9). This indicates a sideways short-term trend; a clear candle close above or below this line is needed for confirmation.
Candlestick/Volume/Momentum: RSI 14 is at 53.79, showing a balance between buying and selling. The chart indicates price accumulation in a narrow range after a correction.
📌 Outlook:
Gold may continue to recover toward 4,760 USD in the short term if the 4,700 USD psychological support holds and geopolitical reports remain positive.
💡 Trading Strategy:
🔻 SELL XAU/USD: 4,758 – 4,762
🎯 TP: 40/80/200/300 pips
❌ SL: 4,765 USD
🔺 BUY XAU/USD: 4,700 – 4,705
🎯 TP: 40/80/200/300 pips
❌ SL: 4,697 USD

US100 Balanced Structure: Next Move Depends on BreakUS100 is currently showing a strong bullish trend, backed by both technical structure and fundamental strength.
Furthermore, improving geopolitical conditions and reduced global uncertainty are creating a risk-on environment, encouraging investors to move into equities. Institutional buying and consistent capital inflows are also adding strength to the trend, while seasonal momentum during this period is supporting continued upside pressure.
At the same time, the bullish movement is strongly supported by key market drivers. The Nasdaq continues to benefit from strong corporate earnings, especially from major tech companies, which is increasing investor confidence. In addition, the ongoing AI-driven growth is pushing tech stocks higher, making US100 one of the strongest-performing indices.
Tecnically the market has successfully broken out of a prolonged bearish channel, confirming a clear shift in momentum. After the breakout, price delivered a strong impulsive move upward, forming higher highs and higher lows a classic bullish structure at the moment, price is consolidating between 26,400 – 26,900, which indicates a healthy pause after the rally. This consolidation is acting as an accumulation phase, suggesting the market is preparing for the next move higher rather than reversing.
You may find more details in the chart,
Trade wisely best of luck buddies.
Ps; Support with like and comments for better analysis Thanks for Supporting.
Godwin Emamuzo Mark Higher high and lower high, lower high and lower low, break of structure, change of character, QML, session highs and lows.

Why I Stopped Building Indicators and Started Building AgentsMost automated trading systems are built like single-purpose machines: one strategy, one set of rules, one set of conditions to meet. They work until the regime they were built for ends, and then they don't.
The interesting question isn't how to make a single strategy more robust. It's whether robustness is the right goal at all — or whether it's better to build systems where individual components can stay narrow, and the coordination between them is where the durability lives.
That reframing changes a lot of things.
It changes how you think about risk. A risk layer that's tangled up with strategy logic has to be reasoned about every time the strategy changes. A risk layer that's a peer to the strategy — making decisions about whether any strategy gets to fire — is a different kind of system. Cleaner to maintain. Harder to bypass accidentally.
It changes how you think about context. Market context — regime, news, calendar, session phase — isn't a feature you bolt onto a strategy. It's its own concern, with its own logic, that informs strategies without being inside them. When context lives in its own layer, every strategy gets it for free, and you can update how context is generated without touching trade execution.
It changes how you think about review. When the parts of a system are loosely coupled and each part's reasoning is logged separately, you stop debugging a black box and start having something closer to a conversation with your own automation. That's a different relationship to the work.
None of this requires the most expensive AI tooling, or the latest model, or any particular framework. It requires being willing to slow down and define what each part of the system is responsible for — and then resisting the temptation to let the parts bleed into each other.
The hardest part hasn't been the trading logic. It's been the architecture: deciding which decisions belong to which layer, and what happens when they disagree.
More on this as the work matures.
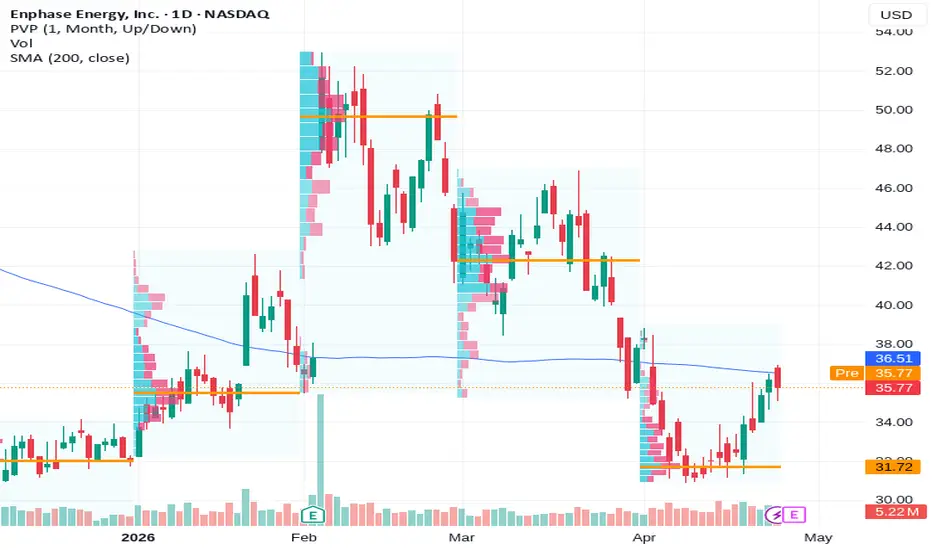
ENPH Breakout Watch: $36 Level Could Trigger Fast Upside:Current Price: 35.77
Direction: LONG
Confidence level: 58%(Trader commentary and sentiment lean bullish with repeated focus on a $36 breakout and $38+ upside target, but data volume is limited and lacks strong multi‑source confirmation.)
Targets
Target 1: 36.80
Target 2: 38.50
Stop Levels
Stop 1: 35.30
Stop 2: 34.80
Wisdom of Professional Traders:
This analysis synthesizes insights from thousands of professional traders and market experts, combining what traders are saying across platforms with real‑time sentiment. When many traders independently focus on the same price levels and catalysts, it often reveals where liquidity and momentum may appear next in Enphase Energy.
Key Insights:
Here's what's driving this setup. Several traders are focused on the $36 level, which has been acting as the immediate resistance zone. Multiple traders pointed out that a break above this level could open the door to a quick move toward the $37–$38 area. What's interesting is that sentiment around the recent earnings beat and European distribution partnership is pushing traders toward the bullish side.
At the same time, traders are clearly watching the $35 support area. The price dipped toward that zone recently but held, which suggests buyers are stepping in around that level. When price sits between well‑defined support and resistance like this, the next breakout tends to move quickly once liquidity builds.
The other thing catching attention is the broader solar sector interest. Several traders mentioned that if the sector catches momentum again, ENPH could be one of the faster movers because of its high beta.
Recent Performance:
ENPH has been bouncing around the mid‑$30 range recently after recovering from deeper lows earlier in the year. The stock traded as high as $36.94 intraday before pulling back to around $35.77. That price action tells me the market is testing resistance but hasn't fully committed yet. Volume around the earnings announcement also increased, which suggests institutions are paying attention again.
Expert Analysis:
Traders are mostly focused on a technical breakout scenario. Several traders highlighted the $36 resistance level and the $38–$38.5 upside target if momentum kicks in. That level comes up repeatedly because it lines up with previous price congestion and moving‑average resistance on the chart.
At the same time, some traders pointed to $34.5 as the downside level if support fails. That gives us a fairly clean risk‑reward setup: the market is compressing between $35 support and $36 resistance. When traders see that type of compression, they usually position for the breakout direction.
News Impact:
Recent news helped the bullish case. Enphase reported a Q1 2026 earnings beat with stronger‑than‑expected EPS and modest revenue growth guidance. On top of that, the new European utility partnership expands distribution for its micro‑inverter and storage products. There are still regulatory concerns in Europe that traders mentioned, but right now the market seems more focused on the earnings strength.
Trading Recommendation:
So where does this leave us? I'm leaning LONG because trader sentiment tilts bullish and price is holding just above the $35 support zone. The key trigger is a push above $36. If momentum follows through, the move toward $36.80 and then $38.50 this week looks achievable.
I'd treat this as a breakout trade rather than a long‑term position. Enter near the current range or on a confirmed move above $36, keep risk tight below $35.30, and watch volume closely. If buyers step in aggressively, ENPH could move quickly because short interest in the name is still elevated.
MSFT approaching key $434 resistance ahead of earnings – downsiCurrent Price: 424.62
Direction: SHORT
Confidence level: 62%(Several professional traders identified $434 as major resistance while noting MSFT remains below the 200‑day moving average. Multiple downside levels ($412 and $394) were discussed as potential pullback zones if earnings disappoint. X sentiment is bullish but trader technical analysis leans toward near‑term downside risk.)
Targets
Target 1: 412
Target 2: 394
Stop Levels
Stop 1: 434
Stop 2: 440
Wisdom of Professional Traders:
This analysis combines what professional traders are saying with real‑time social sentiment to identify actionable setups in Microsoft. When many traders independently point to the same levels—like the $434 resistance and $394 support—it helps filter noise and highlight the price zones that the market is actually watching.
Key Insights:
Here’s what’s driving the trade idea right now. Several professional traders highlighted that Microsoft is still trading below its 200‑day moving average, which suggests the broader trend hasn’t fully recovered. When a mega‑cap sits below that long‑term average, rallies often stall at nearby resistance levels.
The second big factor is timing. Microsoft reports earnings this week alongside other major tech giants. Many traders are treating the move into earnings as a “decision zone.” If price can’t break above the $434 Fibonacci resistance level that multiple traders identified, the path of least resistance could shift lower quickly.
At the same time, X sentiment shows plenty of optimism around Microsoft’s long‑term AI story. Posts referencing Azure growth, Copilot monetization, and institutional buying remain strong. But that optimism doesn’t necessarily protect the stock from short‑term pullbacks—especially heading into a volatile earnings catalyst.
Recent Performance:
Microsoft closed around $424.62 after a modest daily gain of about 2.1%. Over the past month the stock has climbed roughly 12%, but it’s still well below its 52‑week high near $553. That means the recent move looks more like a rebound inside a broader correction rather than a confirmed new uptrend.
You can see this clearly on the chart. Price is currently sitting in the middle of its yearly range and approaching a cluster of resistance levels around $430–$435.
Expert Analysis:
Several professional traders repeatedly mentioned the same technical levels. The most important one is $434, which lines up with a key Fibonacci retracement and recent resistance area. Multiple traders noted that a confirmed breakout above that level would shift the trend bullish again.
But until that breakout happens, traders are watching downside zones. A few traders highlighted $412 as a short‑term price action level, while the bigger support sits around the $394 50‑day moving average. If earnings disappoint or guidance comes in soft, those levels become realistic short‑term targets.
What caught my attention is how consistent those numbers were across different trader analyses. When multiple traders independently mention the same levels, they often become self‑fulfilling because so many participants are watching them.
News Impact:
Recent news flow adds another layer of uncertainty. Microsoft is offering voluntary buyouts to employees while ramping up AI infrastructure spending. That combination shows the company is aggressively reallocating resources toward AI and cloud growth.
Meanwhile analysts remain extremely bullish long‑term, with price targets from firms like Guggenheim and Citigroup in the $586–$600 range. But markets often separate long‑term optimism from short‑term earnings risk, especially when expectations are high.
Trading Recommendation:
Putting it all together, I’m leaning SHORT into the resistance zone. The setup is fairly straightforward: Microsoft is approaching a widely discussed resistance area near $434 while heading into a high‑volatility earnings event.
I’d look for weakness below $434 with downside targets at $412 first and $394 if momentum accelerates after earnings. Risk should be managed tightly with stops above $440 in case the stock breaks out and squeezes higher.
If Microsoft pushes decisively above $434 and holds it, that would invalidate the bearish setup quickly. But until that breakout happens, the trader consensus suggests the risk‑reward slightly favors the downside this week.

Maintain accumulation - descending trendline below 4700📈 1. Trend : Structure
Previously, price formed a top around the 4.88x – 4.89x zone and then reversed sharply → confirming a break of the bullish structure.
A clear descending trendline is now controlling the overall downtrend.
During the decline:
Price has been consistently rejected at the trendline
A sequence of lower highs + lower lows is maintained → confirming a stable downtrend
👉 Current situation:
Price is showing a slight rebound from the 4.65x – 4.66x bottom zone
Moving within a weak pullback structure below the trendline
Being compressed between:
The descending trendline above
A horizontal support zone below
→ This forms a bearish compression pattern, which often leads to a breakdown
👉 Conclusion:
Short-term trend: Bearish
Main structure:
→ Downtrend → weak pullback → continuation lower
📊 2. Key Levels
🔴 Resistance (Sell Zone):
4,700 – 4,725
Confluence:
Descending trendline
EMA (dynamic resistance)
Recent rejection zone
👉 A strong area to look for sell setups in line with the trend
🔵 Support (Downside Targets):
Short-term: 4,660 – 4,650 (currently being tested)
Key level: 4,630 – 4,620
Deeper target: ~4,580 – 4,600
👉 A confirmed break below the 4.65x zone could trigger a strong breakdown
3. SIGNAL
SELL GOLD zone 4770 - 4773
sl : 4778
TP : 4745 - 4722 - 4682
