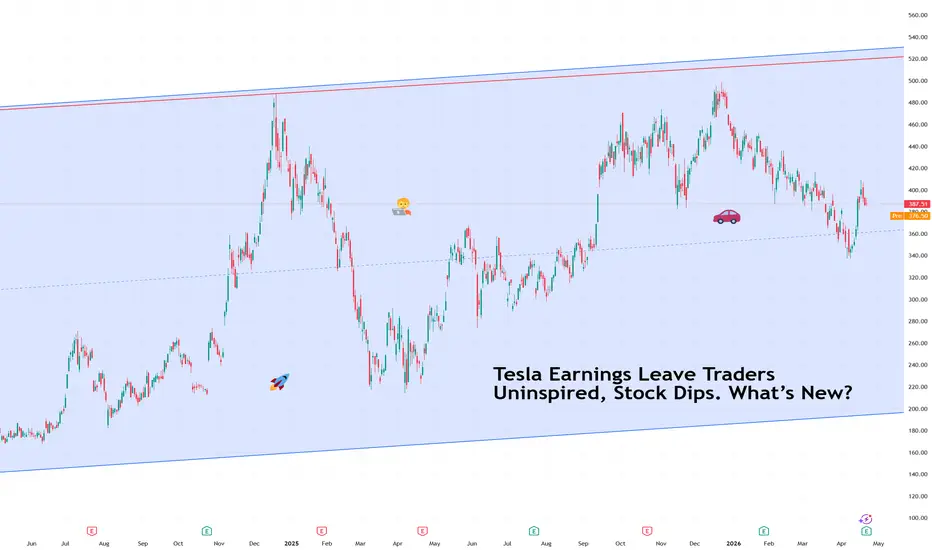
Tesla Earnings Leave Traders Uninspired, Stock Dips. What’s New?Strong numbers arrived. Bigger questions arrived with them.
Tesla NASDAQ:TSLA reported quarterly earnings that technically cleared expectations. Revenue reached $22.4 billion, slightly ahead of forecasts, while adjusted earnings per share landed at $0.41, above the expected $0.36 .
Free cash flow surprised to the upside as well, coming in at $1.4 billion instead of the loss analysts anticipated. On paper, this looked like the kind of report that normally lifts a stock.
Shares did rise briefly in after-hours trading. Then the mood changed during the earnings call. In other words, the earnings season is here and it’s getting heated.
📉 Call Shifted the Narrative
Markets rarely react only to numbers. Guidance often matters more than the quarter itself. During the call, Elon Musk outlined plans for a major expansion in capital spending tied to robotaxis, robotics, trucks, and artificial intelligence infrastructure.
Tesla now expects roughly $25 billion in capital expenditure this year, up from prior guidance of $20 billion. But also, a big increase from last year’s $8.5 billion.
Investors quickly recognized what that means. Higher spending today usually delays profits tomorrow. Enthusiasm faded almost immediately.
🤖 Company Is Changing Shape
Tesla continues to move away from its origin story as a pure electric vehicle manufacturer. The retirement of Model S and Model X reflects that shift. The focus now centers on Cybercabs, humanoid robots, AI chips, and autonomous logistics.
Meanwhile, operating profit rose sharply, climbing 136% year over year to $941 million. Yet the conversation increasingly revolves around what Tesla might become rather than what it currently sells.
🏗️ Capex Is the New Headline
Capital expenditure refers to money spent building factories, infrastructure, and future products. It signals ambition, though it also signals patience is required.
Tesla’s quarterly capex reached $2.5 billion, already elevated. Musk indicated the pace will accelerate significantly as the company develops robotics platforms and builds a massive chip facility tied to its autonomy strategy.
Big Tech rivals plan to spend roughly $660 billion this year on similar infrastructure. Tesla clearly wants a seat at that table.
🚕 Robotaxis Still Live in the Future
The robotaxi story remains central to Tesla’s valuation narrative. The company continues running limited pilot programs in parts of Texas, though Musk indicated meaningful revenue from autonomous ride networks will likely arrive next year rather than immediately.
Investors tend to discount future earnings into today’s stock price. When timelines stretch, patience becomes part of the trade.
🛰️ Musk Ecosystem Expands
Tesla’s strategic orbit (pun intended) continues overlapping with Musk’s broader technology network. The company invested $2 billion into xAI earlier this year, and that stake later converted into equity connected to SpaceX following reshuffling across Musk’s ventures.
Speculation about deeper integration between Tesla and SpaceX continues circulating among analysts. Such moves would reshape how investors interpret Tesla’s identity as both an automotive and infrastructure platform. Especially with the upcoming SpaceX IPO , likely coming in a couple of months.
📊 Familiar Stock Reaction
Tesla’s stock often reacts less to what happened last quarter and more to what investors expect next year.
Adjusted profits rose 56% to $1.5 billion after excluding cryptocurrency losses ($173 million loss on 11,509 Bitcoin BITSTAMP:BTCUSD ) and higher stock-based compensation, yet the market focused on spending plans rather than earnings strength.
That pattern has become familiar. Tesla reports solid results. Musk outlines bigger ambitions. Traders reassess timelines.
🎁 The Takeaway
Tesla delivered a respectable quarter with improving profitability and stronger-than-expected cash flow. But the muted stock reaction reflects a company operating in transition rather than decline.
Markets appear willing to support Tesla’s long-term robotics and autonomy strategy, though they remain cautious about how quickly those bets translate into revenue.
Off to you : Is Tesla still an electric vehicle company with an AI side project, or is it becoming an AI company that happens to sell cars along the way? Share your views in the comments!
In-depth trading ideas
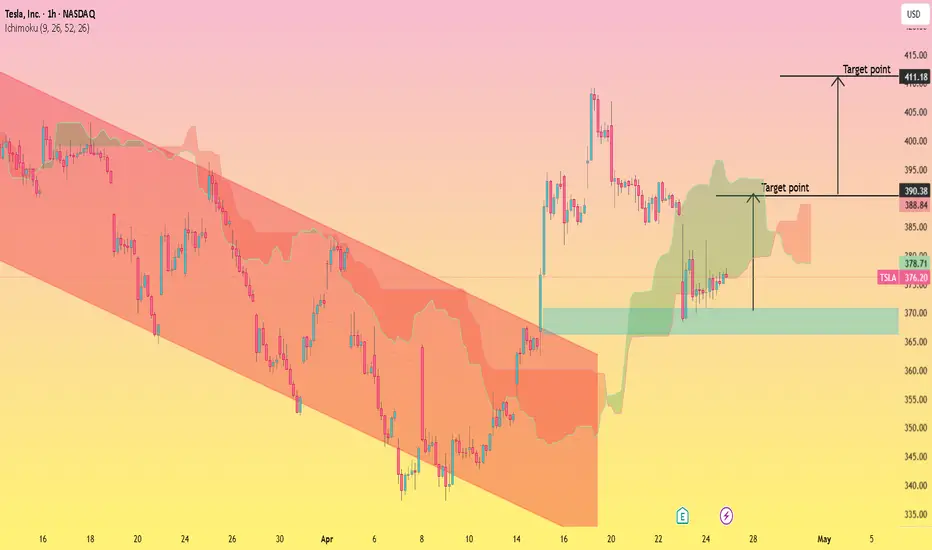
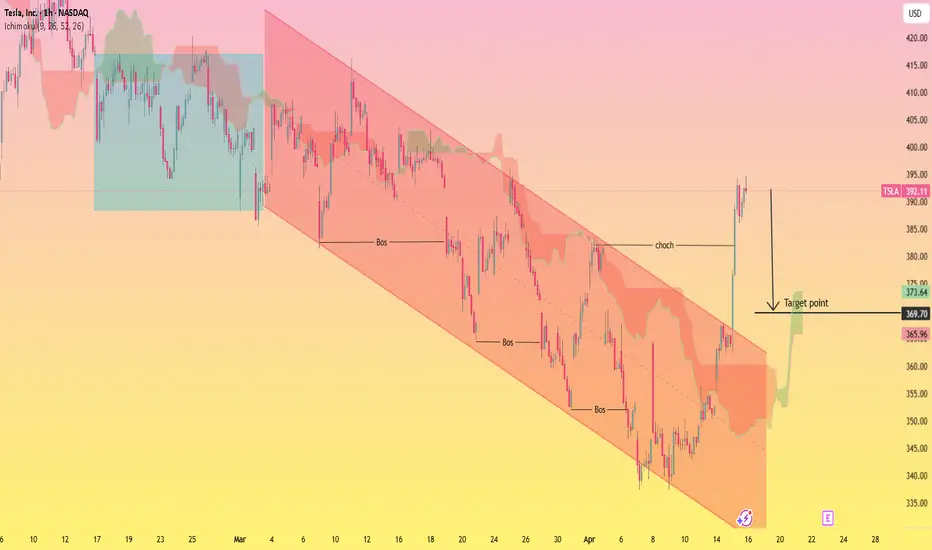
Tesla Breakout After Downtrend – Bullish TargetsThis chart of Tesla, Inc. (TSLA) shows a clear shift from a strong downtrend into a bullish recovery. Initially, the price was moving inside a descending channel (red zone), indicating consistent selling pressure. However, the price eventually broke out of this channel with a sharp upward move, signaling a potential trend reversal.
After the breakout, the price formed a consolidation range around the green support zone (near 370–372), showing stability and accumulation. The presence of the cloud (likely an Ichimoku indicator) suggests the market is trying to build bullish momentum above support.
Targets:
First Target: Around 390–395 (short-term resistance area marked on chart)
Second Target: Around 410–412 (major resistance / target point shown above)
What Does Tesla's Chart Say Heading Into This Week's Earnings?Tesla NASDAQ:TSLA soared 7.6% one day last week -- its best single session in more than nine months -- and has gained some 15% in less than two weeks as the EV giant prepares to report Q1 earnings. I don't personally like when stocks run upward into earnings, but Tesla's technicals and fundamentals seem to be shaping up rather well.
Let's explore:
Tesla's Fundamental Analysis
TSLA plans to release earnings on Wednesday after the bell at a time when the stock is down some 13% year to date amid a beat-down that began in earnest in mid-December.
Wall Street expects the electric-vehicle firm's first-quarter results to show $0.36 in adjusted earnings per share on roughly $22.35 billion of revenue.
A print like that would reflect about 15.5% in year-over-year revenue growth, as well as a 33% y/y gain from the $0.27 in adjusted EPS that Tesla saw in the same period last year.
But interestingly, nine of the 26 sell-side analysts that I know to cover TSLA have lowered their earnings estimates for the period since the quarter began, while only four have raised them.
The remaining 13 analysts have made no changes. This tells me that more than a few of them don't really know what's coming.
Tesla's Technical Analysis
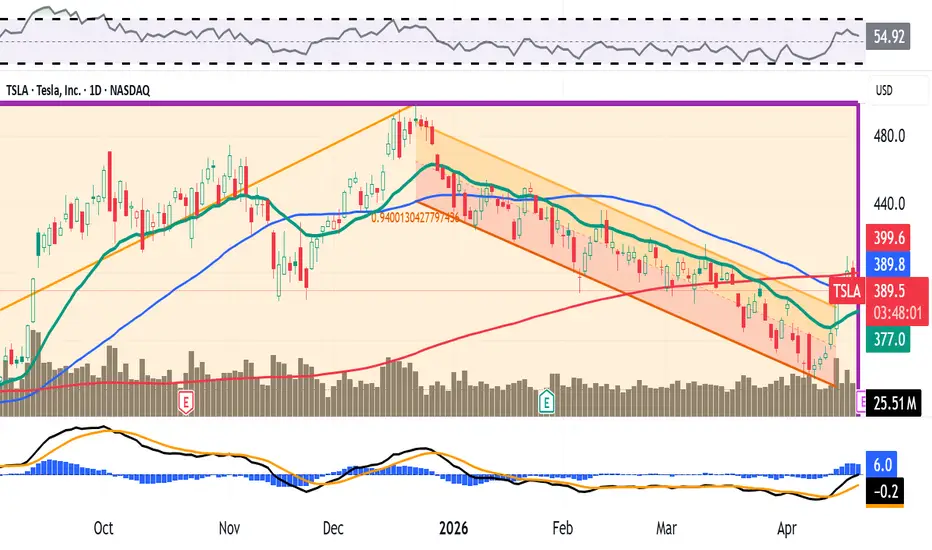
Now let's check out TSLA's chart going back some eight months and running through Thursday afternoon (April 16):
Readers will first note that TSLA saw a double-top pattern of bearish reversal this past autumn, as marked by the two red boxes at the chart's left. That pattern worked out quite well.
However, the stock has recently broken out of a downtrend, as illustrated here by a Raff Regression model (the orange-and-pink shaded area at the chart's right).
The stock has also retaken its 21-day Exponential Moving Average (or "EMA," marked with a green line), which has likely re-energized the swing crowd.
That said, Tesla has been recently butting up against resistance at its 50-day Simple Moving Average (or "SMA," marked with a blue line) and its 200-day SMA (the sloping red line) as well.
TSLA took both of them late last week, but it's not yet clear whether it can hold them. (It fell back below the 200-day SMA on Monday and the 50-day line intraday on Tuesday.)
If the stock does hold these two lines, that could cause portfolio managers with a financial interest in Tesla to consider increasing their long-side exposure in response.
Meanwhile, Tesla's Relative Strength Index (or "RSI," the gray line at the chart's top) has improved. So has its daily Moving Average Convergence Divergence indicator (or "MACD," marked by blue bars and black and gold lines at the chart's bottom).
However, neither one is postured very bullishly as of yet. Within that MACD, the histogram of the 9-day EMA (the blue bars) has moved above zero, sending short-term bullish signals.
Similarly, the 12-day EMA (the black line) has moved above the 26-day EMA (the gold line). That's bullish, but the fact that both lines remain below zero does temper that energy a bit.
An Options Option
Some option traders who are bullish on Tesla but also want to limit downside risk are probably using what's known as "bull-call" spread here.
That's where you buy one call on a stock and sell another with a higher strike price, but where both expire on the same day. Here's an example:
-- Long one TSLA call with an April 24 expiration (i.e., after earnings) at a $390 strike price (near the stock's 50-day SMA). That cost roughly $12.90 at recent prices.
-- Short one TSLA April 24 $405 call for about a $6.80 credit.
Net Debit: $6.10.
This trade risks the $6.10 net debit (the maximum theoretical loss) in an attempt to bring in $15, for a maximum theoretical profit of $8.90.
These options traders would see the $8.90 maximum theoretical profit if TSLA trades at or above $405 at expiration.
Conversely, traders would face the $6.10 maximum theoretical loss if Tesla trades at or below $390 at expiration.
(Moomoo Technologies Inc. Markets Commentator Stephen "Sarge" Guilfoyle had no position in TSLA at the time of writing this column.)
This article discusses technical analysis, other approaches, including fundamental analysis, may offer very different views. The examples provided are for illustrative purposes only and are not intended to be reflective of the results you can expect to achieve. Specific security charts used are for illustrative purposes only and are not a recommendation, offer to sell, or a solicitation of an offer to buy any security. Past investment performance does not indicate or guarantee future success. Returns will vary, and all investments carry risks, including loss of principal. This content is also not a research report and is not intended to serve as the basis for any investment decision. The information contained in this article does not purport to be a complete description of the securities, markets, or developments referred to in this material. Moomoo and its affiliates make no representation or warranty as to the article's adequacy, completeness, accuracy or timeliness for any particular purpose of the above content. Furthermore, there is no guarantee that any statements, estimates, price targets, opinions or forecasts provided herein will prove to be correct.
Options trading is risky and not appropriate for everyone. Read the Options Disclosure Document ( j.moomoo.com ) before trading. Options are complex and you may quickly lose the entire investment. Customers should consider their investment objectives and risks carefully before investing in options. Because of the importance of tax considerations to all options transactions, the customer considering options should consult their tax advisor as to how taxes affect the outcome of each options strategy. Supporting documents for any claims will be furnished upon request.
Options trading subject to eligibility requirements. Strategies available will depend on options level approved.
Maximum potential loss and profit for options are calculated based on the single leg or an entire multi-leg trade remaining intact until expiration with no option contracts being exercised or assigned. These figures do not account for a portion of a multi-leg strategy being changed or removed or the trader assuming a short or long position in the underlying stock at or before expiration. Therefore, it is possible to lose more than the theoretical max loss of a strategy.
Opening new options positions close to or on their expiration date comes with substantial risk of losses for reasons that include potential volatility of the underlying security, limited time to expiration. This type of strategy is not suitable for all investors and should be utilized only by sophisticated investors who understand the essentials of options and the risks associated with short interval trading.
Moomoo is a financial information and trading app offered by Moomoo Technologies Inc. In the U.S., investment products and services on Moomoo are offered by Moomoo Financial Inc., Member FINRA/SIPC.
TradingView is an independent third party not affiliated with Moomoo Financial Inc., Moomoo Technologies Inc., or its affiliates. Moomoo Financial Inc. and its affiliates do not endorse, represent or warrant the completeness and accuracy of the data and information available on the TradingView platform and are not responsible for any services provided by the third-party platform.
Tesla remains weak below the $400 levelIt has been a difficult trading week for Tesla, as the stock has posted a decline of more than 3.00% on average over the last three sessions. This move came after the company’s earnings release.
Despite reporting earnings per share of 41 cents versus 37 expected, and revenue of $22.39 billion compared to $22.64 billion projected, the main catalyst behind the selling pressure has been concerns about slowing demand and the need to lower prices to stabilize orders. These challenges have yet to be resolved and, for now, have weighed on market confidence in the short term. In this context, weakness could remain a key theme in the coming sessions.
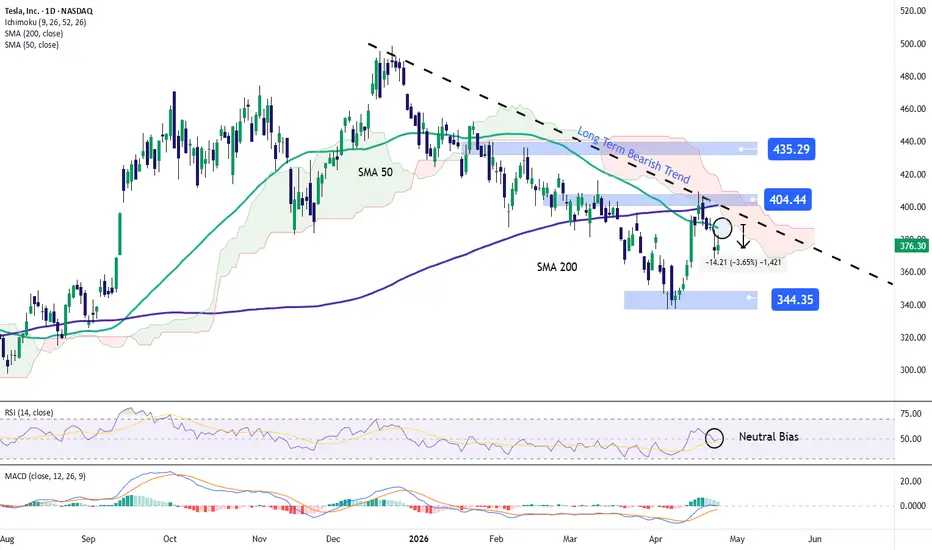
Downtrend remains intact: Recent price action in Tesla continues to respect a well-defined bearish trendline that has been in place since December 2025. So far, there has not been a strong enough buying move to challenge this structure, keeping it as the most relevant technical factor. As long as selling pressure remains in control, the extension of this trend could continue to gain relevance in the coming weeks.
RSI: The RSI indicator is currently hovering around the 50 level, reflecting a balance between buying and selling forces. If this dynamic persists, indecision could become more evident in price action.
MACD: A similar pattern can be observed in the MACD, where the histogram remains close to the zero level, indicating a balance in short-term moving average strength. This reinforces the idea of a neutral phase in the market.
Key levels to watch:
$435: A level of recent highs located above the current bearish trendline. A move toward this area could open the door to the formation of a new bullish trend in the coming weeks.
$400: A key psychological level that aligns with the bearish trendline and the 50 and 200-period moving averages. This is the most important barrier on the chart, and sustained moves above it could invalidate the downtrend and support a more dominant bullish bias.
$344: A level corresponding to the 2026 lows. A move toward this area would reinforce selling pressure and could extend the current bearish trend in the short term.
Written by Julian Pineda, CFA, CMT – Market Analyst
TESLA APRIL 21 2026 LIVE ANALYSISThis is the price action of Tesla & if you have any doubts feel free to leave a comment. If you don't understand the setup then don't touch it
NOTE :I AM BULLISH &LONG

Tesla Inc. Stocks & Crypto: We Are All One!What one does, the rest follows.
Tesla (TSLA) hit bottom in January 2023. It has been moving within a rising channel, higher highs and higher lows since.
Volume was moving down until December 2024. The drop in volume was the preparation for a correction. Volume has been rising and 7-April 2025 produced the highest volume since February 2023.
Here is the thing, when the highest buying came in February 2023, it was the start of this major bullish dynamic, the rising channel. Now volume starts to rise again after a major low (a higher low by the way). This means that we are set to experience another phase of growth, reaching new highs compared to December 2024 and in December TSLA produced its All-Time High. This means that the current bullish wave, brand new, will end in a new ATH in a matter of months. Isn't that great?
Knowing that Tesla is growing and set to continue growing, we know that all related markets or those that have a positive correlation with this one will also grow; What one does, the rest follows.
Thanks a lot for your continued support.
Namaste.

Tesla Inc. Bearish Channel Breakdown with Short-Term RejectionPrice was initially ranging in a consolidation zone (blue area), then broke structure (BOS) and entered a strong bearish channel (red). Inside the channel, price kept making lower highs and lower lows, confirming a clear downtrend.
Recently, price showed a strong bullish push creating a CHOCH (Change of Character), but it is now approaching a key resistance/supply area near the Ichimoku Cloud. This area is likely to act as rejection again.
🎯 Target:
If rejection confirms, the next downside target is around 369.00 – 370.00, as marked on the chart.
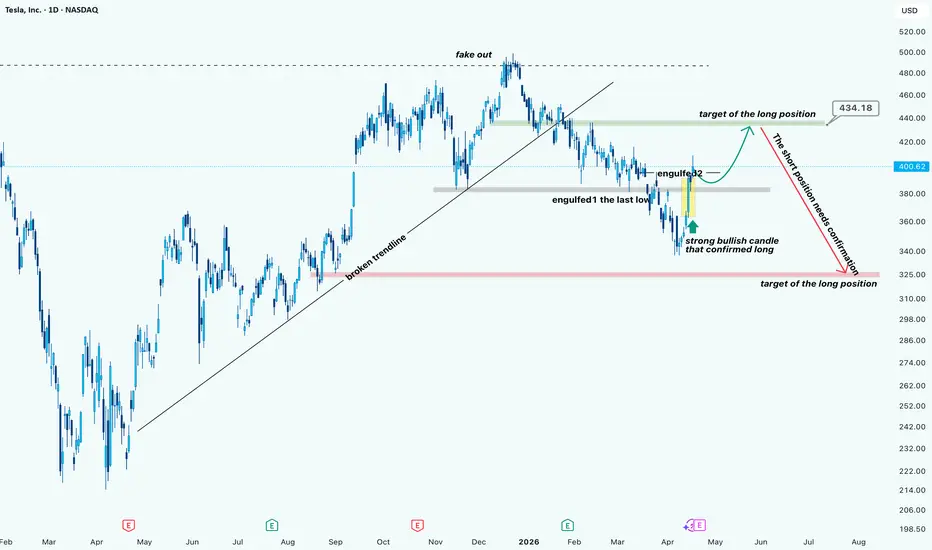
Tesla (TSLA) -> Daily Timeframe AnalysisHi!
After the breakdown of the ascending trendline, the structure clearly shifted from bullish continuation into a corrective phase. The move above the previous highs turned into a fake breakout, which was followed by consistent lower highs.
Recently, price swept the previous low and formed a strong bullish reaction. The key detail here is the engulfing structure:
First, the market took liquidity below the last low
Then printed a strong bullish engulfing candle, confirming buyer presence
This is not random; it’s a liquidity grab + demand reaction, which often leads to a short-term bullish push.
Current Scenario
As long as price holds above the recent demand zone, the bias remains bullish in the short term.
The expected move is a push toward the green supply area around $434.
What happens at $434?
That’s the important part.
This move up is not a confirmed trend reversal, yet it’s more likely a corrective rally inside a broader bearish structure.
At the $430–$435 zone, we should expect:
Weakening bullish momentum
Possible rejection
Or distribution
👉 From there, a potential drop can happen, but:
Short positions require confirmation (rejection, lower high, bearish engulfing, etc.)
Alternative Scenario
If price breaks and holds above $434, then the structure shifts again, and the bearish idea becomes invalid, opening room for continuation higher.
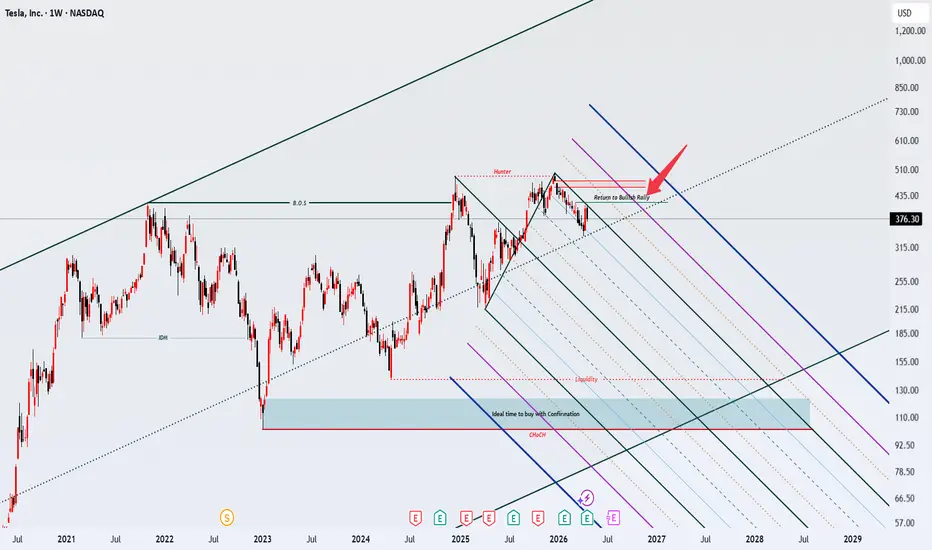
TeslaHi everyone 🌟
This is a long-term analysis of Tesla. I’m speaking directly to Tesla holders, so I’m sharing one of the best viewpoints I have—so they can push this analysis and move toward success with confidence.
Just look how simple I said it… and how clear it is!
After a big weekly BOS and a sweep of the highs, price is currently pulling back inside a very clean channel. But keep in mind: this is happening inside a bigger upward channel.
So once the market has collected liquidity, it should continue back toward the upside.
I want to emphasize this: if price returns to the target, we should see the bullish move continue again—likely a small correction, followed by a sharp upward move.
So we should pay close attention to when this stock starts to actually run. It’s better to monitor it carefully, but don’t get emotional and don’t buy in a rush.
Thank you, my dear followers.
Unfortunately, these days I don’t have a good internet connection to post lower-timeframe signals. Please forgive me.
Thank you again 🌟
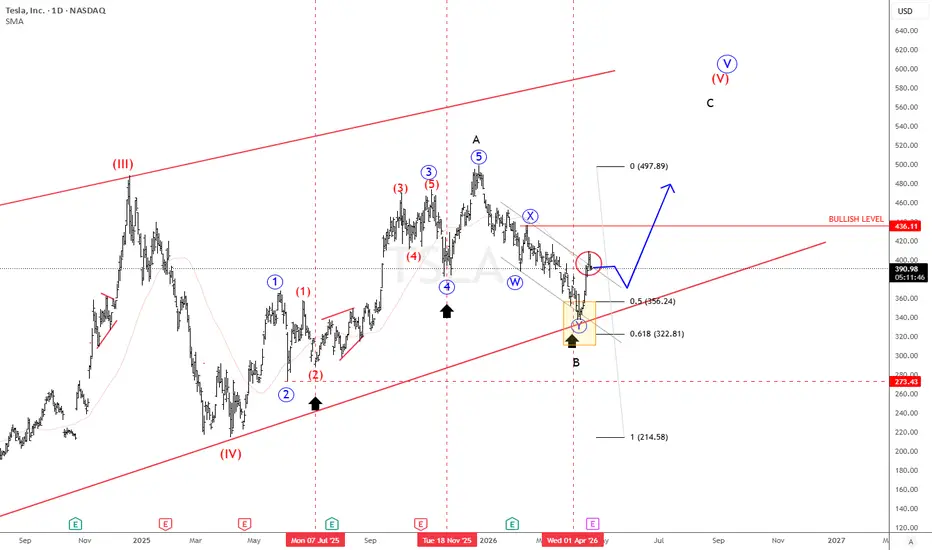
Tesla Testing Fibonacci Support as Correction Nears CompletionTesla has pulled back nearly 30% from recent highs, but the internal structure of the decline still appears corrective rather than impulsive. The price action is unfolding in a multi-swing move, suggesting a potential seven-wave corrective pattern rather than a full trend reversal.
The stock is now approaching a key technical area between the 50% and 61.8% Fibonacci retracement of the rally from the April 2025 lows. This zone is structurally important and often acts as a reaction point in ongoing bullish trends. Early signs of stabilization are already visible, with price attempting to recover outside of the prior corrective channel, hinting that buyers may be stepping back in.
If this support holds, Tesla could still see another upward leg, potentially completing wave C of a broader wave five within an ending diagonal structure.
Highlights:
• Decline still appears corrective, likely a multi-swing structure.
• Price is reacting at the 50%–61.8% Fibonacci retracement zone.
• Break above 436 confirms bullish continuation.
• Drop below 337 risks deeper correction toward 200–150.
TSLA (Tesla Inc.) — Range Break or Rejection?Idea
TSLA is currently trading in a wide consolidation range after high volatility phases. The market is waiting for a catalyst (AI, autonomy, deliveries, margins).
This creates a classic breakout vs rejection setup.
📈 Technical Overview
- Range-bound structure
- Key resistance overhead
- Liquidity building on both sides
- Potential for expansion move
🟢 LONG Scenario (Breakout Play)
Entry: Break & hold above $200–210 resistance
Targets:
- TP1: $240
- TP2: $270+
Stop-loss: Below $190
👉 Logic: breakout + momentum ignition + retail/institutional flow
🔴 SHORT Scenario (Rejection Play)
Entry:
- Rejection from $200–210 zone
- Weak momentum / fake breakout
Targets:
- $170
- $150
Invalidation:
Clean breakout with strong volume
⚠️ Risks
- News-driven volatility (AI, FSD, earnings)
- Elon Musk headlines impacting sentiment
- Market-wide tech sector moves
🧩 Summary
- TSLA is in a decision zone.
📌 Strategy:
- Trade the breakout OR
- Fade the rejection
No middle ground - wait for confirmation.

TESLA: correction before a generational rally to $1000.Tesla turned neutral on its 1W technical outlook (RSI = 45.357, MACD = -5.430, ADX = 42.116) as despite the heavy volatility this month, it remains on a downtrend since December 2025. The long term pattern is more than clear on TSLA. It is on its 3rd ever Accumulation Phase of the 16 year Channel Up since its IPO and 2026 is a Bear Cycle like 2019, the final before a parabolic rally that has followed the prior two accumulation patterns. Since the price action since the January 2023 has been contained between the 0.5 - 0.786 Fibonacci range, our expectation for end 2028 is to hit at least the top of the range (TP = 1,000). As for the 2026 Low it should be near the 1M MA100, possibly near 230.
## If you like our free content follow our profile to get more daily ideas. ##
## Comments and likes are greatly appreciated. ##

Tesla - Earnings release coming soonLast Friday, price came just shy of the 2.618 fib extension. This is within the target box for (a) and the exact area I said price should ideally make a local top. If this is the top of (a), then price will be headed to the $350's-$360's next for (b). Price did make a top on neg div which is a good clue that price could easily reverse soon. Rather that happens or not we just have to wait and find out. Given where price is and the structure that it has carved out, I would not be surprised if it does.
Earnings is this Wednesday. I have two thoughts about these earnings.
Option #1: price retraces to the aforementioned area prior to release with the release causing price to spike higher again kicking off (c) of B.
option #2: price chops in this area until earnings release. Once the report is made public, it will cause price to drop lower in the retrace we're expecting for (b).
I like option #2 better, but we will just have to wait and see.

Tesla, Inc (TSLA): Trendline Breakout, More Bullish Move!Tesla (TSLA) stock is experiencing volatility, hovering around $375-$377 following Q1 2026 earnings. while beating some targets, the stock faces pressure from increased $25B capital spending plans for 2026, slow robo-taxi rollout, and intense competition from Chinese competitors like BYD and Xiaomi. Approximately 13% 0f analysts suggest a Sell rating, however 44% maintain Buy consensus.
Technical outlook:
Stock have been on descending channel momentum for couple of months, trending on lower highs and lower lows. few days ago price broke above the resistance trendline at $378-$380 levels, moving as high as $409-$410 for the first in while now. price is currently having a pullback of breakout, as we anticipate buy continuation.
Key points:
More bullish confirmation at this point, triggers a buy position, aiming for $420.67 as next potential bullish.
Thanks for reading.

TSLA $570 target on the WEEKLY chart has remained in an uptrend!TSLA on the WEEKLY chart uptrend is intact. Infact it is forming ANOTHER bullish wedge, this time, on the WEEKLY chart. If this breakouts $570 is the target. The issue however is the weekly chart takes longer to form, so this likely wont take place this week or perhaps the next 5 weeks or more, but that is the ultimate direction provided the daily 200 sma holds ($398.87)

TSLA — Nested Bullish Structure Still IntactHTF bias remains bullish.
The higher-timeframe C target is still open. That’s the anchor.
Key update:
The purple sequence reached its C .
Price then pulled back to its WCL and broke C again .
That behavior created a new bullish sequence (blue) nested inside the larger one.
So now we have:
A new C target (blue)
A new BC zone (blue)
Plus the prior BC zone still valid
In other words: two BC zones , same directional bias.
Expectation:
Price may mitigate one of the BC zones and continue
Or skip them entirely and push straight to C
BC is opportunity, not a requirement.
Invalidation is strict:
If price breaks B by even one pip , the active sequence fails.
Until then, upside remains the path of least resistance.
Structure > narratives.
Not financial advice.

Tesla vs QQQ: When the Cult Stock Becomes Just Another ComponentTesla is sliding in premarket trading following its Q1 2026 earnings call, even after reporting a solid beat — revenue of $22.39B (+15.8% YoY) and EPS of $0.41 vs. $0.36 estimated.
Over an early 2020s, Tesla dramatically outperformed the broader Nasdaq 100, turning every minor dip into a buying opportunity and every bear into a meme.
But the TSLA/QQQ ratio chart now tells a different story: structural mean reversion is replacing the old parabolic outperformance. Instead of leading the tech complex, Tesla is increasingly trading like a high‑beta factor of QQQ, not an uncorrelated “disruptor.”
This publication dissects the TSLA/QQQ ratio as a clean way to strip out market noise and focus on relative strength, regime shifts, and failed breakouts.
This piece argues that the golden age of effortless Tesla alpha is highly likely over, replaced by a grind of sideways or declining relative performance punctuated by short‑covering rallies.
Using the ratio as the primary chart, we’ll frame Tesla as a tactical trading vehicle rather than a long‑term benchmark killer.
Our @PandorraResearch chart outlines key technical levels on the ratio that separate “just another bounce” from a true leadership comeback, and proposes concrete pairs-trading ideas (long/short TSLA vs QQQ) for both bulls and bears looking to exploit this fading cult premium.
Summary shift
Tesla has shifted from alpha generator to levered QQQ proxy, as seen in the TSLA/QQQ ratio behavior.
This chart points to analyze regime change in relative strength, technical levels, and trade structures built around the ratio.
--
Best wishes,
@PandorraResearch Team

TSLA TRENDING HIGHER / ACTION-REACTION LINESVery old school method created by Alan Andrews to anticipate the end of a reaction that is opposed to the previous action. In this case the action was a cycle of buying and the opposite reaction a pullback to the downside.
What I did was draw a simple trend line and only after did I notice it cut perfectly through the middle of all the price action, so I thought it could work as a Center Line.Then I placed the same line at a high as an action line, measured the distance between the center line and the action line, and finally placed the same line on the opposite side, the lower side, as a reaction line.
Price, as you can see, reacted perfectly to the upside. I did not anticipate this, I want to be clear, I am marking it now after the fact. But it is crystal clear that a bearish trend line has just been broken to the upside and that price is now heading toward the center line with high probability.
Depending on personal preference, one can enter on the breakout or wait for a pullback. I will wait for a pullback, either to the recently broken bearish line or to the reaction line, which would be my ideal entry, with a stop below the recently created prior low.

Long trade
🧾 Trade Details
Pair: Tesla (TSLA)
Direction: Buyside
Date: Fri 10th April 2026
Time: 2:30 PM (NY Session)
🎯 Execution Levels
Entry: 349.08
Take Profit: 412.01 (+18.02%)
Stop Loss: 343.26 (-1.66%)
Risk-to-Reward: 10.81R
🧠 Context & Thesis (Institutional Logic)
Liquidity Sweep: Sell-side liquidity below the 350 zone was taken
Displacement: Strong bullish displacement confirmed institutional intent
FVG Reclaim: Price returned to the imbalance and respected demand
Structure Shift: Transition from short-term bearish flow → bullish intraday structure
Entry Logic: Pullback into demand / FVG alignment
📊 Confluence Factors
✔️ ICT Liquidity Sweep (SSL taken)
✔️ Bullish Market Structure Shift (MSS)
✔️ Fair Value Gap (FVG) support
✔️ Demand zone alignment (HTF + LTF overlap)
✔️ NY Session volatility expansion
⚠️ Invalidation Logic
Break and hold below 343.26
→ Confirms failed displacement and continuation lower
🧭 Trade Classification
Model: ICT / SMC — Liquidity Sweep + Displacement
Type: Intraday → Short-Term Swing
Session Bias: NY Expansion

TESLA BULLISH , WILL IT CONTINUE MARKING UP?This is a continuation my prev thesis about Tesla
Kindly refer link attached
I was too early in my prev trade.
This time, my POE is from the context of Test Of Spring
In which, looks succesful at the moment.
Risk is managed in the present, not in hindsight.
I have lots of buffer to withstand the possible GAP DOWN IN UPCOMING EARNING RELEASE.

Tesla Chinchilla Bounce UptrendTesla or TSLA stock is explained here in a storytelling mode, the analysis and chart pattern. You can see in this pattern, a chinchilla. You will notice the horizontal trend line, the tail, his ears, his eyes and his paws. And, he is looking upwards, since his ears and eyes are the same horizontal level.
The key is his paws before the bounce or upward trend. It is impossible for his paws to go below the horizontal trend line, or this theory/analysis is incorrect. A chinchilla jumps up with his hind legs, not his paws. So, his paws may go down (or the stock may pullback) yet it cannot go below the horizontal line, or this trade will fail. Trade fails < 295
This chinchilla position is in the 'ready' position to spring or bounce up.
Optimistically, I really don't see TSLA falling below 354.64
Target 1: 430 (base of his eyes)
Target 2: 468 (tip of his ears)
Target 3: > 489+, ready to bounce
Thank you for letting me share this story, stock and what I predict. This is not financial advice, and I do believe in this company and their products/services.

Trade Plan: TSLATrade Plan: TSLA
• Direction: Long
• Entry: 374.90
• Stop Loss:360.00
• TP1: 425.00
• TP2: 480.80
• TP3: 550.00
Take partial profits at each target, then trail stop to protect profits.
Not financial advice.

TSLAFinally caught a bid last week after down only since last December. I believe it's going to put in another leg higher towards 420 with earnings today.
