Tesla remains weak below the $400 levelIt has been a difficult trading week for Tesla, as the stock has posted a decline of more than 3.00% on average over the last three sessions. This move came after the company’s earnings release.
Despite reporting earnings per share of 41 cents versus 37 expected, and revenue of $22.39 billion compared to $22.64 billion projected, the main catalyst behind the selling pressure has been concerns about slowing demand and the need to lower prices to stabilize orders. These challenges have yet to be resolved and, for now, have weighed on market confidence in the short term. In this context, weakness could remain a key theme in the coming sessions.
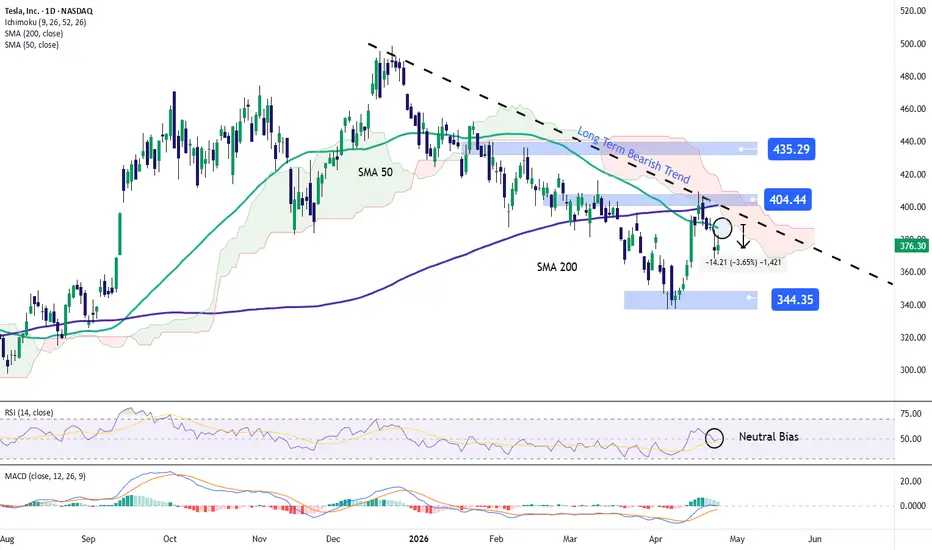
Downtrend remains intact: Recent price action in Tesla continues to respect a well-defined bearish trendline that has been in place since December 2025. So far, there has not been a strong enough buying move to challenge this structure, keeping it as the most relevant technical factor. As long as selling pressure remains in control, the extension of this trend could continue to gain relevance in the coming weeks.
RSI: The RSI indicator is currently hovering around the 50 level, reflecting a balance between buying and selling forces. If this dynamic persists, indecision could become more evident in price action.
MACD: A similar pattern can be observed in the MACD, where the histogram remains close to the zero level, indicating a balance in short-term moving average strength. This reinforces the idea of a neutral phase in the market.
Key levels to watch:
$435: A level of recent highs located above the current bearish trendline. A move toward this area could open the door to the formation of a new bullish trend in the coming weeks.
$400: A key psychological level that aligns with the bearish trendline and the 50 and 200-period moving averages. This is the most important barrier on the chart, and sustained moves above it could invalidate the downtrend and support a more dominant bullish bias.
$344: A level corresponding to the 2026 lows. A move toward this area would reinforce selling pressure and could extend the current bearish trend in the short term.
Written by Julian Pineda, CFA, CMT – Market Analyst
Teslaanalysis
Tesla vs QQQ: When the Cult Stock Becomes Just Another ComponentTesla is sliding in premarket trading following its Q1 2026 earnings call, even after reporting a solid beat — revenue of $22.39B (+15.8% YoY) and EPS of $0.41 vs. $0.36 estimated.
Over an early 2020s, Tesla dramatically outperformed the broader Nasdaq 100, turning every minor dip into a buying opportunity and every bear into a meme.
But the TSLA/QQQ ratio chart now tells a different story: structural mean reversion is replacing the old parabolic outperformance. Instead of leading the tech complex, Tesla is increasingly trading like a high‑beta factor of QQQ, not an uncorrelated “disruptor.”
This publication dissects the TSLA/QQQ ratio as a clean way to strip out market noise and focus on relative strength, regime shifts, and failed breakouts.
This piece argues that the golden age of effortless Tesla alpha is highly likely over, replaced by a grind of sideways or declining relative performance punctuated by short‑covering rallies.
Using the ratio as the primary chart, we’ll frame Tesla as a tactical trading vehicle rather than a long‑term benchmark killer.
Our @PandorraResearch chart outlines key technical levels on the ratio that separate “just another bounce” from a true leadership comeback, and proposes concrete pairs-trading ideas (long/short TSLA vs QQQ) for both bulls and bears looking to exploit this fading cult premium.
Summary shift
Tesla has shifted from alpha generator to levered QQQ proxy, as seen in the TSLA/QQQ ratio behavior.
This chart points to analyze regime change in relative strength, technical levels, and trade structures built around the ratio.
--
Best wishes,
@PandorraResearch Team

Tesla (TSLA) -> Daily Timeframe AnalysisHi!
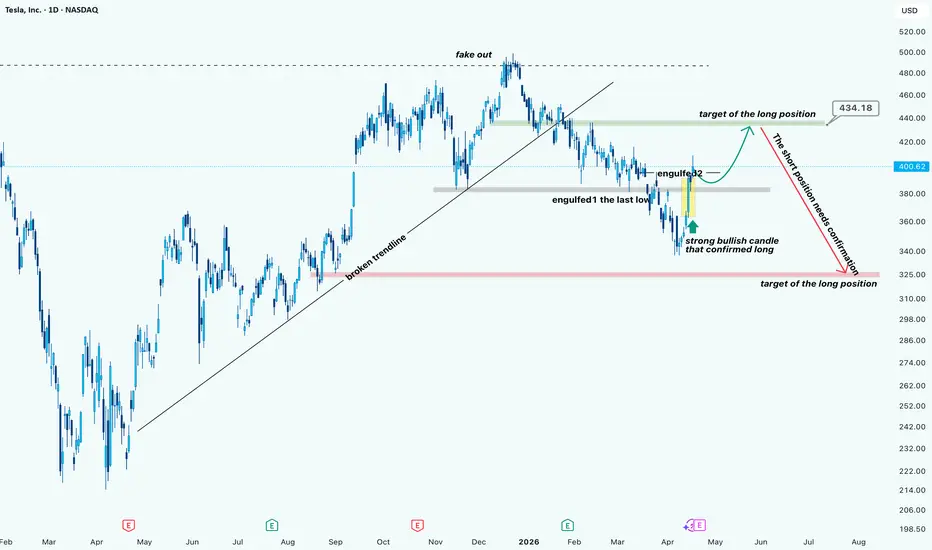
After the breakdown of the ascending trendline, the structure clearly shifted from bullish continuation into a corrective phase. The move above the previous highs turned into a fake breakout, which was followed by consistent lower highs.
Recently, price swept the previous low and formed a strong bullish reaction. The key detail here is the engulfing structure:
First, the market took liquidity below the last low
Then printed a strong bullish engulfing candle, confirming buyer presence
This is not random; it’s a liquidity grab + demand reaction, which often leads to a short-term bullish push.
Current Scenario
As long as price holds above the recent demand zone, the bias remains bullish in the short term.
The expected move is a push toward the green supply area around $434.
What happens at $434?
That’s the important part.
This move up is not a confirmed trend reversal, yet it’s more likely a corrective rally inside a broader bearish structure.
At the $430–$435 zone, we should expect:
Weakening bullish momentum
Possible rejection
Or distribution
👉 From there, a potential drop can happen, but:
Short positions require confirmation (rejection, lower high, bearish engulfing, etc.)
Alternative Scenario
If price breaks and holds above $434, then the structure shifts again, and the bearish idea becomes invalid, opening room for continuation higher.
Tesla - Still heading for new all time highs!👻Tesla ( NASDAQ:TSLA ) still remains bullish:
🔎Analysis summary:
Tesla clearly remains in a very bullish market on the higher timeframe. And with the recent correction of about -25%, it is now approaching a clear support trendline. Therefore it remains totally possible that Tesla is heading for new all time highs during this year.
📝Levels to watch:
$350 and $400
SwingTraderPhil
SwingTrading.Simplified. | Investing.Simplified. | #LONGTERMVISION

Tesla - We will see new all time highs!🔥Tesla ( NASDAQ:TSLA ) will create new highs soon:
🔎Analysis summary:
Tesla recently created another bullish break and retest. But this time Tesla broke above the previous all time high resistance, indicating clear buying pressure. We just have to see bullish confirmation in the near future and Tesla will head for new all time highs.
📝Levels to watch:
$400
SwingTraderPhil
SwingTrading.Simplified. | Investing.Simplified. | #LONGTERMVISION

Expecting a pullback on Tesla for the coming 4th wave Shown is my HTF Elliott wave count on Tesla showing an impulse building to the upside. Wave 3 looks finished with 5 waves up and i have plotted the fibonacci time and price targets for the coming wave 4. This thing could go sideways for 4 years or it could drop 50% of its prior swing and chop upward for a few years suckering all the early traders in only to dump again to finish the wave 4. Only time and more price action will tell us the path, but its usually the one with the most victims xD

Tesla hits both my support & resistance targets. Now what?On Tues March 24th I suggested that Tesla would rise 9-11%, then retrace to my red T1. Tesla did rise 8.7% & has now retraced into my red T1. Since these support and resistance targets played out as anticipated, we now know where to invalidate our bullish or bearish thesis. Above resistance (green T1)=bullish...below support (red line)=bearish (as indicated on the chart).
Here is Tuesday's (1 day timeframe) chart indicating these same targets as today's (1 hr) chart. I used the 1 hourly chart today to show more detail.
May the trends be with you.

Tesla's bounce target this weekTesla is still in a downtrend. It will need to reverse the trend on a higher timeframe soon if it is to invalidate my bearish thesis...that there is still at least one leg lower (over the next month or 2). For now we monitor price action to determine invalidation levels. We are currently in the anticipated bounce to my green box (total of 4-7 days up) and then a retracement to my red box (total of 4-7 days down).
May the trends be with you.

Tesla Inc. (TSLA) | Bullish Technical Outlook🚗⚡ TSLA Market Profit Playbook – Bullish Swing Strategy
Asset: Tesla, Inc. (TSLA) - NASDAQ Stock Exchange
Current Price: $445.01 (as of Jan 12, 2026)
52-Week Range: $214.25 - $498.83
📊 MARKET SNAPSHOT – REAL-TIME FEED
Live Price Action:
Current trading at $442.83 with intraday range $438.00 - $444.50
All-time high closing price was $489.88 on December 16, 2025
Average daily volume: 60.35M shares
Market cap: $1.48 trillion
Recent Performance:
Stock gained 19.18% over past 4 weeks as of Jan 6, 2026
Year-over-year performance: +13.27%
🎯 TRADING PLAN: BULLISH SETUP
📍 Entry Strategy: Layered Limit Orders (Thief Method)
This strategy uses multiple buy limit orders to scale into positions at favorable levels:
Layer 1: $430.00
Layer 2: $440.00
Layer 3: $450.00
Note: You can add additional layers based on your risk appetite and capital allocation strategy. This scaling approach reduces average entry cost and manages downside risk.
🎯 Take Profit Target:
Primary TP: $490.00 (near recent all-time high resistance zone)
Reasoning: Price approaching the $498.83 52-week high creates a strong resistance zone where profit-taking is expected. The $490 level acts as a police barricade (strong resistance + potential trap zone).
⚠️ Disclaimer: This is MY target level. You have the freedom to set your own profit targets based on your trading style and risk management. Take profits when YOU'RE comfortable – it's your capital, your decision.
🛑 Stop Loss:
Thief SL: $420.00
Risk Management: Positioned below recent support to prevent minor volatility from triggering exits
⚠️ Disclaimer: This is MY stop-loss level. You're encouraged to set your own stop-loss based on your risk tolerance and account size. Protect your capital at YOUR chosen level.
📈 TECHNICAL ANALYSIS
Chart Structure:
Price currently consolidating in mid-channel after pullback from $498.83 high
Stock lies in middle of wide, weak rising trend in short term with further rise signaled
Support from accumulated volume at $429.24 may hold as buying opportunity
Average True Range: 3.35% daily volatility (medium risk profile)
Key Levels:
Support: $429-430 (volume accumulation zone)
Resistance: $490-498 (police barricade resistance cluster)
🌍 FUNDAMENTAL & ECONOMIC FACTORS
Upcoming Catalysts:
Q4 2025 Earnings Release: Wednesday, January 28, 2026 (after market close)
Expected EPS: $0.45 per share
Q4 deliveries of 418,227 vehicles announced (down 15% YoY)
Delivery Performance:
Full year 2025 deliveries: 1.64M units (down 8.6% from 1.79M in 2024)
Energy storage deployments reached record 14.2 GWh in Q4
Industry Headwinds:
Global EV sales growth expected to slow to 12% in 2026 vs 23% in 2025
Federal EV tax credit expired September 2025, impacting affordability
BYD overtook Tesla as world's largest EV seller with 2.26M units sold in 2025
Technical Sentiment:
Analyst consensus: 20 buy, 10 sell ratings (Neutral overall)
Average 12-month price target: $403.32 (High: $600, Low: $120)
🔗 CORRELATED PAIRS TO WATCH
EV Sector Correlation:
NASDAQ:RIVN (Rivian Automotive) - Direct EV competitor
NASDAQ:LCID (Lucid Group) - Luxury EV segment
NYSE:NIO (NIO Inc.) - Chinese EV manufacturer
Tech/AI Correlation:
NASDAQ:NVDA (Nvidia) - AI chip supplier for Tesla's FSD technology
NASDAQ:MSFT (Microsoft) - Cloud/AI infrastructure plays
NASDAQ:META (Meta Platforms) - Nasdaq-100 stocks historically rise in January 70% of time with 2.5% average return
Key Relationship: Tesla's performance increasingly tied to its AI/autonomous driving narrative rather than pure automotive sales. Monitor semiconductor and tech sector momentum as leading indicators.
⚠️ RISK FACTORS
Earnings Volatility: Q4 earnings could create structural shift if margins compress or delivery guidance disappoints
Competition: Intense competition from Chinese manufacturers, particularly BYD's 28% growth rate
Political Risk: Musk's political activities have triggered consumer backlash in Europe and U.S.
Valuation Concerns: Director James Murdoch sold 60,000 shares at $445.40 on January 2, 2026
🎪 TRADING WISDOM: THE THIEF'S PLAYBOOK
This setup represents a swing trade opportunity in a consolidating market leader. The layered entry approach (Thief Strategy) provides:
✅ Cost averaging benefits
✅ Reduced timing risk
✅ Flexibility to scale position size
Remember: Markets reward patience and discipline. The goal isn't to catch the perfect bottom – it's to position yourself in the profit zone and manage risk effectively.
✨ "If you find value in my analysis, a 👍 and 🚀 boost is much appreciated — it helps me share more setups with the community!"

Tesla - Not the final breakout yet!🎯Tesla ( NASDAQ:TSLA ) is still in breakout mode:
🔎Analysis summary:
Just recently, Tesla broke out of a significant bullish triangle pattern. But looking at the higher timeframe, this triangle breakout is still not really confirmed yet. Instead, Tesla has to create new all time highs soon in order to start its next parabolic breakout bullrun.
📝Levels to watch:
$400
SwingTraderPhil
SwingTrading.Simplified. | Investing.Simplified. | #LONGTERMVISION

Tesla: Is this what happens next?Fractals work until they dont. But so far it's hard not to consider this a map. The question is will Tesla fill its gap at $470-$475 and then drop lower to complete the pattern? Either way, my base case is Tesla is eventually going lower (in the mid term), based on yesterday's Tesla chart suggesting that Tesla is in a Wyckoff distribution (top). I hope I'm wrong.
During midterm years, historically the first week in March is bullish for the markets, followed by a decline into the summer...which would coincide with the fractal pattern.
May the trends be with you.

Is Tesla entering a bear market (Wyckoff distribution topped)?On Nov 7th 2025 Tesla was $433 and I suggested that Tesla would drop into my buy zone (below $400) and then hit an all time high. After Tesla did in fact drop into my buy zone, it then pumped 30% to an ATH as anticipated. Congrats to all that took that trade and are in significant profit.
Now that Telsa has hit an ATH and retraced...I now unfortunately believe Tesla may have completed it's Wyckoff distribution.
Has Tesla now entered a bear market and going much lower? I hope I'm wrong.
Trade safe and my the trends be with you.

TSLA Risk-Off Structure: Technical Weakness Developing🦹♂️ TSLA — THE HEIST IS ON! Bearish Profit Playbook | Swing & Day Trade 💰📉
"We don't predict markets. We rob them." — The Thief OG Manifesto
🎯 THE MISSION BRIEF
Asset: NASDAQ: TSLA — Tesla, Inc.
Bias: 🔴 BEARISH — The bears are circling the garage!
Style: ⚡ Swing Trade / Day Trade
Current Price (Feb 18, 2026): ~$410 — down ~16% from ATH $489.88 (Dec 2025)
🔫 ENTRY ZONE — Any Price Level (Multi-Entry)
No single magic entry here. Whether you catch it at current levels or on a minor bounce, the bearish structure holds. Scale in smart, use your own risk management — this is YOUR operation.
💡 Enter on confirmed breakdown candles — bearish engulfing, shooting star, or break-of-structure on lower timeframes. Don't chase. Let price come to you.
🎯 TARGET — $370.00
🔹 Strong moving average support converges near this level — a natural price magnet on the way down.
🔹 RSI approaching oversold on higher timeframes — a reaction zone is likely here.
🔹 Bear trap risk near $370 — smart money may defend it aggressively.
🔹 Cross-asset correlations confirm bearish momentum (see pairs section below).
⚠️ Hit your target, take your loot, and vanish. $370 is the exit door — don't miss it!
🛑 STOP LOSS — $450.00
Place SL at $450.00 only after your entry is confirmed with a breakdown signal. Don't pre-set it before confirmation.
🚨 SL placement is YOUR call. Know your risk tolerance, size your position accordingly. The SL is the fire exit — know where it is, but don't stand next to it.
📊 TECHNICAL SNAPSHOT
📉 Trend is bearish — price declining from ATH $489.88 (Dec 2025), lower highs forming.
📊 RSI momentum is weakening on the daily — sellers dominating bounces.
📈 Key MAs converging near $370 as the primary target support zone.
📦 Volume is declining on relief rallies — classic distribution pattern.
🪤 Bear trap risk near target — exit quickly, don't overstay the welcome.
Key levels: 🔴 Resistance $435–$450 (SL region) · 🟡 Mid $395–$400 (bounce watch) · 🟢 Target $370.00
🏦 FUNDAMENTAL ANALYSIS
🔻 EV demand is slowing — BYD and Xiaomi are eating Tesla's lunch, especially in China where Xiaomi's EV outsold Model Y (Feb 2026).
🔻 Operating income at $1.41B reflects ongoing margin pressure — 6th year-over-year decline in 8 quarters.
🔻 Forward P/E remains elevated vs. auto peers — heavy future growth (Cybercab, Optimus) is priced in but undelivered.
🔻 Elon Musk's DOGE involvement creates headline risk and brand damage in key European markets (EU sales declining).
🔻 Tesla's Austin Robotaxis logged 14 reported incidents since launch (June 2025) — regulatory scrutiny rising.
🔻 27-analyst consensus (Feb 17, 2026): HOLD rating, avg price target ~$393–$396 — below current price, implying downside bias.
🟡 Bullish counterpoint — FSD subscriptions at 1.1M+ active users, energy segment growing. Know your enemy before the heist.
🌍 MACRO & ECONOMIC FACTORS
🇺🇸 US tariff uncertainty around EV credits adds policy risk.
📊 Elevated Fed rates keep pressure on high-valuation growth stocks like TSLA.
🛢️ Lower energy prices reduce consumer urgency to go electric.
🌐 Chinese EV makers are gaining global market share aggressively.
🏭 Potential rollback of EV tax credit advantages hurts Tesla's pricing edge.
🔗 CORRELATED PAIRS TO WATCH
Watch these in USD — if they align bearish, your TSLA thesis gets stronger:
🚗 RIVN (Rivian) — EV sector peer. Weakness = sector-wide selloff confirmed.
⚡ NIO (NIO Inc.) — China EV signal. Bearish = global EV demand declining.
📊 QQQ (NASDAQ 100 ETF) — Tech correlation. QQQ breakdown accelerates TSLA drop.
🔋 LIT (Lithium ETF) — EV materials. Declining = demand slowdown signal.
📈 SPY (S&P 500 ETF) — Broad risk-off amplifies the move.
💵 DXY (US Dollar Index) — Rising DXY = headwind for growth stocks.
🪙 ARKK (ARK Innovation ETF) — Growth/innovation proxy. ARKK weak = TSLA weak.
💡 Confluence signal: QQQ + ARKK both falling + DXY rising = TSLA bearish momentum on steroids. ✅
📋 TRADE SUMMARY
🦹 TSLA THIEF TRADE — BEARISH EDITION
━━━━━━━━━━━━━━━━━━━━━━━━━━━━━━━━
📌 Asset : TSLA (Tesla, Inc.)
📅 Date : Feb 18, 2026
💰 Entry : Any Level (Multi-Entry)
🎯 Target : $370.00
🛑 Stop Loss : $450.00
📊 Bias : 🔴 BEARISH
⏱️ Style : Swing / Day Trade
━━━━━━━━━━━━━━━━━━━━━━━━━━━━━━━━
🎭 THIEF OG NOTE
🎩 Dear Ladies & Gentlemen — Fellow Thief OGs,
I am NOT recommending you follow only my TP ($370) or SL ($450) blindly. These are coordinates on the heist map — your execution is your own mission. Make money → Take money → Walk away clean. That's the Thief Code. 💼
Trade at your own risk. Never risk more than you can afford to lose.
✨ "If you find value in my analysis, a 👍 and 🚀 boost is much appreciated — it helps me share more setups with the community!"
📜 Disclaimer: This is a Thief Style Trading Strategy — shared purely for educational and entertainment purposes only. This is NOT financial advice. All trade ideas are for informational use only. Past performance does not guarantee future results. Always conduct your own due diligence. This is just for fun. 🦹♂️💰
Published by: The Thief OG Trader | TradingView Ideas | Feb 2026

Tesla: Struggling to Gain MomentumTesla’s share price has recently been sluggish and, despite several attempts, has struggled to gain meaningful upward momentum. Our primary expectation is that the stock will regain upward pressure and set a new high for green wave . Only after this move do we anticipate a corrective phase that should push price below support at $367.72. Ultimately, we expect the corresponding low to form near $297.83. In our alternative scenario, Tesla may have already completed green wave alt. with the most recent significant peak. In this case, we would expect direct sell-offs below support at $367.72 (probability: 33%).

What's happening at Tesla!!I think Tesla should reach a price range of about $50 cheaper than the current price along the box drawn in the chart!

Tesla (TSLA) Shares Jump After Musk’s Davos RemarksTesla (TSLA) Shares Jump After Musk’s Davos Remarks
This year’s Davos Forum has drawn attention not only because of developments around Greenland and Donald Trump’s proposed Peace Council, but also due to the appearance of Elon Musk, who has previously criticised the event. The world’s richest man made bold statements regarding Tesla’s Optimus humanoid robots, which became a key talking point.
According to Musk’s vision:
→ Tesla plans to begin selling Optimus robots to the general public by the end of 2027, with an estimated price of $20,000–$30,000, making them cheaper than a car.
→ In the long term, Optimus robots could account for up to 80% of Tesla’s total company value, while the robotics market — where robots may eventually outnumber humans — could generate trillions of dollars in market capitalisation.
These comments acted as strong bullish catalysts, and Tesla (TSLA) shares rose by more than 4% yesterday.
Technical View on TSLA
When analysing Tesla’s share price on 30 December, we:
→ updated the ascending channel that has been in place since summer 2025;
→ highlighted signs of market weakness;
→ suggested that TSLA could decline towards the lower boundary of the rising channel.
Indeed, the lower boundary was reached as early as 8 January. More recent chart data suggests that bulls are now regaining control:
→ a bullish engulfing pattern has formed (marked by the arrow) just below the channel’s lower boundary;
→ yesterday’s session opened with a bullish gap and closed near the highs;
→ trading volumes have been increasing on bullish candles, indicating strengthening demand.
As a result, it appears reasonable to expect that bulls may succeed in pushing TSLA back into the main ascending channel, potentially resuming the move towards the psychological $500 level. Whether this scenario plays out will largely depend on the outcome of Tesla’s quarterly earnings report, scheduled for release on 28 January.
This article represents the opinion of the Companies operating under the FXOpen brand only. It is not to be construed as an offer, solicitation, or recommendation with respect to products and services provided by the Companies operating under the FXOpen brand, nor is it to be considered financial advice.

Tesla - The next bullrun is coming!🚗Tesla ( NASDAQ:TSLA ) is clearly breaking out:
🔎Analysis summary:
In mid 2025, Tesla perfectly retested a major confluence of support. After Tesla then created bullish confirmation, the recent strong rally was totally expected. And with the current triangle breakout, Tesla is just starting its next major parabolic rally much higher.
📝Levels to watch:
$400 and $600
SwingTraderPhil
SwingTrading.Simplified. | Investing.Simplified. | #LONGTERMVISION

Tesla (TSLA) Shares Fail to Hold at an All-Time HighTesla (TSLA) Shares Fail to Hold at an All-Time High
Yesterday, Tesla (TSLA) shares declined by more than 3%, with the following developments observed:
→ the session opened with a bearish gap;
→ the price fell nearly 8% from the all-time high recorded on 22 December;
→ the psychological $500 level has yet to be overcome.
The fundamental trigger for the decline was news that Tesla’s South Korean battery supplier has significantly reduced the value of its contract. The market may have interpreted this as a signal of potential weakness in future vehicle sales.
In addition, the rally in TSLA shares since the beginning of December may have encouraged long-position holders to take profit.
When analysing TSLA price action on 17 December, we:
→ identified an ascending channel that has been in place since the summer;
→ highlighted the strength of the breakout above resistance near the $465 level (accompanied by a bullish gap) and suggested that this area could act as support.
However, yesterday’s sell-off pushed the price below the aforementioned gap, thereby invalidating this support. Moreover:
→ the December upward trajectory (shown in orange) has been broken;
→ the stock has fallen below the median of the ascending channel.
In light of the above, we could assume that bearish momentum currently dominates, and TSLA shares may move towards the lower boundary of the ascending channel in the short term.
This article represents the opinion of the Companies operating under the FXOpen brand only. It is not to be construed as an offer, solicitation, or recommendation with respect to products and services provided by the Companies operating under the FXOpen brand, nor is it to be considered financial advice.

Tesla (TSLA) Shares Close at a Record HighTesla (TSLA) Shares Close at a Record High
On Tuesday, 16 December 2025, Tesla shares closed at a new all-time high, breaking above the $488 level.
As a result, TSLA:
→ surpassed its December 2024 peak;
→ is up by roughly 125% from this year’s lows;
→ made Elon Musk the first person in the world whose net worth has exceeded $600 billion.
Why are TSLA shares rising?
Elon Musk has officially confirmed that Tesla has begun testing driverless robotaxis in Austin, Texas, without safety monitors in the vehicle. This marks an important step towards the large-scale deployment of the Robotaxi concept.
Despite a decline in electric vehicle sales in November (following the removal of tax incentives by the new US administration), TSLA shares continue to rise as market participants are pricing in Tesla’s potential dominance in artificial intelligence and autonomous transport — a development that could unlock fundamentally new revenue streams for the company.
Supporting this outlook, several investment banks have raised their price targets for TSLA. For instance, Mizuho analysts lifted their target to $530.
Technical perspective
When analysing TSLA on 12 November, we:
→ identified an ascending channel and a support zone between $360 and $400;
→ suggested that the previous high was limiting bullish momentum, with the market entering a consolidation phase.
Since then (as shown by the blue arrow), TSLA shares:
→ broke out of the consolidation zone;
→ found support near the lower boundary of the ascending channel;
→ resumed their upward trend.
It is worth noting that trading volumes in early December were relatively low — which can be interpreted as a lack of selling pressure. However, the subsequent move into the upper half of the channel was accompanied by a surge in trading activity and the formation of a bullish gap (marked by the black arrow). This signals strong demand, with buyers willing to pay higher prices for a high-quality stock.
Looking ahead, it is possible that:
→ the former resistance at $465 will turn into a new support zone;
→ the current bullish impulse could drive attempts to challenge the psychological $500 level.
This article represents the opinion of the Companies operating under the FXOpen brand only. It is not to be construed as an offer, solicitation, or recommendation with respect to products and services provided by the Companies operating under the FXOpen brand, nor is it to be considered financial advice.

Tesla to Invest Nearly $1.2 billion Into Battery cell productionTesla, Inc. (NASDAQ: NASDAQ:TSLA ) announced plans to invest nearly €1 billion ($1.2 billion) into battery cell production at its Gruenheide gigafactory in Germany, with output expected to reach up to 8 gigawatt hours annually starting in 2027. The move strengthens Tesla’s vertical integration strategy, allowing battery cells and vehicles to be produced at a single European site. Management highlighted that this structure improves supply chain resilience and positions Tesla more competitively against China and the U.S., despite acknowledging that large-scale battery production remains challenging in Europe due to cost pressures.
Fundamentally, the investment signals Tesla’s long-term commitment to Europe, even as its regional market share has come under pressure. By localizing more of the battery value chain, Tesla aims to reduce reliance on imports, control costs over time, and improve margins once scale is achieved. While near-term financial impact is limited, the strategy supports Tesla’s broader push into energy efficiency, battery innovation, and manufacturing autonomy.
Technically, the chart shows NASDAQ:TSLA trading within a long-term rising channel that has guided price action since early 2023. Shares recently surged toward the upper boundary of this channel near the $490–$500 zone, an area that aligns with prior highs and visible resistance.
The strong rally has pushed price well above the 9-period moving average, signaling extended conditions in the short term. A rejection from the channel top could trigger a pullback toward the $430–$450 support region, where buyers previously stepped in. Conversely, a decisive breakout above channel resistance would open the door toward the $550–$600 range, as projected by the measured move on the chart.
Overall, NASDAQ:TSLA remains structurally bullish, but near-term price action hinges on whether buyers can absorb supply at this critical resistance level.

Is Tesla Setting Up for a Rebound? Key Entry Levels Inside🎯 TSLA: The "Thief Strategy" Playbook | Swing/Day Trade Setup 📈
🔥 Quick Overview
Asset: Tesla, Inc. (TSLA)
Bias: 🐂 BULLISH
Strategy Type: Thief Layering Entry Method
Risk Level: Medium-High (Swing/Day Trade)
💰 The "Thief" Entry Strategy Explained
The "Thief Strategy" uses multiple limit orders (layering method) to accumulate position at different price levels. Think of it like setting traps at various floors of a building—you catch opportunities wherever price decides to visit! 🎣
📊 Entry Zones (Layer Your Orders):
Layer 1: $430.00
Layer 2: $435.00
Layer 3: $440.00
💡 You can add more layers based on your own risk appetite and account size. The beauty of layering? You average your entry and reduce timing risk!
🛡️ Stop Loss (SL):
Thief SL: $415.00
⚠️ Important Note: This is MY stop loss level based on the Thief Strategy framework. You're the captain of your own ship! 🚢 Adjust your SL based on YOUR risk tolerance and account management rules. Trade at your own risk—make money, take money, manage wisely!
🎯 Target (TP):
Primary Target: $490.00
🚨 Why $490? This zone represents a confluence of:
Strong resistance area
Potential overbought conditions
Historical trap zone where bulls get exhausted
📢 Thief OG's Reminder: I'm NOT saying you MUST take profit only at my TP level. If you see profits that make you smile, SECURE THEM! 💵 The market gives, and the market takes. Be greedy when you can, be smart always.
🔍 Technical Analysis Breakdown
Tesla is showing bullish momentum structure with potential for continuation toward the $490 resistance zone. The layering strategy allows us to build position as price potentially dips into demand zones before the next leg up.
Key Technical Levels:
Support Zone: $430-$440 (Our entry layers)
Invalidation: Below $415 (Stop loss)
Resistance Target: $490
📌 Related Pairs to Watch (Correlation Play)
Understanding correlated assets helps confirm your thesis:
AMEX:SPY (S&P 500 ETF)
TSLA often moves with broader market sentiment
Watch SPY for overall risk-on/risk-off environment
NASDAQ:QQQ (Nasdaq 100 ETF)
Tech-heavy index where TSLA is a major component
Strong correlation with TSLA price action
NASDAQ:NVDA (NVIDIA)
Both are high-beta tech growth stocks
Often move together during risk appetite shifts
TVC:DXY (US Dollar Index)
Inverse correlation: Strong dollar = pressure on growth stocks like TSLA
Weak dollar = tailwind for equities
💡 Key Point: If SPY/QQQ are bullish + DXY weakening = Strong confirmation for TSLA upside!
⚡ Trading Tips for Thief OG's
Don't FOMO — Let price come to your layers
Manage position size — Each layer should be equal weight
Trail your stop — Once profitable, protect gains
Watch volume — Confirm breakouts with volume spikes
Stay flexible — Market conditions change; so should you!
🎬 Final Words
This setup is all about patience, precision, and profit extraction! 🎯 The Thief Strategy isn't about stealing from the market—it's about being SMART and setting yourself up for success with calculated entries.
Remember: The best trades are the ones where you're prepared, not scared! 😎
✨ If you find value in my analysis, a 👍 and 🚀 boost is much appreciated — it helps me share more setups with the community!
#TSLA #TeslaStock #SwingTrading #DayTrading #ThiefStrategy #LayeringStrategy #StockMarket #TradingIdeas #TechnicalAnalysis #BullishSetup #TradingStrategy #RiskManagement #StockTrading #MarketAnalysis #TradingCommunity

Tesla - The triangle is still valid!🎀Tesla ( NASDAQ:TSLA ) can still confirm the breakout:
🔎Analysis summary:
Just two months ago, Tesla perfectly broke out of the major ascending triangle pattern. In the meantime we just witnessed a major consolidation at the all time high. Quite likely that Tesla will soon confirm the breakout, launching another parabolic rally from here.
📝Levels to watch:
$400
SwingTraderPhil
SwingTrading.Simplified. | Investing.Simplified. | #LONGTERMVISION

Tesla: A overview of itHi!
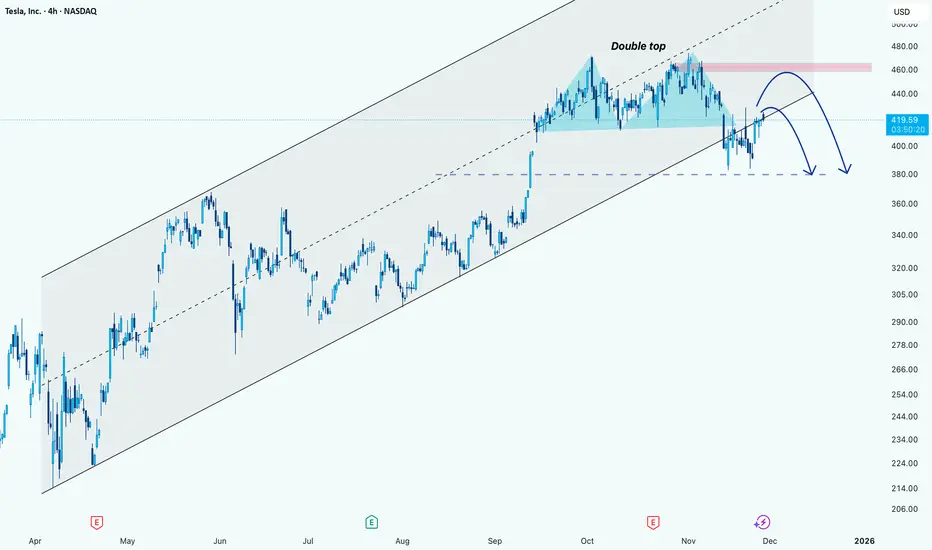
Trend Analysis:
TSLA has been trading in an ascending channel for several months, with higher highs and higher lows visible since April.
The recent price action broke above the midline of the channel but is currently consolidating near the $420-$425 area.
Pattern Formation:
A Double Top pattern near the $460 level formed.
This pattern signals a potential reversal if the price fails to break above the resistance zone (marked in pink).
The neckline of this double top appears around $400, which is also a key support zone.
Potential Price Action:
Short-term rebound:
TSLA could retest the resistance zone near $455-$460.
If it fails to break this area convincingly, the double top pattern could trigger a reversal.
Medium-term correction:
If the reversal occurs at the resistance zone, price may fall toward the neckline/support area near $380.
This aligns with the lower boundary of the channel and previous support levels.