Tesla remains weak below the $400 levelIt has been a difficult trading week for Tesla, as the stock has posted a decline of more than 3.00% on average over the last three sessions. This move came after the company’s earnings release.
Despite reporting earnings per share of 41 cents versus 37 expected, and revenue of $22.39 billion compared to $22.64 billion projected, the main catalyst behind the selling pressure has been concerns about slowing demand and the need to lower prices to stabilize orders. These challenges have yet to be resolved and, for now, have weighed on market confidence in the short term. In this context, weakness could remain a key theme in the coming sessions.
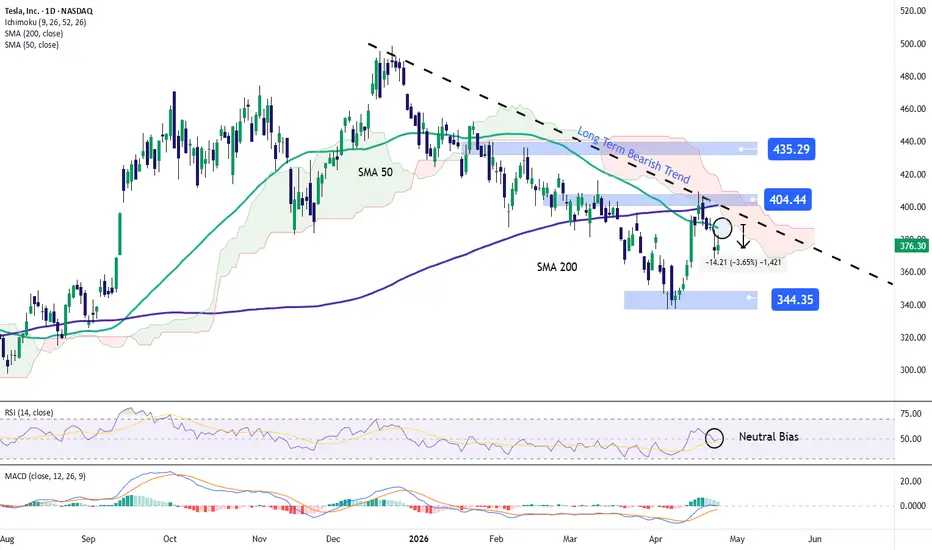
Downtrend remains intact: Recent price action in Tesla continues to respect a well-defined bearish trendline that has been in place since December 2025. So far, there has not been a strong enough buying move to challenge this structure, keeping it as the most relevant technical factor. As long as selling pressure remains in control, the extension of this trend could continue to gain relevance in the coming weeks.
RSI: The RSI indicator is currently hovering around the 50 level, reflecting a balance between buying and selling forces. If this dynamic persists, indecision could become more evident in price action.
MACD: A similar pattern can be observed in the MACD, where the histogram remains close to the zero level, indicating a balance in short-term moving average strength. This reinforces the idea of a neutral phase in the market.
Key levels to watch:
$435: A level of recent highs located above the current bearish trendline. A move toward this area could open the door to the formation of a new bullish trend in the coming weeks.
$400: A key psychological level that aligns with the bearish trendline and the 50 and 200-period moving averages. This is the most important barrier on the chart, and sustained moves above it could invalidate the downtrend and support a more dominant bullish bias.
$344: A level corresponding to the 2026 lows. A move toward this area would reinforce selling pressure and could extend the current bearish trend in the short term.
Written by Julian Pineda, CFA, CMT – Market Analyst
Tesla
TESLA: correction before a generational rally to $1000.Tesla turned neutral on its 1W technical outlook (RSI = 45.357, MACD = -5.430, ADX = 42.116) as despite the heavy volatility this month, it remains on a downtrend since December 2025. The long term pattern is more than clear on TSLA. It is on its 3rd ever Accumulation Phase of the 16 year Channel Up since its IPO and 2026 is a Bear Cycle like 2019, the final before a parabolic rally that has followed the prior two accumulation patterns. Since the price action since the January 2023 has been contained between the 0.5 - 0.786 Fibonacci range, our expectation for end 2028 is to hit at least the top of the range (TP = 1,000). As for the 2026 Low it should be near the 1M MA100, possibly near 230.
## If you like our free content follow our profile to get more daily ideas. ##
## Comments and likes are greatly appreciated. ##

Revenue Growth 7% - yet the stock pumps 20% ...ahem Here is the unvarnished analysis of Intel’s Q1 2026 financials, the macroeconomic hurdles they face, where the actual "wins" reside, and the necessary strategic pivot.
1. The Revenue Growth Reality Check: Price Increases Masking Volume Contraction
For a company carrying a $416 billion market cap in the midst of an AI supercycle, 7.2% top-line growth is anemic. But the quality of that revenue is what alarms me. The growth is entirely driven by price hikes (ASPs), not market share expansion or unit demand:
Data Center and AI (DCAI): Revenue grew 22% to $5.05 billion. However, this was driven by a 27% increase in server Average Selling Prices (ASPs). Actual unit volume declined by 5%.
Client Computing Group (CCG): Revenue was virtually flat at $7.72 billion (up just $98 million). ASPs increased 16%, but unit volume collapsed by 13%.
The Strategic Takeaway: Intel is relying on demand-based pricing actions and a mix of premium products to squeeze more revenue out of shrinking deliveries. Management blames "internal and external supply constraints," but in a highly competitive semiconductor market, a failure to ship units means AMD, NVIDIA, and ARM-based competitors are capturing the volumetric growth. Price up, volume down is not a secular growth story; it is a structural bottleneck.
2. The Cash Flow and Expense Disconnect
The cash flow statement does not support a $416 billion growth narrative.
Operating Cash Flow: Intel generated just $1.09 billion in operating cash flow in Q1 2026.
Operating Losses: The company reported a massive operating loss of $3.13 billion. While the headline number is skewed by a $3.9 billion non-cash goodwill impairment for Mobileye, even adjusting for this, the core Foundry business remains a financial sinkhole.
Intel Foundry: 2.43 billion operating loss** (a negative 45% margin). Worse, management noted that Q1 2026 saw an "increased mix of higher cost wafers manufactured on our Intel 18A process node," signaling that the transition to the 18A node is severely pressuring product profit margins.
Furthermore, Intel is engaging in defensive financial engineering. In April 2026, they bought back Apollo’s 49% stake in the Ireland SCIP (Fab 34) for $14.2 billion. To fund this, they drew down a $6.5 billion 364-day term loan at 4.79%. Borrowing at near 5% in a "higher-for-longer" interest rate environment to plug a fab financing gap is a defensive maneuver, not an offensive growth strategy.
3. Where Are the "Wins"?
Despite the grim broader picture, there are isolated pockets of strategic success:
DCAI Pricing Power: The ability to push through a 27% ASP increase in the Data Center segment without losing more than 5% volume shows that Intel still holds pricing power at the premium tier of enterprise servers.
Aggressive Opex Rationalization: R&D and MG&A expenses actually dropped 8% YoY (saving ~$400 million in the quarter). The 2024 and 2025 Restructuring Plans (headcount reductions) are flowing through to the bottom line, keeping gross margins afloat at 39.4% (up from 36.9% in Q1 2025).
Government Backing (The "Cannot Fail" Put): Intel is functioning as a quasi-state-sponsored entity. The 10-Q highlights the CHIPS Act Secure Enclave program and $629 million in Advanced Manufacturing Investment Credits (AMIC). The U.S. government effectively acts as a floor under Intel’s stock, issuing warrants and escrowed shares because Intel is the only domestic player capable of leading-edge logic R&D.
4. The 2026 Macroeconomic & Geopolitical Hurdles
Any strategy formulation must account for the brutal macro environment outlined in the 10-Q:
The Middle East Conflict: The explicit 10-Q disclosure regarding Iran targeting U.S. facilities is a massive, underpriced risk. Intel's Fab in Israel manufactures the Intel 7 node, which drives a significant portion of current revenues. A kinetic strike on or near this facility, coupled with the Qatar helium supply disruption (critical for fab operations), threatens immediate top-line devastation. Intel admits they are "self-insured for losses resulting from war."
Interest Rates and Capital Cost: Foundry models require relentless CapEx. With interest rates remaining elevated, Intel’s $43 billion long-term debt load is expensive. Their reliance on alternative financing (SCIPs with Brookfield and Apollo) is fraying, as evidenced by the $14.2B Apollo buyout.
Tariffs & Trade: Broader U.S.-China decoupling continues to pressure substrate and memory supply chains, which Intel explicitly cites as a cap on their ability to meet customer demand.
5. Strategy: Where Do They Go From Here?
If I were advising the Board or the CEO on justifying a $416B valuation and executing a true turnaround, the playbook must shift from "empire building" to "ruthless optimization."
Phase 1: Capitulate on Foundry Hubris (De-risk 14A)
Intel must abandon the pride of "doing it all." Management explicitly noted they may "pause or discontinue our pursuit of Intel 14A" if they cannot secure external design wins. They should trigger this pause now. They need to rely on external foundries (TSMC) for sub-18A nodes to save tens of billions in CapEx and focus purely on maintaining architectural superiority in CPU/AI design.
Phase 2: Radical Geographic De-risking
The reliance on the Israel fab is an existential threat in 2026. Intel must accelerate the migration of legacy and mid-tier node production to their Arizona, New Mexico, and Ohio facilities. The CHIPS act money must be aggressively front-loaded to shift supply chain dependencies out of kinetic conflict zones.
Phase 3: Spin-Off / Monetize Non-Core Assets
The Mobileye $3.9B impairment proves the distraction of peripheral bets. Intel should fully divest its remaining stakes in Mobileye and Altera (already 51% sold). They are sitting on non-marketable equity investments and need liquidity to fund their core dividend and debt obligations without tapping 5% term loans.
Phase 4: Pivot to Edge AI and Advanced Packaging
Intel missed the primary GPU boom to NVIDIA and the pure-play foundry boom to TSMC. Their unique remaining moat is in Advanced Packaging (where even TSMC is constrained) and Edge AI (AI PCs). CCG saw an ASP bump because of AI-enabled PCs. Intel must abandon the data center GPU war where it is hopelessly behind, and monopolize the AI PC and industrial robotics edge compute markets.
Conclusion
At $416 billion, the market is paying for a successful execution of a world-class foundry and an AI data center resurgence. The Q1 2026 financials show neither. Intel is surviving on price hikes, aggressive cost-cutting, and U.S. government subsidies, while bleeding volume and cash. Until volume growth returns to the Intel Products segment and the Foundry stems its multi-billion-dollar losses, this stock is trading on national security sentiment, not financial reality.

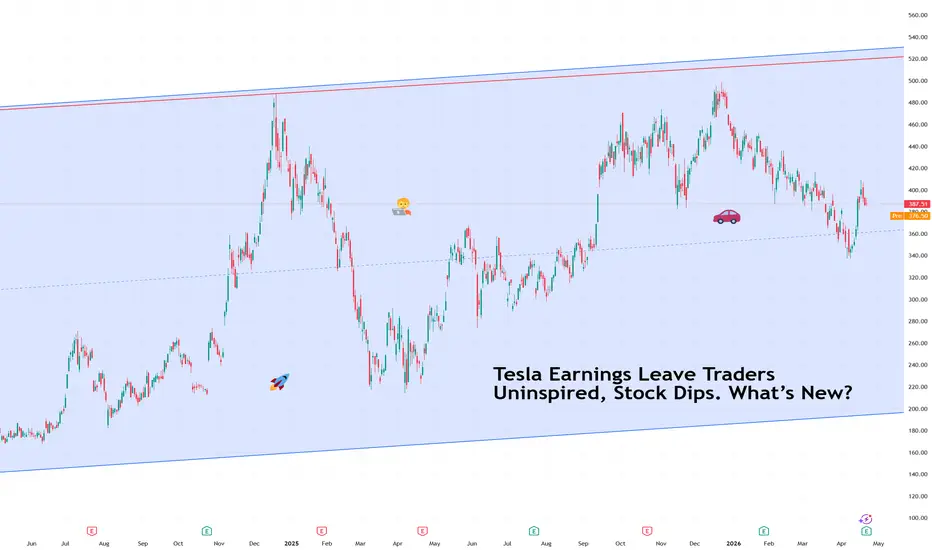
Tesla Earnings Leave Traders Uninspired, Stock Dips. What’s New?Strong numbers arrived. Bigger questions arrived with them.
Tesla NASDAQ:TSLA reported quarterly earnings that technically cleared expectations. Revenue reached $22.4 billion, slightly ahead of forecasts, while adjusted earnings per share landed at $0.41, above the expected $0.36 .
Free cash flow surprised to the upside as well, coming in at $1.4 billion instead of the loss analysts anticipated. On paper, this looked like the kind of report that normally lifts a stock.
Shares did rise briefly in after-hours trading. Then the mood changed during the earnings call. In other words, the earnings season is here and it’s getting heated.
📉 Call Shifted the Narrative
Markets rarely react only to numbers. Guidance often matters more than the quarter itself. During the call, Elon Musk outlined plans for a major expansion in capital spending tied to robotaxis, robotics, trucks, and artificial intelligence infrastructure.
Tesla now expects roughly $25 billion in capital expenditure this year, up from prior guidance of $20 billion. But also, a big increase from last year’s $8.5 billion.
Investors quickly recognized what that means. Higher spending today usually delays profits tomorrow. Enthusiasm faded almost immediately.
🤖 Company Is Changing Shape
Tesla continues to move away from its origin story as a pure electric vehicle manufacturer. The retirement of Model S and Model X reflects that shift. The focus now centers on Cybercabs, humanoid robots, AI chips, and autonomous logistics.
Meanwhile, operating profit rose sharply, climbing 136% year over year to $941 million. Yet the conversation increasingly revolves around what Tesla might become rather than what it currently sells.
🏗️ Capex Is the New Headline
Capital expenditure refers to money spent building factories, infrastructure, and future products. It signals ambition, though it also signals patience is required.
Tesla’s quarterly capex reached $2.5 billion, already elevated. Musk indicated the pace will accelerate significantly as the company develops robotics platforms and builds a massive chip facility tied to its autonomy strategy.
Big Tech rivals plan to spend roughly $660 billion this year on similar infrastructure. Tesla clearly wants a seat at that table.
🚕 Robotaxis Still Live in the Future
The robotaxi story remains central to Tesla’s valuation narrative. The company continues running limited pilot programs in parts of Texas, though Musk indicated meaningful revenue from autonomous ride networks will likely arrive next year rather than immediately.
Investors tend to discount future earnings into today’s stock price. When timelines stretch, patience becomes part of the trade.
🛰️ Musk Ecosystem Expands
Tesla’s strategic orbit (pun intended) continues overlapping with Musk’s broader technology network. The company invested $2 billion into xAI earlier this year, and that stake later converted into equity connected to SpaceX following reshuffling across Musk’s ventures.
Speculation about deeper integration between Tesla and SpaceX continues circulating among analysts. Such moves would reshape how investors interpret Tesla’s identity as both an automotive and infrastructure platform. Especially with the upcoming SpaceX IPO , likely coming in a couple of months.
📊 Familiar Stock Reaction
Tesla’s stock often reacts less to what happened last quarter and more to what investors expect next year.
Adjusted profits rose 56% to $1.5 billion after excluding cryptocurrency losses ($173 million loss on 11,509 Bitcoin BITSTAMP:BTCUSD ) and higher stock-based compensation, yet the market focused on spending plans rather than earnings strength.
That pattern has become familiar. Tesla reports solid results. Musk outlines bigger ambitions. Traders reassess timelines.
🎁 The Takeaway
Tesla delivered a respectable quarter with improving profitability and stronger-than-expected cash flow. But the muted stock reaction reflects a company operating in transition rather than decline.
Markets appear willing to support Tesla’s long-term robotics and autonomy strategy, though they remain cautious about how quickly those bets translate into revenue.
Off to you : Is Tesla still an electric vehicle company with an AI side project, or is it becoming an AI company that happens to sell cars along the way? Share your views in the comments!
Oil Up, Wallstreet Up, Pizza Index Flat Wall Street has reacted positively to the extension of the U.S.-Iran ceasefire. The S&P 500 and Nasdaq both closed at record highs. Extending this rally is Tesla popping 3%+ after hours (despite being down 11% year-to-date), after posting 16% revenue growth in Q1. So: good vibes on Wall Street.
However, shortly after the U.S. extended the ceasefire, Iran's navy seized two container ships in the Strait of Hormuz. WTI crude oil rose to around $92 per barrel, while Brent crude oil rebounded above $101 per barrel.
So, bulls appear in control of both Stocks and oil. Does this suggest a disconnect in the market? Or is the oil market overreacting? The unconventional Pentagon Pizza Index which monitors pizza orders near the Pentagon (an informal indicator of elevated military readiness), may suggest the ceasefire is not in jeopardy even with the recent development in the Strait.

Tesla Stalls at the 200-Day MA — Earnings Tonight Could Fire theTesla is sitting at $389 a precise collision point. After a 21% recovery from its April 7 lows, TSLA has stalled right at the 200-day moving average ($398). Tonight, Q1 2026 earnings drop. This is the moment bulls and bears have been waiting for.
The setup is asymmetric. The stock has already priced in the delivery miss (358K vs 372K estimated). Any positive surprise margins, guidance, autonomy, Robotaxi triggers aggressive short covering against $2.5B+ daily short interest.
Trade Plan:
▪ Entry Zone: $375–$395 (pre-earnings consolidation / 200-day MA base)
▪ Stop Loss: $340 (below double-bottom support)
▪ TP1: $440 | R:R 1:1.9
▪ TP2: $480 | R:R 1:3.0
▪ TP3: $498 | R:R 1:3.5 (52-week high / ATH resistance)
Why the asymmetry favors bulls: All the bad news delivery miss, inventory overhang, margin pressure is fully public and priced in. This is a classic "sell the rumor, buy the news" reversal on a beaten-down quality name. A daily close above $417 confirms the 200-day MA breakout and opens the path to $480–$498.
Educational Takeaway: When a stock declines 20%+ before earnings in anticipation of bad results, and then delivers "less bad than feared," the reaction is almost always positive. Pre-earnings setups on high-short-interest, quality names after prolonged selloffs offer the best asymmetric risk-reward in the market.
Swing trade idea (2–8 weeks). Not financial advice. Always use proper position sizing earnings events carry elevated volatility.

Tesla Inc. Stocks & Crypto: We Are All One!What one does, the rest follows.
Tesla (TSLA) hit bottom in January 2023. It has been moving within a rising channel, higher highs and higher lows since.
Volume was moving down until December 2024. The drop in volume was the preparation for a correction. Volume has been rising and 7-April 2025 produced the highest volume since February 2023.
Here is the thing, when the highest buying came in February 2023, it was the start of this major bullish dynamic, the rising channel. Now volume starts to rise again after a major low (a higher low by the way). This means that we are set to experience another phase of growth, reaching new highs compared to December 2024 and in December TSLA produced its All-Time High. This means that the current bullish wave, brand new, will end in a new ATH in a matter of months. Isn't that great?
Knowing that Tesla is growing and set to continue growing, we know that all related markets or those that have a positive correlation with this one will also grow; What one does, the rest follows.
Thanks a lot for your continued support.
Namaste.

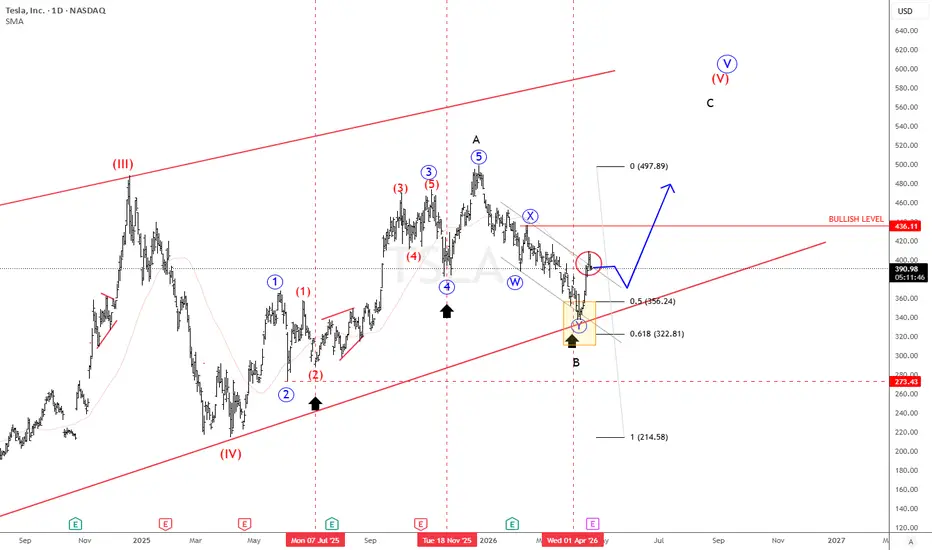
Tesla Testing Fibonacci Support as Correction Nears CompletionTesla has pulled back nearly 30% from recent highs, but the internal structure of the decline still appears corrective rather than impulsive. The price action is unfolding in a multi-swing move, suggesting a potential seven-wave corrective pattern rather than a full trend reversal.
The stock is now approaching a key technical area between the 50% and 61.8% Fibonacci retracement of the rally from the April 2025 lows. This zone is structurally important and often acts as a reaction point in ongoing bullish trends. Early signs of stabilization are already visible, with price attempting to recover outside of the prior corrective channel, hinting that buyers may be stepping back in.
If this support holds, Tesla could still see another upward leg, potentially completing wave C of a broader wave five within an ending diagonal structure.
Highlights:
• Decline still appears corrective, likely a multi-swing structure.
• Price is reacting at the 50%–61.8% Fibonacci retracement zone.
• Break above 436 confirms bullish continuation.
• Drop below 337 risks deeper correction toward 200–150.
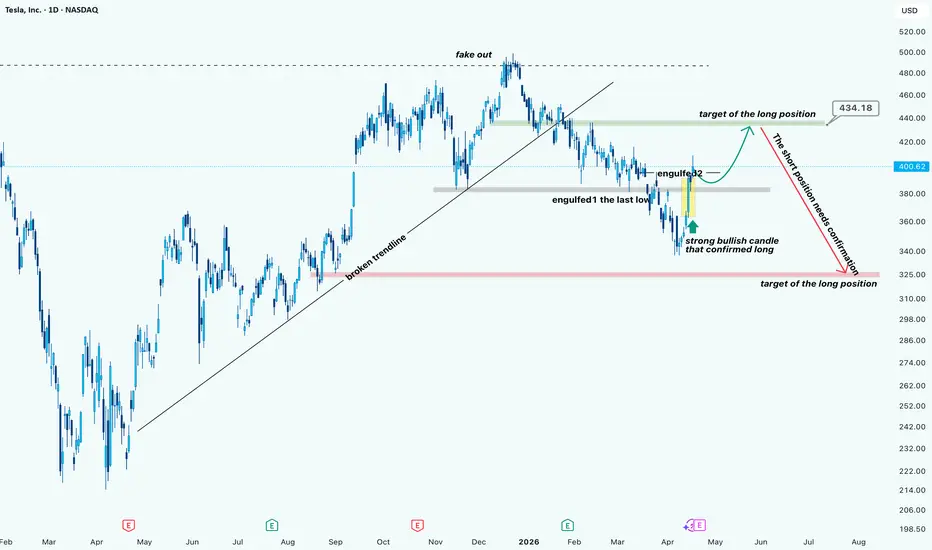
Tesla (TSLA) -> Daily Timeframe AnalysisHi!
After the breakdown of the ascending trendline, the structure clearly shifted from bullish continuation into a corrective phase. The move above the previous highs turned into a fake breakout, which was followed by consistent lower highs.
Recently, price swept the previous low and formed a strong bullish reaction. The key detail here is the engulfing structure:
First, the market took liquidity below the last low
Then printed a strong bullish engulfing candle, confirming buyer presence
This is not random; it’s a liquidity grab + demand reaction, which often leads to a short-term bullish push.
Current Scenario
As long as price holds above the recent demand zone, the bias remains bullish in the short term.
The expected move is a push toward the green supply area around $434.
What happens at $434?
That’s the important part.
This move up is not a confirmed trend reversal, yet it’s more likely a corrective rally inside a broader bearish structure.
At the $430–$435 zone, we should expect:
Weakening bullish momentum
Possible rejection
Or distribution
👉 From there, a potential drop can happen, but:
Short positions require confirmation (rejection, lower high, bearish engulfing, etc.)
Alternative Scenario
If price breaks and holds above $434, then the structure shifts again, and the bearish idea becomes invalid, opening room for continuation higher.
TSLA — Nested Bullish Structure Still IntactHTF bias remains bullish.
The higher-timeframe C target is still open. That’s the anchor.
Key update:
The purple sequence reached its C .
Price then pulled back to its WCL and broke C again .
That behavior created a new bullish sequence (blue) nested inside the larger one.
So now we have:
A new C target (blue)
A new BC zone (blue)
Plus the prior BC zone still valid
In other words: two BC zones , same directional bias.
Expectation:
Price may mitigate one of the BC zones and continue
Or skip them entirely and push straight to C
BC is opportunity, not a requirement.
Invalidation is strict:
If price breaks B by even one pip , the active sequence fails.
Until then, upside remains the path of least resistance.
Structure > narratives.
Not financial advice.

TESLA Massive Short! SELL!
My dear subscribers,
This is my opinion on the TESLA next move:
The instrument tests an important psychological level 400.64
Bias - Bearish
Technical Indicators: Supper Trend gives a precise Bearish signal, while Pivot Point HL predicts price changes and potential reversals in the market.
Target - 378.97
About Used Indicators:
On the subsequent day, trading above the pivot point is thought to indicate ongoing bullish sentiment, while trading below the pivot point indicates bearish sentiment.
Disclosure: I am part of Trade Nation's Influencer program and receive a monthly fee for using their TradingView charts in my analysis.
———————————
WISH YOU ALL LUCK

Tesla - Still heading for new all time highs!👻Tesla ( NASDAQ:TSLA ) still remains bullish:
🔎Analysis summary:
Tesla clearly remains in a very bullish market on the higher timeframe. And with the recent correction of about -25%, it is now approaching a clear support trendline. Therefore it remains totally possible that Tesla is heading for new all time highs during this year.
📝Levels to watch:
$350 and $400
SwingTraderPhil
SwingTrading.Simplified. | Investing.Simplified. | #LONGTERMVISION

TESLA first time on the 1D MA50 since January! Still bearish?Three weeks ago (March 26, see chart below), we gave a strong Sell Signal on Tesla (TSLA) as the price was testing its 1D MA200 (orange trend-line), which methodically hit our $340 Target:
Since then, the massive rebound of the past 5 days just hit the 1D MA50 (blue trend-line) for the first time since January 26. Technically this is an equally massive sell opportunity as besides the 1D MA50, it just hit the 0.236 Fibonacci level of the 4-month Channel Down and is just coming off a 1D Death Cross.
Even if the market has another 1-2 days of upside left, we would expect a similar -22.40% Bearish Leg towards the 0.786 Channel Fib, targeting $315.00.
---
** Please LIKE 👍, FOLLOW ✅, SHARE 🙌 and COMMENT ✍ if you enjoy this idea! Also share your ideas and charts in the comments section below! This is best way to keep it relevant, support us, keep the content here free and allow the idea to reach as many people as possible. **
---
💸💸💸💸💸💸
👇 👇 👇 👇 👇 👇

Tesla Short Term Rebound OpportunityTesla Short Term Rebound Opportunity
Tesla stock shows a healthy correction with a modest upside potential of around 7%, which looks quite attractive. The US market has started to recover, creating an opportunity to trade this move, but further downside in the broader US sector is still expected due to tensions in the Middle East.
Highlights:
• Reuters-linked coverage says Tesla’s low-cost compact SUV program is back in development, and reports also mention FSD v14.3 rolling out with faster reaction time plus Cybercabs spotted at Giga Texas.
• CBS News’ Tesla coverage highlights that Dutch approval for self-driving features was a major milestone in Europe, and also notes a shareholder vote this week on Musk’s compensation package.
• Tesla-focused outlets are also discussing the 2026 Spring Update, new Model Y interior options, and continued FSD software changes.
Next week event (Earnings release - Q1 2026) April 22, 2026:
ir.tesla.com

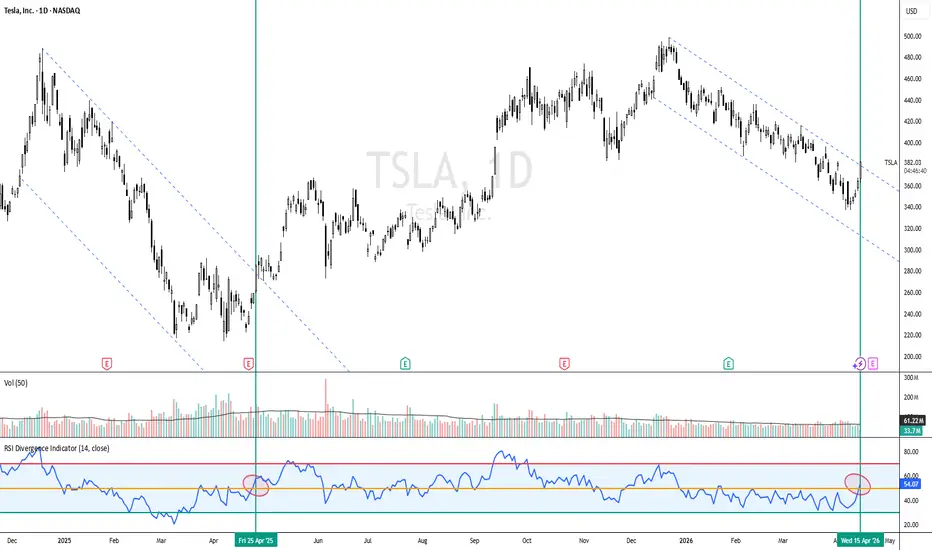
TESLA - THIS BREAKOUT LOOKS FAMILIAR… HISTORY REPEATING?TSLA - CURRENT PRICE : 380.00 - 382.00
TESLA (TSLA) — TECHNICAL BUY CALL
Tesla is showing a repeatable breakout structure, where price has broken out from a descending channel, signaling a potential end to the downtrend phase. This is similar to the previous setup (refer to the green vertical line), where a breakout was followed by a sustained upward move. The key confirmation here is momentum—RSI has pushed back above the 50 level, indicating a shift from bearish to bullish momentum and supporting the validity of the breakout.
This combination of structure break (price) + momentum confirmation (RSI > 50) suggests buyers are regaining control and a new upward leg may be developing. As long as price holds above the breakout zone, this setup favors continuation to the upside, making it an early entry opportunity before stronger momentum kicks in.
ENTRY PRICE : 380.00 - 382.00
FIRST TARGET : 423.00
SECOND TARGET : 450.00
SUPPORT : 337.25 (the low of 9 April 2026)
TESLA: THE ULTIMATE "MAKE OR BREAK" Silence the news feeds, earnings gossip, and micro-noise. You are looking at the final millimeter where Tesla's entire structural history has compressed. This is not a standard support bounce or a simple correction; we have entered the absolute phase where the macro structure asks one final question: "Make or Break?
No Room to Hide
Focus on the massive structure on the main chart. The space between the heavy multi-year overhead resistance and the ascending dotted support line (black arrows) has completely vanished. The price is trapped in what financial geometry calls the "Terminal Apex." The system can no longer delay, chop, or hide. It is mathematically forced to violently release its stored kinetic energy in a single direction.
Historical Death Line RSI (Make or Break):
The true verdict lies in the modified RSI oscillator in the lower panel. Focus on the red horizontal support line and the historical black circles (2016, 2019, early 2023).
Historically, whenever the system crashed into this 24 RSI bedrock, it chose to "Make" rather than "Break," executing total seller destruction and launching mind-bending hyper-rallies.
Right now, as price clings to the dotted support, the RSI has once again struck this absolute death line. Breaking below this red line means structural collapse (Break). Reversing from here ignites a new cycle (Make).
Systemic Synthesis
Price is suffocating inside the Terminal Apex while momentum bleeds out on a historical death line. The millimeter-perfect convergence of these two events creates an incredibly rare "Zero Point" in TSLA's history. You are no longer just investing; you are picking a side in an asymmetric macro war.

TSLA - ELONG or ESHORT ? Why Wyckoff ISN'T WORKINGTESLA on the multi month view gives an interesting perspective.
If we consider the WyckoffMethod, it tells us that investors are always accumulating, swinging, selling, repeat.
Wyckoff Method says:
It goes into a hec of a lot detail which I will not cover for the simple reason that, it's likely we're not seeing the same kinds of accumulation that we saw years ago. Stocks use to trade in a range, with modest growth over years. Investors like Warren Buffet and other peers really did catch the "golden age" to buy - inflation was low, stocks were cheap, and companies were young. Those times have gone.
Today, we've had 2 "recent" financial crises that exponentially increased inflation - first 2008, then Covid. Furthermore, companies are multi-billion dollars strong with global footprints. Never say never, but expanding beyond this for Apple, Coke, Microsoft (and other Titans) would likely mean.. setting up shop on the moon?
The point I'm trying to get to, is that we today cannot accumulate on the same level as Warren Buffet did in the 80's. We rely much more on swing trading. Early buying is hard if there's not an IPO soon - and even if there is, opening prices are already "expensive" compared in % against earnings in the 80's. This is largely due to inflation.
The main point relating to the TESLA chart (but also other Titans) is that we'll likely be looking at one major cycle to the next, without 2-year long periods of cheap accumulation. Additionally, markets are volatile (and often bearish) during times of war, as investors flock to gold and/or cash. Using leverage in a volatile market usually ends badly because you are competing with institutions who likely have more information than all of us combined at any given point in time.
This strengthens the argument for crypto - but additionally, you also take on a lot more risk since cryptocurrency is inherently more risky than publicly traded stocks.
I might still be making an update here or there where I use the term "accumulation zone", this will just be force of habit. What I really would be meaning is, buy low, sell higher.
So, what is your take on this, do you still believe in accumulation or, henceforth, shall we swing?

TSLA — Bearish Coverage Initiated | 01/12/2026Summary
TSLA is Tesla, the electric vehicle and energy company known for EVs, battery systems, and clean energy products. Sellers are in control right now, and 388.73 is the key level that matters most. As long as TSLA stays below that line, the bearish structure remains intact.
Current Read
Tesla remains one of the most closely watched growth companies in the market, with strengths in brand recognition, EV leadership, and long-term energy ambitions, while remaining vulnerable to valuation pressure, demand swings, margin compression, and sharp sentiment changes when growth expectations weaken.
On the chart, this is an established bearish trend that has moved into a deeper sell-off. The current trend change began on 01/12/26, and the bearish condition has now been active for 13 weeks. With price at 348.95, TSLA is trading 11.4% below the structural reversal level, which shows sellers remain firmly in control and buyers are still well below the level needed to repair the chart.
Bear Trend Ends / Bull Trend Begins Above
388.73
What Changes the Picture
Buyers would need to reclaim 388.73 and hold above it to break the current bearish structure. Until that happens, this remains a seller-controlled chart with no confirmed recovery.
This is a reactive market-structure update for educational purposes, not a prediction or trade instruction.

TSLA · Most bearish ever · Elon Musk about to become poorOMG! This is literally the most bearish chart in the whole Universe... Are you ready?
Elon Musk, the owner of this company, is about to become poor. Why, you ask?
Because Tesla, Inc. (TSLA) is going down, a major crash.
What do I have to do to make you sell this? To save your financial life?
If you are a modern day zombie with no idea of technical analysis nor the cyclical nature of the markets, how? How can I be of service to you?
Wait... If you react saying, "It is undervalued," etc. That is not going to work. I am not talking about irrelevant valuations and announcements, I am talking about the chart. I am trying to show you something that is unavoidable. Something that has been happening already for months.
TSLA is going down. Not that it will crash, it is already crashing. It has been going down since December 2025. What happens now, is the climax, the final crash. Everything is about to speed up. Are you ready?
TSLA TECHNICAL ANALYSIS
Previously, my focus was on the long-term double top—December 2024 vs December 2025. This is already old news and irrelevant. Much stronger signals are present so we can ignore that one.
The all-time high from the previous cycle, 414 (November 2021—left side of the chart), has been broken as support. The action is below this level. That's the doom signal. Very simple.
Each time TSLA tried to move back above this level, there was a rejection.
Who is selling? Everybody! Constantly!
Then support was found at EMA55, just one week.
Last week, this level was lost as support. This week, again, TSLA tried to move above it and there was a strong rejection. So far the week is extremely bearish with a long upper-shadow while trading at the bottom of the session. Literally the worst ever when it comes to TA.
I don't have to show you the weak RSI, the bearish MACD and so on. This is just too much. These oscillators are bearish and have been dropping for years. The RSI peaked November 2021 while the MACD peaked December 2024. I don't have to mention those. The candlestick signals are just too strong.
Anyway, I am just kidding about all the drama and saving your life, it is only money. If you keep the stock, you lose; if you sell, you win. If you short, you double-win. The rest is up to you.
I might be kidding about the drama but the stock is going to crash.
When the chart becomes like this, there is no going back.
Namaste.

TSLA: Historical Gigantic Triangle Breakout, Next 200% in Sight!Hello There,
Welcome to my new analysis about the Tesla stock (TSLA). On the broader and global timeframe perspective, this stock is sending huge and historical signals that should not be underestimated. TSLA is continuously within this major uptrend from where it always had the ability to form new higher highs after the others. Now, TSLA is surging higher into the next spheres. Such price action is indicating massive events likely to follow through in 2026.
As when looking at my chart, we can see there that TSLA already broke out above the upper boundary of this gigantic triangle formation. Such a formation is, in a high number of cases, marking the starting point of a huge expansion towards the upside. Especially as TSLA already completed the wave count within the triangle formation, this is marking a huge confirmation of this gigantic formational structure.
As it is seen within my chart, TSLA is now building up above the upper boundary of this giant formation and is setting up the next bullish setup from where the next phases of the bull run are likely. There are also underlying factors supporting this trend, such as the 100-EMA and 50-EMA. As this uptrend is going on, TSLA has major supports here. From this level, the next bounces are highly likely. Currently the bullish setup is already building up, and a continuation should be expected.
Also, TSLA had the ability to expand their China business massively. Such a gigantic market is likely to boost sales, which in turn is bullish for the underlying stock. This dynamic is also attracting a lot of investors and whales to further move into this stock. It will be fascinating to see this dynamic expand in the upcoming times and how the actual market sets up further dynamics for the price action.
Technically, TSLA is already confirming the next major 200% move. As this whole formation has been completed, this is already the cornerstone of confirmation in this whole structure. Considering such a dynamic, there is a high likelihood that TSLA won't reverse or get stuck within the whole structure. It is important that TSLA stay above the upper boundary of the triangle. As long as this is the case, the next expansionist move is likely to happen soon.
With this being said, it is great to consider the important trades upcoming.
We will watch out for the main market evolutions.
Thank you very much for watching!

Tesla Double Bear Sweets: Mean-Reversion Setup Toward 70TSLZ, the T-Rex 2X Inverse Tesla Daily Target ETF, is a leveraged inverse ETF designed to seek approximately -2x the daily performance of Tesla shares, so it is built for short-term tactical trading rather than long-term holding.
Its current quote in the image context shows CBOE:TSLZ trading around $18.64 with an intraday range of $16.21 to $18.75, which makes the setup around nearby resistance and prior structure especially relevant.
On the chart, CBOE:TSLZ has already gone through a major collapse from its earlier highs and has spent a long period base-building below the prior breakdown zone.
The price structure now shows a gradual recovery from the late-2025 lows, with the recent push back toward the short-term resistance band and momentum rising from the mid-range RSI area. That combination often creates a clean swing-trading environment where price can extend if buyers keep defending the higher lows.
A potential trading idea is to follow for continued acceptance above the current consolidation band, followed by a push through overhead resistance and a measured expansion toward the $70 region.
The $70 target is technically reasonable only as a swing thesis, not a guarantee, and it should be treated as a multi-stage objective with interim checkpoints near prior supply levels, trendline retests, and psychological round numbers. If momentum stalls before then, the more realistic outcome may be a rotation back into the base rather than a straight line move.
Risk management matters a lot here because inverse leveraged ETFs can decay over time and can react sharply to Tesla’s daily moves. A trader using this idea would typically want invalidation below the recent base and would avoid holding without a clear thesis tied to Tesla weakness, not just ETF momentum alone.
Short ETF Note
CBOE:TSLZ is not a conventional stock; it is a leveraged inverse product that can move aggressively and reset daily. That makes it useful for short-term directional trades, but much less suitable for passive holding.

Energy Crisis Loading…The Obvious Trade Nobody Is Positioned ForOil is screaming higher.
Energy crisis is next.
Commodities will rip.
You’re still early to the first-order trade:
EVs — $NIO.

TESLA Technical Analysis! BUY!
My dear followers,
I analysed this chart on TESLA and concluded the following:
The market is trading on 360.51 pivot level.
Bias - Bullish
Technical Indicators: Both Super Trend & Pivot HL indicate a highly probable Bullish continuation.
Target - 376.02
About Used Indicators:
A super-trend indicator is plotted on either above or below the closing price to signal a buy or sell. The indicator changes color, based on whether or not you should be buying. If the super-trend indicator moves below the closing price, the indicator turns green, and it signals an entry point or points to buy.
Disclosure: I am part of Trade Nation's Influencer program and receive a monthly fee for using their TradingView charts in my analysis.
———————————
WISH YOU ALL LUCK
