NASDAQ Short Potential - 4/27Price is on an extreme rise, and I see a pullback happening soon due to the previous year's rise for 40% without a significant drop. The NASDAQ then dropped 10% after, and this is the resulting rise back, which broke the all time high. Many signs point to bears coming in soon.
Entry, targets and stop loss on screen.
NQ

QQQ / NDX Weekly Outlook – Week 17 of 2026 (27-01 MAY)QQQ / NDX Weekly Outlook
Last Week’s Recap
Last week’s Long Scenario 1 played out extremely well on QQQ.
Price rejected slightly above the 642 level, and we entered with reduced size.
When zones work within very tight ranges, I use correlated assets as confirmation. If one of the correlated pairs like SPY or QQQ taps its bounce zone, I treat that as valid confluence for both.
I call this method Correlation Confluence (CC) .
Using this approach, I saw SPY tap its zone while QQQ, being the stronger pair, stayed slightly above its exact level. Instead of waiting for a perfect touch at 642, we entered early based on that confluence.
Calls taken around 644 were sold around 650 and 655, locking in strong profits.
We could have held a runner, but with the week closing, I chose to realize gains instead.
One trade, one win on QQQ for the week.
(Reference from last week’s post is shared on the side.)
This Week’s Scenarios / Prediction
The market stayed strongly bullish last week and continued toward its targets. Ceasefire expectations and lower 10 year yields supported fast capital inflows into risk assets.
Even with this bullish structure, Daily RSI has moved into overbought territory. The market has also advanced for several weeks without a proper retracement.
Because of that, I believe we may start seeing some pullback.
That said, the bullish structure remains strong, so I will continue looking for bounce opportunities at key levels.
As always, we do not front run the market. We move with price once it confirms the setup.
Long Scenarios
Scenario 1:
LTF Demand at 653 is the first lower time frame bounce zone.
In a fast bullish market, this area can provide a short term bounce. However, it is not one of the main bounce zones, so it is more vulnerable to breaking.
For that reason, I will reduce size on positions taken here.
If price reacts from this level, I will look to take Calls.
Target: All time highs
A runner can be held.
Scenario 2:
Bounce Zone 1 at 642.5 is the first strong bounce level I am watching.
If price finds support here, I will look to take Calls.
Targets: 649, 655, 660, 665
Scenario 3:
Bounce Zone 2 at 629 is another strong bounce zone.
If price reaches this level, reacts, and confirms on the retest, I will look to take Calls.
Targets: 635, 642, 649, 655, 665
Scenario 4:
KEY S/R at 614 is a strong swing level.
If price reaches this zone, reacts, and confirms on the retest, I will look to take Calls.
Targets: 625, 629, 635, 642
Short Scenario
Bounce Zone 2 at 629 is currently expected to act as support.
However, if the market breaks this level on strong geopolitical news and closes below it on a 4H candle, I will look to take Puts.
Target: 614
Position Management Rules
Take partial profits. Market reversals can happen fast in this uncertain environment.
After the first TP, move stop loss on all remaining positions to entry and turn the trade into a locked profit setup.
Always wait for reaction and confirmation at levels. We do not predict, we react with price.
I share deeper US Market breakdowns and weekly scenario updates on Substack. Link is in my profile.
This analysis is for educational purposes only and reflects my personal opinion. It is not financial advice.

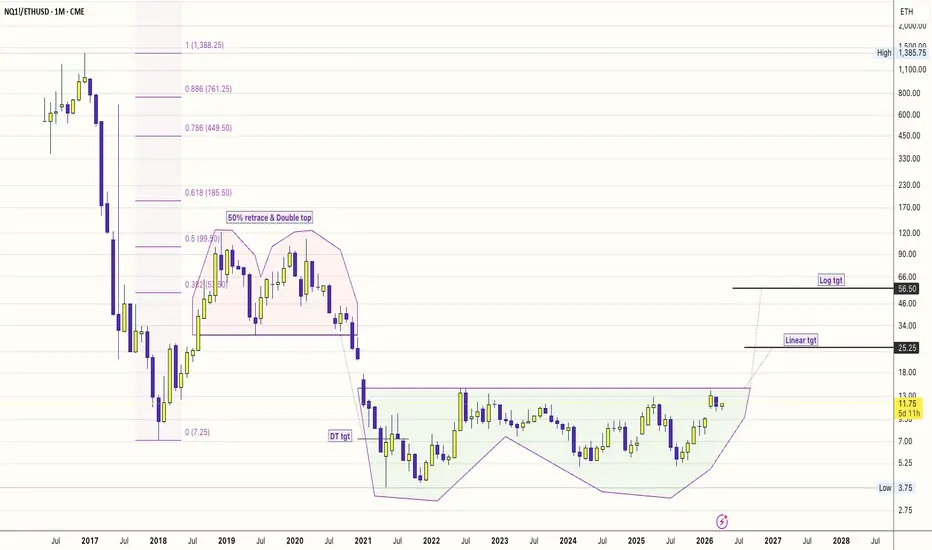
AI Infra > DeFi Infra: The 4-Year Relative Strength Breakout!1. The "Big Base" Logic
Observation: A 4-year base (2022–2026) in the NQ/ETH ratio.
This isn't just a price move; it’s a liquidity migration.
#DeFi (Ethereum) was the hero of the low-interest-rate era (2020-2021).
But in 2026, the "Real World" needs GPUs, data centers, and power grids.
The Nasdaq is the ticker for that physical reality.
The Trigger: Intel’s +24% move and Nvidia’s Blackwell dominance are the fundamental "fuel" for this technical breakout.
2. AI Infra (Hardware) vs. DeFi (Software)
The "Physical" Advantage: AI infra is now a $2.5 Trillion market.
It involves tangible assets (Chips, Fiber, Cooling).
The "Protocol" Fatigue: DeFi has become hyper-fragmented. There are too many L2s and protocols competing for the same liquidity. AI Infra, however, is a bottleneck economy—there is only so much compute to go around.
3. Key Levels
The Pivot: 13.00. A weekly close above this "Neckline" completes the 4-year U-Base.
The Targets: * Target 1 (25.25): The "Linear" target. This assumes Nasdaq continues to grow while ETH stays stagnant—a "repricing of utility."
Target 2 (56.50): The "Blue Sky" log target. This represents a world where AI agents become the primary users of the internet, making traditional human-centric DeFi secondary.
#NQ1! #ETHUSD
#NVDA, #INTC, #BTCUSD
#AIInfrastructure #RelativeStrength #DePIN #MacroEconomy #Semiconductors
In 2026, we’ve moved from "training" models to "running" them (Inference).
Running them requires constant, stable hardware—exactly what the Nasdaq companies are building.
QQQ / NDX Weekly Outlook – Week 16 of 2026 (20-24 APR)QQQ / NDX Weekly Outlook
Last Week’s Recap
Long Scenario 1 played out exactly as expected. Once price broke above the Upper SD and secured acceptance, the market pushed higher and reached all time highs.
However, from an execution standpoint, we were waiting for a retest of the Upper SD to enter. Since price continued higher without giving that retest, we did not take the trade.
The goal is not to chase price. If you do that, you end up entering at the top. The focus is to move with price, not after it.
(Reference from last week’s post is shared on the side)
This Week’s Scenarios / Prediction
By mid last week, the market reached all time highs and clearly shifted into a bullish structure. The main catalyst behind that move was the ceasefire news, supported by the technical breakout.
At this stage, I do not think price has enough energy to continue directly higher from all time highs. A pullback to build energy would be the healthier structure.
This week, I will continue with a level to level approach.
Long Scenarios
There are three potential bounce zones I am watching for long opportunities.
Scenario 1:
If price taps Bounce Zone 1 at 642 and closes above it, I may look for a long entry on the pullback.
This is a weaker level, more of an LTF zone, so position size should be reduced. I will personally use smaller size here.
Targets: 645, 650, 655
Scenario 2:
Bounce Zone 2 at 636 is the strongest HTF reaction level.
If price reaches 636, finds support and closes above it, I will look to take Calls on the retest.
Targets: 642, 645, 650, 655
Partial profit taking makes sense across these levels.
Scenario 3:
If price sells off aggressively and reaches Bounce Zone 3 at 618, I expect a strong reaction from that area.
On a confirmed bounce and retest around 618, I will look to take Calls.
Targets: 626, 636, 645
Short Scenario
Scenario 1:
Bounce Zone 2 is expected to act as support.
However, if strong geopolitical news breaks this level and price closes below 636 on a 4H basis, I will look to take Puts.
Targets: 626 and 618
Position Management Rules
Take partial profits. In this kind of environment, reversals can happen quickly.
After the first TP, move the stop loss on the remaining position to entry and lock the trade.
Always wait for confirmation at levels. The goal is not to predict but to react with price.
I share deeper US Market breakdowns and weekly scenario updates on Substack. Link is in my profile.
This analysis is for educational purposes only and reflects my personal opinion. It is not financial advice.

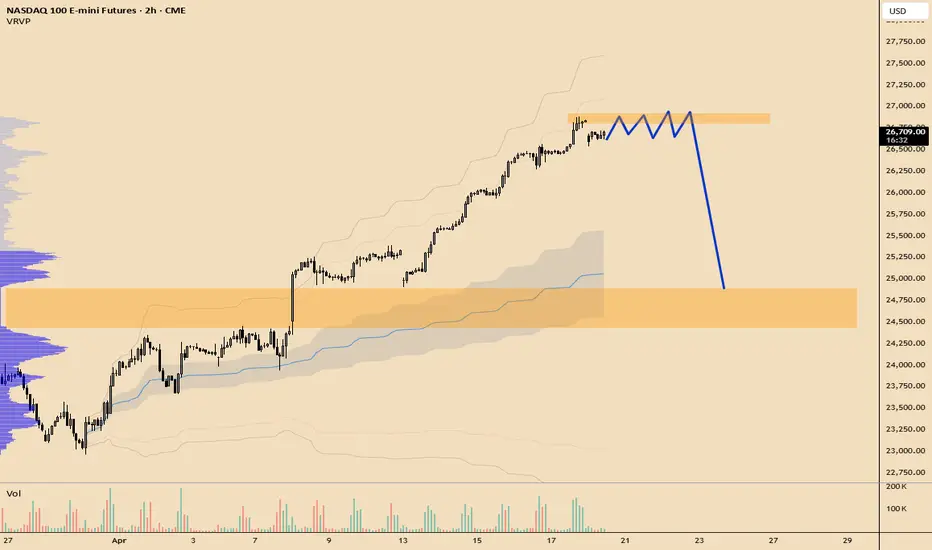
Nasdaq - time to make a drop Nasdaq - time to make a drop
price of nasdaq - overextended ofthen price come back to vwao
that's why i think we can see $25 000 - 25 500 this week
The Most Expensive 90 Minutes in Futures TradingEvery NQ/MNQ futures day trader knows this window. 12:00 to 13:30 ET. The lunch session. And most of us have the journal entries to prove it is where we give back our morning gains.
Between roughly noon and 1:30 PM Eastern, the US equity index futures market enters a structural dead zone. The cash equities desks are at lunch, institutional order flow dries up, and volume drops to a fraction of the morning session. What remains is a low-liquidity environment dominated by algorithmic market makers widening spreads and hunting stops on both sides. The result is choppy, directionless price action that looks like it is about to break out — and never does. NQ will put in a convincing higher low, draw in longs, then sweep them. Then it puts in a lower high, draws in shorts, and sweeps them too. Rinse and repeat for 90 minutes.
The math is straightforward. If you journal your trades and tag them by session, most retail NQ traders will find that their worst expectancy window is somewhere between 11:30 and 13:30 ET. Not because they are bad traders — but because the market structure during that period does not support directional setups. You are playing a range game in a session optimized for trend-following, and the market punishes that mismatch.
The fix is not a better indicator. It is discipline. Know your bad window, and do not trade it. The challenge is that in the moment, every lunch-session candle looks like the start of the next move. Your brain wants to engage. That is why I built Discipline Guard — a free, open-source TradingView indicator that progressively blacks out the chart during your personal no-trade windows. It starts with a subtle amber tint 15 minutes before the window, deepens the warning at 5 minutes, and then covers the chart with a dark overlay during the active period. The idea is simple: make it psychologically harder to take a trade you already know you should not be taking.
The chart above shows the indicator active on NQ 15-minute bars. Notice how the blackout zone aligns with the choppy, low-range bars — and how the clean directional moves happen before and after. That contrast is not a coincidence. It is market structure.
This is not a signal. It does not tell you what to trade. It tells you when to stop. If your journal says the lunch session is costing you money, consider whether sitting it out might be your highest-edge trade.

NQ Bearish Engulfing get ready for a dropBearish Engulfing in Progress — NQ Short Setup
Bearish engulfing candle forming at the highs after a strong push up into resistance. Price is pressing into a key supply zone and showing signs of rejection. The play is short, targeting a move back down to fill the inefficiency below.
SL: 26,016 (pending) — a break of the overnight high would invalidate the bearish thesis and stop out the trade.
PT 1: 90% trim at the first support level (~25,850 zone)
PT Full: 100% trim at the lower support (~25,800 zone)
The structure is clean — impulsive move up, now printing a bearish engulfing right at resistance with a defined invalidation level. If the overnight high holds, sellers take control from here.

NAS100-NASDAQ | (1H) | Trend Analysis | Prof.TraderTilki Guys, greetings,
I prepared a NAS100 analysis for you.
If NAS100 makes a correction toward 25,220 – 25,147, I will open a buy trade from that zone and target 25,600.
After many requests, I have started sharing signals with you again. My only request is that you support my analyses with your likes.
I love each of my followers. It’s thanks to your likes that I continue to share these analyses. 💛

NQ NASDAQ Has Completed A W Pattern We have been bullish in NASDAQ as you know.
NQ (NASDAQ/US100/USTECH) now has filled the daily time frame gap and has completed a W pattern. it is still bullish so for any short opportunities, we need confirmation. We have 2 FCP zone which we need to watch out for.
No an advice as usual!
Be careful of the geopolitical situation though and manage the risk.
Follow for more. Please support this analysis by liking, commenting, and sharing with friends, colleagues, traders, and trading communities. Thanks👍🙂

QQQ / NDX Weekly Outlook – Week 15 of 2026 (13-17 APR)QQQ/NDX Weekly Outlook
Last Week’s Recap
QQQ found a very clean bounce early in the week from the Key Level at 582. As planned, we waited for the retest and took Calls to position long.
Going into Tuesday, there was a ceasefire headline expected. Since QQQ was showing relative strength compared to SPY, we followed the signal and went long QQQ while shorting SPY with the same size.
The idea was simple: long the stronger asset, short the weaker one.
In volatile, news driven conditions like this, this type of hedge helps a lot. The winning side typically outweighs the loss on the other side, keeping the overall result positive.
That’s exactly what happened. We took profits on QQQ and got stopped on SPY, ending the week green overall.
(Reference from last week’s post is shared on the side)
This Week’s Scenarios / Prediction
Following the ceasefire news, price broke above the bearish trendline and is now trading into the Upper SD zone.
This Upper SD is a strong supply area. If it breaks clean, it opens the path toward all time highs. But a rejection from this zone can send the market back down.
Long Scenarios
Scenario 1:
If price breaks above the upper band of the Upper SD at 618, the market can start a continuation move higher.
Given the geopolitical uncertainty, I am not looking to hold a swing position. Targets will be 621.75 and 628.
Scenario 2:
If price pulls back to the Real Gap at 602 or the Mid SD at 599 and finds support, I will look to take Calls.
Target: 613 (Upper SD)
Scenario 3:
If price breaks below Mid SD without a bounce and moves lower, I will watch for a retest of the broken trendline.
If price manages to reclaim and close back above 599, I will look to take Calls.
Target: 613 (Upper SD)
Scenario 4:
If price reaches the Lower SD and closes above it, confirming a bounce, I will look to take Calls on the retest.
Target: 594
Short Scenarios
Scenario 1:
If price rejects from the Upper SD, I will look to take Puts.
Target: 602
Scenario 2:
If price breaks below Mid SD and the trendline again, I expect continuation toward Lower SD.
In that case, I will look to short targeting 580.
I share deeper US Market breakdowns and weekly scenario updates on Substack. Link is in my profile.
This analysis is for educational purposes only and reflects my personal opinion. It is not financial advice.

QQQ / NDX Weekly Outlook – Week 14 of 2026 (06-10 APR)QQQ / NDX Weekly Outlook – Week 14 of 2026
Last Week Recap
Last week, as expected, price shifted into a bearish structure and we focused on downside targets.
We clearly defined bounce levels as potential targets and stated that trades would be taken only after a daily close above those levels (bounce / deviation confirmation).
That is exactly what happened. Price tapped 557.5 and closed above it. Just before the daily close on Monday, staying disciplined with the plan, we entered Calls and longed the market.
As mentioned in the weekly strategy, the target for this trade was the next band, which was 577.5. Price moved exactly as expected, delivering a 19.5 point move , around a 3.5% gain on QQQ.
By Tuesday, we had already locked in significant profits early in the week.
For the rest of the week, price consolidated around the Key Level. Since Friday was a holiday, we avoided taking new trades to prevent time decay risk over the weekend, especially after a strong week.
(Last week’s analysis is shared on the side for reference.)
Scenarios – Prediction
Price holding above the Key Level suggests potential for a short term bullish move.
However, there is a strong rejection zone ahead. The Key Supply area aligns with the bearish trendline, creating a clear confluence. This increases the probability of a strong rejection from that zone.
This week, the approach will be level to level trading.
Long Scenarios
Scenario 1
If price breaks above the Key Supply zone and secures acceptance above it, I will consider Calls targeting the next level.
Bullish target: 606
Scenario 2
If price tests the Key Level and closes back above it (bounce), I will consider Calls targeting the Key Supply (591.5).
Short Scenarios
Scenario 1
If price rejects from the Key Supply zone and closes below the trendline, I expect a move back toward the Key Level upper band.
In this case, I will consider Puts to short the market.
Scenario 2
If price breaks below the Key Level lower band, the structure shifts back to bearish and I expect continuation toward HTF Bounce Levels.
In this case, I will continue with Puts.
Key Levels
Key Level bands: 577 – 582
Key Supply bands: 591.5 – 595.5
HTF Bounce Levels:
557.5 – 550 – 543
These levels act as potential downside targets. If price reaches them and secures a daily close above, they can also be used for bounce trades with Calls.
Position Management Notes
I only take trades after confirmation. Acceptance above or below key levels is required before entering.
If price fails to hold a level after breakout or breakdown, the setup becomes invalid and positions should be managed accordingly.
I share deeper US Market breakdowns and weekly scenario updates on Substack. Link is in my profile.
This analysis is for educational purposes only and reflects my personal opinion. It is not financial advice.

QQQ/NDX Mid Week Update (09-10 APR)QQQ/NDX Mid Week Update
SPY shifted into a bullish structure following the US/Israel–Iran ceasefire news.
With the sharp drop in crude oil and DXY, risk assets and indices transitioned into a more neutral to bullish structure.
Because of this shift, a Mid Week update became necessary outside of the weekly framework.
Mid Week Scenarios / Updates
Price has broken above the Lower SD zone, which was acting as a strong resistance. At the same time, the bearish trendline sitting on that region has also been broken.
With this move, I consider the market to be transitioning into a bullish technical structure.
The approach remains level to level. I will continue trading reactions between key zones.
Bullish Scenarios
Scenario 1:
If price holds above the Mid SD and retests it, I will look to take Calls around 610 to position long.
Target: 615
Scenario 2:
If price pulls back to the Lower SD, finds support and confirms a bounce, I will look to take Calls around 597.
Target: 606
Bearish Scenarios
Scenario 1:
If Mid SD breaks to the downside and price closes below it, I will look to take Puts on a retest around 606.
Target: 597
Scenario 2:
If Lower SD breaks to the downside and price closes below it, I will look to take Puts on a retest around 590.
Target: 580
I share deeper US Market breakdowns and weekly scenario updates on Substack. Link is in my profile.
This analysis is for educational purposes only and reflects my personal opinion. It is not financial advice.

NQ – 15M Scalp Short Idea
Price is pushing into a short-term resistance zone after a quick move up, showing signs of slowing momentum. Structure on the lower timeframe is starting to shift, with potential for a pullback.
Looking for a quick scalp short if price shows rejection in this area.
Plan:
Entry: on bearish reaction / rejection
Target: quick move to intraday lows / liquidity
Stop: above local highs
Note: This is a quick scalp setup — not looking for a big move, just a clean reaction.
Tone:
Looks like a decent chance for a small pullback if this level holds.
Disclaimer:
Not financial advice. Manage your risk.
Invalid if price reaches TP before entry.

NQ Trade Idea - Bearish SetupNQ already broke structure on daily TF on Feb 4th when it broke 25025 and confirmed the next day. It bounced from 200 day SMA on Friday Feb 6th but made a lower high with very low volume. It again currently touching 200 day SMA. I am on bearish end since it broke the structure on Feb 4th and then made a LH last week.
NQ Trade Idea - Bearish Setup
Entry: 25000 - 24800
SL: 26350
TP: 20800
RR: 1:3


SPY / SPX Weekly Outlook – Week 14 of 2026 (06-10 APR)SPY / SPX Weekly Outlook – Week 14 of 2026
Last Week's Recap
As mentioned in the previous weekly analysis, SPY/SPX has now confirmed the bearish structure break that I’ve been pointing out since early January 2026.
We identified 629.5 as the first downside target and marked it as a potential bounce level. The plan around that level was very clear, and price respected it perfectly.
Price tapped 629.5 on Monday and managed to close above it. Based on the strategy, a daily close above that level meant we would look to long the move toward the next band, which was the Key Level zone.
As soon as it became clear that price would hold above the level, we took Calls and positioned long. The target was 644, and that level was reached cleanly by Tuesday around midday. We closed the position there and locked in profits.
It played out exactly as planned. We caught around a 2% move, and the call contracts delivered strong returns.
While most of the market was trading with fear, we simply followed the plan and secured profits early in the week.
On Thursday, we did not take the Key Level retest trade even though it was part of the plan. Since Friday was a holiday, we avoided holding positions into the weekend to prevent time decay. That decision was intentional.
(Last week’s analysis is shared on the side for reference.)
Scenarios – Prediction
Market holding above the Key Level suggests there is still room for a short term bullish push.
However, there is a strong rejection zone ahead. The Key Supply area aligns with a bearish trendline, creating a clear confluence. This increases the probability of a strong rejection from that region.
This week, the approach remains level to level trading.
Long Scenarios
Scenario 1:
If price breaks above the Key Supply zone and secures acceptance above it, I will look to take Calls targeting the next level at 672.5.
Scenario 2:
If price pulls back to the Key Level zone and holds above it with a confirmed bounce, I will look to take Calls targeting a move back toward the trendline.
Short Scenarios
Scenario 1:
If price reaches Key Supply and shows rejection while closing below the trendline, I will look to take Puts targeting the upper band of the Key Level zone.
Scenario 2:
If price breaks below the Key Level band, structure shifts back to bearish. In that case, I will look to short the market targeting HTF Bounce Levels.
Key Levels
Key Level Band: 644 – 649
Key Supply Band: 657.5 – 664
HTF Bounce Levels: 629.5 and 614
These HTF Bounce Levels are the areas where price can react if downside continuation accelerates. If price reaches these levels and manages to close back above them on a daily basis, they can also be traded as bounce zones with Calls.
Position Management Notes
I only take trades after confirmation. A level is considered valid once price either secures acceptance above/below it or shows a clear deviation.
If price closes back on the opposite side of the level after a breakout or deviation, the setup becomes invalid and positions should be closed.
I share deeper US Market breakdowns and weekly scenario updates on Substack. Link is in my profile.
This analysis is for educational purposes only and reflects my personal opinion. It is not financial advice.

QQQ/NDX Weekly Outlook – Week 13 of 2026 (30 MAR-03 APR)QQQ Weekly Outlook
Last Week's Recap
Last week, after price ran the 580 level (HTF Key Low) on March 20, the plan was to expect a potential short term bounce into Monday and Tuesday. However, we clearly stated that if price failed to reclaim the Lower Band, the upside would likely fade quickly.
While the market got carried away with the Trump peace deal narrative and chased the upside, we stayed disciplined and followed the plan.
Price tested 591.5, failed to move back above the Lower Band, and closed below it. That was the confirmation we needed. We entered Puts and shorted the market.
As planned, once price accepted below 591.5, we targeted 580 and captured a clean 12-point move, around a 2% drop.
We closed 90% of the position in profit and left the remaining size running at breakeven for potential continuation.
The plan worked clean and exactly as expected.
(Last week’s analysis is shared on the side for reference.)
Scenarios – Prediction
Scenario 1: Bearish Continuation
The market is still in a bearish structure.
The 577.5 level (lower band of the Key Level) stands out as a potential rejection zone. If price moves into this level and shows rejection, I will look to enter Puts and continue shorting the market.
Bounce Levels (Bearish Targets):
557.5 – 550 – 543 – 535
These levels can act as bounce zones. I will be taking profits on Puts around these areas.
If price reaches any of these levels and prints a daily close back above, a short term long can be considered toward the next level. However, since no clear bullish reversal structure is present yet, these would only be reaction trades, so position sizing should remain controlled.
Scenario 2: Bullish Reversal Attempt
If price breaks above the 582 level (upper band of the Key Level) and secures a daily close above it, the structure can shift to bullish.
In that case, I will look to take Calls around the 582 area and target 591.5 as the next level.
Until that happens, downside continuation remains the more likely path.
Position Management Notes
I only enter trades after confirmation. Acceptance above or below key levels is required before taking a position.
If price reclaims or loses a level after entry, the setup becomes invalid and positions should be managed accordingly.
I share deeper US Market breakdowns and weekly scenario updates on Substack. Link is in my profile.
This analysis is for educational purposes only and reflects my personal opinion. It is not financial advice.

Panduhh's NQ Futures ViewpointThese are the equilibrium levels for the current structure in the NQ futures
I put levels for intraday setups as well as for swing setups overlayed for this one.
Levels are derived from internal framework using structure and geometric relationships—not time-based inputs.
Focus is not on prediction, but on order flow response at price.
Reaction at each level determines outcome:
– Acceptance → continuation within value
– Rejection → rotation away
– Failure → discovery beyond the range

Panduhh's NQ ViewpointWell Yesterdays levels were literally perfect. New levels for the day and larger time frame. R2 and R3 are the same as yesterday. Pivot is +30 points from yesterdays.
These are the equilibrium levels for the current structure in the NQ futures
I put levels for intraday setups as well as for swing setups overlayed for this one.
Levels are derived from internal framework using structure and geometric relationships—not time-based inputs.
Focus is not on prediction, but on order flow response at price.
Reaction at each level determines outcome:
– Acceptance → continuation within value
– Rejection → rotation away
– Failure → discovery beyond the range

QQQ/NDX Weekly Outlook – Week 12 of 2026 (23–27 MAR)QQQ Weekly Outlook
Technical Look
Last week price hovered above the Range Low zone but never actually tested it to create a proper bounce, so no trade was taken initially.
On Thursday, price broke below 591, then came back for a retest. Based on the plan shared in the previous QQQ analysis, this break and retest setup triggered a short position. We entered Puts and targeted 581 as the bearish target.
The trade worked cleanly. Price moved down about 11 points and we closed the position on Friday with strong profit.
Overall, a very clean and well executed trade.
(I’m sharing the link on the side for reference)
Scenarios – Prediction
Price reached 580 on Friday as expected and managed to close back above it. This is a typical bounce signal.
This week the focus will be on key zones and band reactions.
If price closes above or below these levels with acceptance, I expect it to move toward the next level.
Key Levels:
Key Mid Level: 606 – 612
Lower Band: 591.5 – 595.25
HTF Key Low: 580
Scenario 1: Reaction-Based Range Trading
Price can react from these zones with either rejection or bounce.
If price tests the upper or lower edges of these bands and closes above them, I will consider Calls.
If price tests these levels and closes below them, I will consider Puts.
The idea is to follow acceptance above or below key levels and target the next zone accordingly.
Scenario 2: Bearish Breakdown
If price makes a strong daily close below 580, this could trigger a larger bearish move.
This level is critical and should be watched closely. A confirmed breakdown below it would shift the structure more aggressively to the downside.
Position Management Notes
I only take trades after confirmation. A level needs to show acceptance with proper closes before entering.
If price reclaims the level after a breakdown or loses it after a breakout, the setup becomes invalid and positions should be exited.
I share deeper US Market breakdowns and weekly scenario updates on Substack. Link is in my profile.
This analysis is for educational purposes only and reflects my personal opinion. It is not financial advice.

NQ — Failing At Range LowNQ is sitting at the weekly range low.
Still inside the range.
Strong negative delta is pushing into the level with heavy volume.
Price keeps failing to close below it.
If that changes, the structure shifts.
Risk is tight here.
Exposure stays controlled.
No trade unless price accepts below the level or shifts on lower timeframes.
Engagement only after a clear break or reclaim.
CORE5DAN

NQ buy setup 4HR TFNQ buy setup as per Wyckoff accumulation schematic model 2. Entry will be triggered on the 10min BOS. SL is placed underneath the potential third tap.
Entry: 24530
SL: 24325 (205 points)
TP: 26135 (1605 points)
RR: 7.8:1

NQ/NASDAQ (US100) OUTLOOK 1HAll the indices have been bearish since the end of Feb. Monday open gave us a quick huge up move exceeding a DBD supply level. Demand > Supply.
Scenarios that make sense:
- We come back to the 2WT (2 Way Trap) and we continue higher.
- We sweep either of the hooks and continue bearish.
- We displace over the hooks and start a bullish trend.
What do you think will happen?
