ETH/USDT: Symmetrical Triangle Breakout in Progress!Hi!!!
Ethereum has finally squeezed out of its consolidation phase on the 15M chart. After days of tightening price action, the Symmetrical Triangle has resolved to the upside, signaling a return of bullish momentum.
The Technical Setup:
The Breakout: Price has decisively cleared the upper resistance of the triangle. This move marks the end of the "indecision" phase and the start of a fresh expansion.
Market Structure: We are seeing a clean push away from the apex. The immediate price action suggests buyers are aggressively stepping in to front-run the next leg up.
Resistance Flip: The previous supply zone around $2,335 is now acting as an immediate floor for this move.
Targets in Sight:
🎯 Target 1: $2,351 (The primary measured move of the triangle).
🎯 Target 2: $2,360
Ethereum (Cryptocurrency)

The Ether Bull & New ATH · EMA13 Conquered · $3,730 Next!The 2025 bullish cycle really intensified once Ether moved weekly above EMA13. As soon this happened, ETHUSDT experienced sustained bullish action for months.
The bullish wave ended August 2025 with a test of EMA13 as support in September, then again October. When EMA13 broke as support, we saw months of bearish action.
The bearish period wasn't straight down, there was some relief in late 2025 until January 2026. In January, all growth stopped as soon as ETH faced EMA13 as resistance. Just one challenge of this level and a crash from $3,400 ended at $1,750, showing how important EMA13 is to determine mid-term price action.
After almost three months of consolidation, recovery and accumulation at bottom prices, after the 6-Feb low, ETHUSDT managed last week to move and close above EMA13, giving us the strongest bullish signal of all. This opens the doors for massive growth.
Just as in October 2025 a break below this level led to four months of bearish action; a break above in April 2026 can lead to several months of bullish action. All that is needed is a follow through this week.
If bulls/buyers show up at current prices, ~$2,400, we can expect a fast and sudden advance toward $3,730. That's our next target.
ETHUSDT just closed four consecutive weeks green after a long-term higher low. The path is open for a new all-time high long-term, and maximum growth short-term.
Thanks a lot for your continued support.
Namaste.

ETHEREUM - Huge Elliott Waves Formation Ethereum is currently approaching the final stage of a global accumulation phase, structured as a complex W–X–Y–X–Z correction , which began after the breakdown of the previous impulsive cycle (1–5) and the following ABC corrective move.
Macro Structure: After the completion of the bullish impulse (1–5), the market transitioned into a corrective regime, forming an extended and complex structure rather than a simple pullback:
The initial decline formed an ABC correction, marking the shift from trend to accumulation
This was followed by a broader WXYXZ formation, typical for prolonged accumulation phases in high-timeframe markets
The final Z-leg acted as a liquidity sweep, breaking below prior structure and forcing capitulation
Formation of the Current Range: The bottom formation (WXYXZ) created a structural floor, from which the current range developed. Since then:
Price has been consolidating within a rising channel / range
Volatility has been compressing under a major resistance zone
Market behavior aligns with re-accumulation rather than distribution
This suggests that the market is absorbing supply, not distributing it.
XY Development: From the upper resistance zone, price formed a corrective XY structure, which is critical for understanding current positioning:
Wave X → Y defined the internal corrective leg within the broader accumulation
The Y wave established a key support trendline (dynamic support)
This trendline is currently being respected, with price bouncing directly from it
This reaction confirms that the structure remains technically valid and buyers are defending higher lows within the range.
In conclusion , Ethereum appears to be in the final stage of a prolonged accumulation phase, where a completed correction and a well-defined structural support are now supporting the price. This combination suggests that the current consolidation is more likely a phase of compression before expansion rather than distribution. As long as key support levels hold, the chances of going up are much higher, with a breakout above resistance potentially marking the beginning of a new impulsive leg in the cycle.

Bullish bounce off pullback support?Ethereum (ETH/USD) is falling towards the pivot, which is a pullback support that aligns with the 50% Fibonacci retracement and could bounce towards the 1st resistance.
Pivot: 2,164.55
1st Support; 1,947.06
1st Resistance: 2,621.89
Disclaimer:
The opinions given above constitute general market commentary and do not constitute the opinion or advice of IC Markets or any form of personal or investment advice.
Any opinions, news, research, analyses, prices, other information, or links to third-party sites contained on this website are provided on an "as-is" basis, are intended to be informative only, and are not advice, a recommendation, research, a record of our trading prices, an offer of, or solicitation for, a transaction in any financial instrument and thus should not be treated as such. The information provided does not involve any specific investment objectives, financial situation, or needs of any specific person who may receive it. Please be aware that past performance is not a reliable indicator of future performance and/or results. Past performance or forward-looking scenarios based upon the reasonable beliefs of the third-party provider are not a guarantee of future performance. Actual results may differ materially from those anticipated in forward-looking or past performance statements. IC Markets makes no representation or warranty and assumes no liability as to the accuracy or completeness of the information provided, nor any loss arising from any investment based on a recommendation, forecast, or any information supplied by any third party.

ETH Retests Demand After Rejection — Bounce or Breakdown Next?
Ethereum faced strong rejection from the 2,390 resistance zone and is now pulling back into a key demand area around 2,260–2,280. This zone aligns with previous structure and acts as critical support in the short term.
Market structure shows a recent CHoCH followed by downside pressure, suggesting weakening bullish momentum. However, as long as price holds above this demand, a recovery remains possible.
A bounce from this zone could push ETH back toward 2,340, and a successful break and hold above that level may open the path toward 2,390 again. On the downside, a clean break below 2,260 would invalidate the bullish setup and could lead to further selling toward 2,230 and lower.
Waiting for confirmation (reaction, structure shift, or strong bullish candles) before entry is key here.

ETHEREUM: Historical and Huge Triangle, +300% Breakout Incoming!Hello There,
welcome to my new analysis about Ethereum from a broader timeframe perspective. Although there are still crucial bearish signs on the local timeframe, which should not be underestimated, the longer-term perspective is rather differentiated. Before moving into this dynamic, it should be said that Ethereum did not break its established trend since 2020. The price action of Ethereum managed to form several higher highs within the structure. Now, there is a major underlying formation that could be the origin of historical price moves.
As when looking at my chart, we can watch Ethereum solidly stabilize within this major range between $1000 and $3000. The $1000 mark is a highly important psychological support level. Above this level, Ethereum is now continuing to finalize this gigantic ascending triangle formation. Within this formation, Ethereum is developing a crucial wave count, of which waves A and B have already formed. Now it is continuing to complete the wave C within this whole structure. Within the local frame of the wave C, Ethereum is forming a bear flag within the descending channel.
Once the price action reaches the lower boundaries of the gigantic triangle formation, there are major underlying supports. Also determined by the 100-EMA marked in green and the 50-EMA marked in blue. Once Ethereum reaches out to these zones, there is a bounce and stabilization highly likely. Especially when the whole wave count from A to C has finalized, this will confirm the origin of a stable bounce within this area. In this case it is highly necessary that Ethereum does not break below the lower boundary because this could invalidate the triangle.
For now it seems as though there will be no such invalidation. Once Ethereum has the ability to break out above the upper boundary of this huge triangle, it will confirm the continuation setup. In this case a mere 300% bounce and expansion into the bullish direction is highly likely. As seen in my chart, the bullish targets will be active once Ethereum has completed the whole triangle formation. Also, there are other factors that make such a price action likely, such as the growing institutional adoption. Besides, Ethereum reached record-high stablecoin transfers of over $8T.
The next times will be extremely decisive, and everything depends on how the environment of Ethereum continues to develop. This will be extremely important for the forthcoming of the whole formational structure. In any case, the historical and influential price changes should not be underestimated in any case.
With this being said, it is great to consider the important trades upcoming.
We will watch out for the main market evolutions.
Thank you very much for watching!

ETHEREUM: Crucial Formation, Important Levels to Watch!Hello There,
on the short-term perspective Ethereum is forming crucial bearish pressure which could be decisive within the near future. While Ethereum remains the second largest cryptocurrency, it is recently forming crucial formations that should not be underestimated. In the past weeks, trading actions already showed major selling pressure occurred from whales dropping their ETH on the market. Now, there is an important formation forming, which could be the setup of a determined continuation. Especially when the levels confirm this will likely lead to an exaggerated price move.
When looking at the chart, we can see Ethereum is now trading within this major downtrend channel in which it already formed major bearish pressure. Furthermore, it formed a bearish EMA crossover to the downside, confirming the bearish trend. The several lower lows of the bearish trend mark the significance of this condition. Now, within the past few days, Ethereum set up to form a bear flag formation within the downtrend.
Within this bear flag formation, Ethereum already completed the initial waves A and B of the inner bear flag formation. Now with wave C, Ethereum is likely to move into the upper resistance zones. There is a major resistance zone within the upper boundaries of the channels. Several resistances come together, such as the upper boundary of the descending channel, the upper boundary of the bear flag, and the horizontal resistance line.
With a bounce into this area, which should be expected within the next times, Ethereum is entering a really crucial zone from where a pullback is highly likely. Especially when more and more whales enter the market and short sell, a pullback from this area will be an origin for bearish pressure towards the downside. The whole bear flag formation will be confirmed with a breakout below the lower boundary of the flag formation.
Once this formation has been completed, the targets as seen in my chart will be activated. From there on, a bearish continuation could also be likely if Ethereum does not manage to reverse in this area. In any case, this will be a highly important area to watch out for. Currently, it is important to consider the next phases of development and how Ethereum reacts to the resistance zones. The bearish price pressure should not be underestimated in any case.
With this being said, it is great to consider the important trades upcoming.
We will watch out for the main market evolutions.
Thank you very much for watching!

ETH/USDT — Ascending Channel CompressionETH is trading inside a well-defined ascending channel on the 4H, currently consolidating at 2316 after rejecting the 2414.56 prior high. The 2385 level is the immediate structural decision point — it held as resistance on the most recent push and price has since pulled back inside the channel without a clean reclaim.
The read across both timeframes is cautious. CVD on the 4H shows the faster line rolling over from the recent high while the slower line holds, signaling sell-side pressure building into the range. The 1H confirms this — CVD has rolled over more aggressively following the rejection at 2414, and OI is compressing at 5.14M, suggesting neither side is committed to a directional move yet.
Two scenarios from here.
Bullish: Price holds channel support, CVD stabilizes and produces a bullish cross on the 1H, and a clean reclaim of 2385 on volume triggers a continuation toward 2414 and the upper channel boundary. A CHoCH above 2385 with CVD agreement is the Gate 5 trigger.
Bearish: Failure to reclaim 2385, CVD continues lower, and a break of the ascending channel lower boundary with volume expansion signals a deeper retracement. The structural floor below sits near 2200.
No trade until the 2385 level resolves with order flow confirmation. The channel is intact. The structure has not broken. But CVD is not supporting the bull case at current price.
Waiting for the gate to open.

BTC/USDT | Towards 80k (READ THE CAPTION)By analyzing the 4H chart of BTCUSDT we can see that after reaching the high of 79,485, sweeping the liquidity above the 79,472 level, it dropped down and is currently being traded at 77,750.
As long as Bitcoin keeps itself above the 76,200 level, it is bullish in my eyes and I expect it to reach 80k level relatively soon. Before that, I'd like to see Bitcoin drop to the 4H IFVG, touching 77k again and then bounce back up to go for the Liquidity Sweep and reaching 80k.
Targets for BTC: 78,500, 79,000, 79,500 and 80,000.
However if it drops below the 4H IFVG, it could drop further below to the Bullish Breaker and then bounce back up to retest the IFVG and break above it. However if BTC drops below the 76,200 level and stabilize there, it could drop further to the 73,700 and 73,300 levels to sweep the liquidity below there.

ETH/BTC 4H📉 ETH/BTC 4H — Bearish Structure with Potential Reversal Zone ⚠️
🧠 Market Structure Overview
The chart shows a clear transition from consolidation to bearish continuation. Price initially ranged within a well-defined box, forming liquidity on both sides. After a Break of Structure (BOS) to the upside, the move failed to sustain, leading into a Change of Character (ChoCH) — signaling a shift toward bearish momentum.
🔻 Current Trend
Price is moving inside a descending channel (bearish move), respecting lower highs and lower lows — a classic downtrend structure.
📍 Key Zones
Resistance (0.0320 area): Strong supply zone where sellers previously stepped in aggressively.
Support (0.0290–0.0296 zone): Major demand area acting as a base; price is currently reacting from here.
Mid-level (~0.0301): Short-term pivot level where price is consolidating.
⚡ Current Price Behavior
Price has tapped into a demand zone and is showing early signs of stabilization. The small consolidation suggests accumulation or a potential short-term pullback.
🎯 Trade Scenario
Bullish Case 🟢:
If price holds above the demand zone and breaks minor structure → expect a retracement toward 0.0315–0.0320 (target zone).
Bearish Continuation 🔴:
Failure to hold current support → continuation of the channel toward lower liquidity (below 0.0290).
📊 Conclusion
Overall bias remains bearish, but the market is at a reaction zone, making it a critical decision point. Short-term upside is possible, but only as a corrective move unless structure shifts.

Ethereum, Clearer Outlook In The Market, Opportunities Arising!Hello, Traders Investors And Community, welcome to this update-analysis about recent events, the current price-formation, what we can expect further from ethereum and opportunities arising out of this environment. The cryptocurrency-space is sending many contrary signs at the moment where a lot of currencies looking rather weak and bearish than tradable on the long-side as bitcoin is still under solid resistance levels and in overbought conditions, the destiny of the cryptocurrency-markets is standing in the stars with a vast amount, therefore, we have to get a clearer picture and what are the possible opportunities at the moment. But there is one cryptocurrency which is showing some interesting signals at the moment which I detected that can lead to some good volatility sooner or later which is showing up in my chart and ethereums daily timeframe.
Initial Analysis According Ethereums Market-Environment (Daily Timeframe):
As we can examine now clearly is that ethereum confirmed above its support/resistance line which I pointed out in the past analysis this was an initial important step to become more bullish in the short-term which can indicate further bullishness on the middle term. As ethereum consolidates above the support-line this can lie the ground for a bullish breakout to the upside which will be confirmed when the pair crosses above the falling blue resistance line you can see in my chart. When this happens we can expect a higher high to form with a 75 % probability which will establish when the boundary crosses with good volatility to the upside, remember that this has to fulfill otherwise we can still confirm this boundary as resistance and either consolidate more in this range or fall back to bearish regions.
Furthermore, ethereum trades above the 400- and 200-EMA which are marked in orange and blue in my chart which is a more bullish sign at the moment because it is trading above them, a more bearish signal would be when ethereum trades below them similar to the situation we have seen by march this year where the worldwide global economy corona-breakowns established and caused a high volatile bearish move to the downside. Alright, this setup can be traded in the smartest way with the confirmation above the lower boundary or with confirmation of, remember that before that does not happen there is still a possibility given that ethereum weakens and turns bearish therefore we need to keep patient and wait for the market to respond in the proper way that we can take advantage of the possible opportunities arising.
In this manner, thank you for watching support for more market insight and all the best!
Trading effectively is about assessing probabilities, not certainties.
Information provided is only educational and should not be used to take action in the markets.

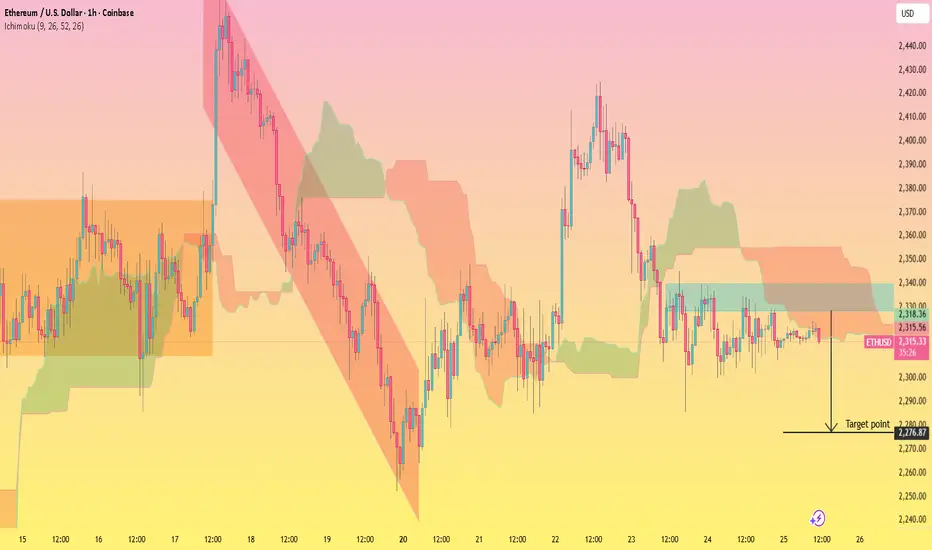
ETHUSD Bearish Range Consolidation with Downside TargetThis 1H ETHUSD chart highlights a clear **bearish trend structure** that originated from a descending channel (marked in red), where price respected lower highs and lower lows. After a strong sell-off, the market formed a temporary base and attempted a bullish push, but momentum weakened near resistance.
Currently, price is **consolidating below a key resistance zone (around 2,330 – 2,340)**, which aligns with the Ichimoku cloud acting as dynamic resistance. The repeated rejection from this area signals a lack of bullish strength, suggesting sellers are still in control.
The sideways movement indicates accumulation before a potential continuation move. If price fails to break above resistance, a bearish breakdown is likely.
**🎯 Target:**
* **Primary Target:** 2,276
* This level represents the next support zone and aligns with the projected breakdown move.
**⚠️ Key Levels to Watch:**
* Resistance: 2,330 – 2,340 (supply + cloud resistance)
* Support: 2,300 → 2,276 (breakdown zone and target)
**💡 Insight:**
As long as ETH remains below the resistance zone and inside the consolidation range, the bias stays **bearish**. A clean breakdown below 2,300 will likely accelerate selling toward the target, while a strong breakout above 2,340 would invalidate this setup.
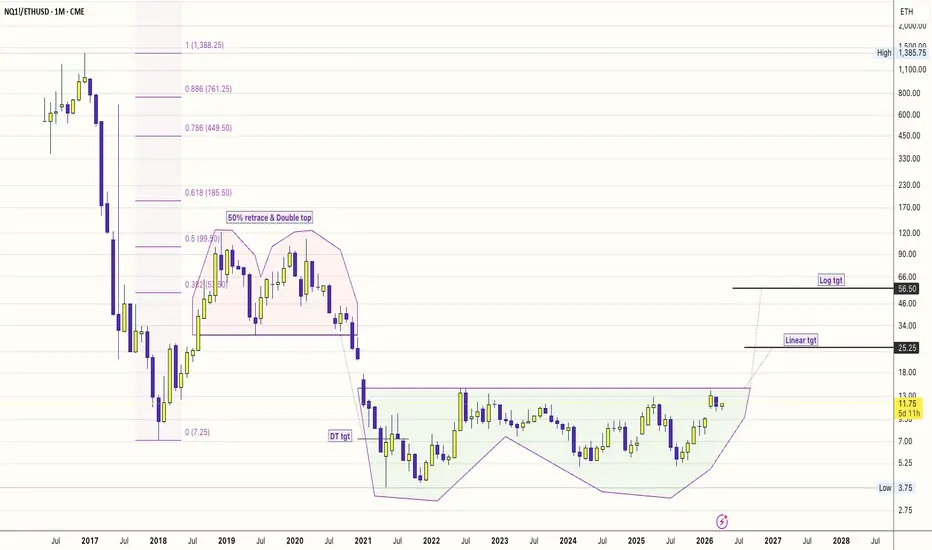
AI Infra > DeFi Infra: The 4-Year Relative Strength Breakout!1. The "Big Base" Logic
Observation: A 4-year base (2022–2026) in the NQ/ETH ratio.
This isn't just a price move; it’s a liquidity migration.
#DeFi (Ethereum) was the hero of the low-interest-rate era (2020-2021).
But in 2026, the "Real World" needs GPUs, data centers, and power grids.
The Nasdaq is the ticker for that physical reality.
The Trigger: Intel’s +24% move and Nvidia’s Blackwell dominance are the fundamental "fuel" for this technical breakout.
2. AI Infra (Hardware) vs. DeFi (Software)
The "Physical" Advantage: AI infra is now a $2.5 Trillion market.
It involves tangible assets (Chips, Fiber, Cooling).
The "Protocol" Fatigue: DeFi has become hyper-fragmented. There are too many L2s and protocols competing for the same liquidity. AI Infra, however, is a bottleneck economy—there is only so much compute to go around.
3. Key Levels
The Pivot: 13.00. A weekly close above this "Neckline" completes the 4-year U-Base.
The Targets: * Target 1 (25.25): The "Linear" target. This assumes Nasdaq continues to grow while ETH stays stagnant—a "repricing of utility."
Target 2 (56.50): The "Blue Sky" log target. This represents a world where AI agents become the primary users of the internet, making traditional human-centric DeFi secondary.
#NQ1! #ETHUSD
#NVDA, #INTC, #BTCUSD
#AIInfrastructure #RelativeStrength #DePIN #MacroEconomy #Semiconductors
In 2026, we’ve moved from "training" models to "running" them (Inference).
Running them requires constant, stable hardware—exactly what the Nasdaq companies are building.
ETH/USD BEARS WILL DOMINATE THE MARKET|SHORT
ETHUSD SIGNAL
Trade Direction: short
Entry Level: 2,321.33
Target Level: 2,141.94
Stop Loss: 2,440.47
RISK PROFILE
Risk level: medium
Suggested risk: 1%
Timeframe: 12h
Disclosure: I am part of Trade Nation's Influencer program and receive a monthly fee for using their TradingView charts in my analysis.
✅LIKE AND COMMENT MY IDEAS✅

Ethereum - Starting the 100% rally of 2026!🎀Ethereum ( CRYPTO:ETHUSD ) will double during 2026:
🔎Analysis summary:
Ethereum has been correcting over -50% after failing to create new all time highs back in 2025. But with this correction, Ethereum is now retesting a major confluence of support. Following the anticipated crypto bottom, Ethereum could then rally +100% during 2026.
📝Levels to watch:
$2,000
🙏🏻Trusting the Trading Gods

ETHUSD oversold bounce capped at 2,500 resistanceThe ETHUSD pair continues to display a bearish outlook, in line with the prevailing downward trend. Recent price action suggests an oversold bounce back, potentially setting up for another move lower if resistance holds.
Key Level: 2,500
This zone, previously a consolidation area, now acts as a significant resistance level.
A failed test and rejection at 2,500 would likely resume the bearish momentum.
Downside targets include:
2,280 – Initial support
2,190 – Intermediate support
2,120 – Longer-term support level
Bullish Scenario (breakout above 2,500):
A confirmed breakout and daily close above 2,500 would invalidate the bearish setup.
In that case, potential upside resistance levels are:
2,556 – First resistance
2,625 – Further upside target
Conclusion
ETHUSD remains under bearish pressure, with the 2,500 level acting as a key inflection point. As long as the price remains below this level, the bias favours further downside. Traders should watch for price confirmation around that level to assess the next move.
This communication is for informational purposes only and should not be viewed as any form of recommendation as to a particular course of action or as investment advice. It is not intended as an offer or solicitation for the purchase or sale of any financial instrument or as an official confirmation of any transaction. Opinions, estimates and assumptions expressed herein are made as of the date of this communication and are subject to change without notice. This communication has been prepared based upon information, including market prices, data and other information, believed to be reliable; however, Trade Nation does not warrant its completeness or accuracy. All market prices and market data contained in or attached to this communication are indicative and subject to change without notice.

SOL/USDT | Going towards 90.00As you can see, after Solana reached the 90 range, it dropped heavily to the 4H FVG and bounced back up and reached the Bearish Breaker and after hitting the Mean Threshold, it dropped yet again, but not so much as the last drop, currently it's being traded at 86.00, trying to go inside the Inversion FVG, and if it succeeds in going through it, we could see a rise to above 89.30 and then 90.70 levels to sweep the liquidities above.
Currently, I expect Solana to sweep the minor BSL at 86.66 and stabilize above the 86.50 level, which is the consequent encroachment of the IFVG, it'll go up higher towards the Bearish Breaker.
Targets: 87.00, 88.00, 89.00, 90.00.
However if Solana is rejected by the IFVG, first it could reach 84.30 level, sweeping the liquidities there and further drop to the 4H FVG High at 83.08.and finally to the 82.50.

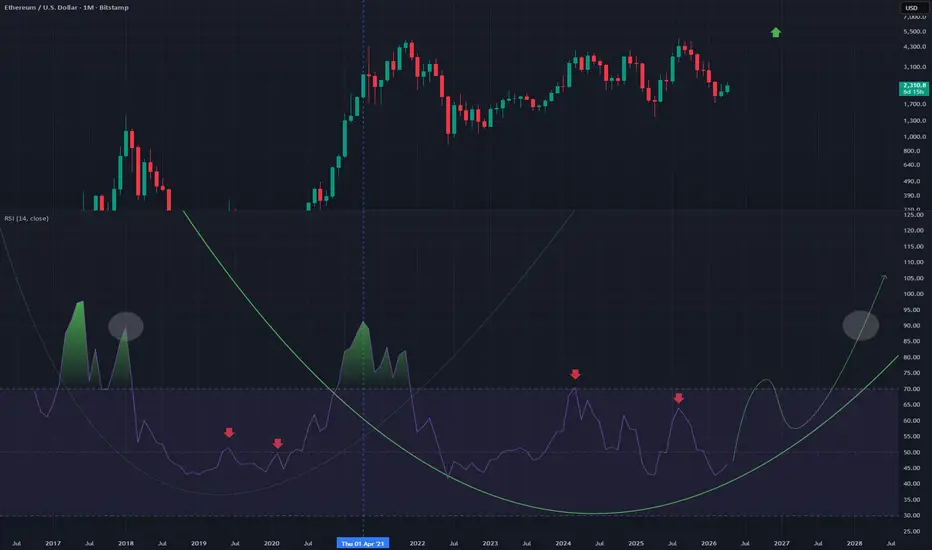
Really Watch ETHUSD RSI This is the Monthly chart for ETH
It shows however a rising RSI on this timeframe, very comparable to a previous situation on the RSI
I suggest a massive run up to complete this "u" shape pattern
Monthly timeframe remember so go long if you want to
MOVE/USDT Descending Channel: Bearish at Critical Reversal ZoneOn the 1D timeframe, MOVEUSDT is clearly moving within a Descending Channel pattern—characterized by consistent lower highs and lower lows. Price continues to respect both the upper resistance and lower support boundaries, reflecting a dominant bearish trend.
Currently, price is trading near the lower boundary of the channel, a zone that often acts as a potential area for a short-term rebound or a further breakdown if selling pressure increases.
---
📐 Pattern Explanation: Descending Channel
A Descending Channel is a bearish continuation pattern formed by two parallel downward-sloping trendlines:
Upper Trendline (Resistance): Rejects upward moves (lower highs)
Lower Trendline (Support): Acts as temporary bounce zones (lower lows)
📌 Key characteristics:
Volume often declines during formation
A breakout to the upside may signal a reversal
A breakdown to the downside confirms bearish continuation
---
📊 Key Levels on the Chart
Strong Support: 0.0167 – 0.0150
Nearest Resistance: 0.0228
Next Resistance: 0.0275
Major Resistance: 0.0315
---
🚀 Bullish Scenario
If price manages to:
Hold above the channel support (0.0167)
And break out above the upper trendline
Then the potential move:
Initial target: 0.0228
Next target: 0.0275
Optimistic target: 0.0315
📌 A valid breakout is typically supported by strong volume and a successful retest.
---
🔻 Bearish Scenario
If price:
Fails to hold the support
And breaks down below 0.0167
Then the potential:
Continuation toward 0.0150 or lower
Formation of a new bearish leg outside the channel
📌 A clean breakdown without rejection indicates strong seller dominance.
---
⚠️ Key Insight
Price is currently at a critical support zone (channel base)
This is a decision point: rebound or breakdown
Wait for confirmation before entering trades (avoid blind entries)
---
📝 Conclusion
MOVEUSDT remains under strong bearish pressure within a Descending Channel. However, the current position at the lower boundary opens the possibility for a short-term bounce. A breakout above the channel could signal the beginning of a trend reversal, while a breakdown would reinforce bearish continuation.
#CryptoAnalysis #TechnicalAnalysis #DescendingChannel #BearishTrend #CryptoTrading #AltcoinAnalysis #SupportResistance #BreakoutSetup #PriceAction

BTC/USDT | Eyeing 80k!By analyzing the 4H chart of BTCUSDT we can see that it finally managed to reach the 79k target, sweeping the liquidity above the 79,424 level, and reaching 79,472 in the meantime, and then a small correction happened, currently being traded 78,000.
I expect BTC to drop a little bit and then bounce back up from the Bullish Breaker, which means it could drop to around 76,240 level and then go back up to Sweep the Liquidity above the 79,472 level and then go higher to the 80k, 82k and 88k targets as mentioned in the previous analyses.
Targets after reaching the Bullish Breaker: 77,000, 78,000, 79,000 and 80,000.
However if BTC fails at bouncing back up after reaching the Bullish Breaker, it could drop further to the 74k level.

ETH/USDT Testing Resistance Break or Rejection Next📊 THE TECHNICAL SETUP: Waiting for Resistance Breakout
Asset: Ethereum / Tether (ETH/USDT)
Current Structure: Consolidation beneath key supply zone
Bias: BULLISH upon confirmed breakout
Trigger Level: $2,425.00 🎯
Here's the deal, legends—we're not chasing green candles like FOMO-driven degens. We're stalking a resistance breakout at $2,425 with the patience of a lion waiting for the gazelle to wander just a little too close. This level has acted as a stubborn ceiling, rejecting price multiple times. Every rejection builds more liquidity above it—stop hunts waiting to happen, short-squeeze fuel accumulating.
The Psychology: When price finally breaches $2,425 with conviction (think volume confirmation, not some pathetic wick), the shorts who've been comfortably selling this resistance will start sweating. Their stops become our rocket fuel. That's the game—understanding where the trapped traders are hiding and exploiting their eventual panic.
Entry Strategy: Any price level AFTER the confirmed breakout. No hero entries, no guessing. Wait for the candle close above resistance, wait for the retest to hold, THEN execute. Professional trading is boring—embrace it. 🥱💼
Take Profit Target: $2,550.00 ✅
Now, pay attention to this next part because it separates the pros from the pretenders. The area around $2,550 represents a zone where multiple forces converge:
Previous police force resistance (yes, I said what I said—this level has been enforcing the law on bullish ambitions)
Potential overbought conditions on lower timeframes
A classic bull trap zone where breakout chasers get REKT
This is why we take profits here. Not because we're scared, but because we're disciplined. Greed destroys accounts—ask me how I know. 🙃💸
Important Disclaimer (The "Don't Blame Me" Clause): Dear Ladies & Gentlemen of the Thief OG Society—I am NOT recommending you set only MY take profit. If you want to ride this rocket to the moon and back, that's YOUR choice. You're a grown adult with a trading account and hopefully some common sense. Make money, take money—do it at your own risk. I'm just the guy with the chart and a dream. 🌙✨
Stop Loss: $2,300.00 🛑
This is what I call the Thief SL—because if this level breaks, the market is straight-up robbing you, and it's time to escape with whatever capital you have left. This sits beneath recent structural support. A breakdown below $2,300 invalidates the bullish thesis entirely and signals that bears have seized control of the narrative.
Second Disclaimer (Repetition for Emphasis): Again, Thief OG's, I am NOT demanding you use only MY stop loss. Your risk tolerance is your business. Position sizing is YOUR responsibility. If you're risking 50% of your account on one trade, that's a you problem, not a me problem. 🧠⚡
🔗 CORRELATED PAIRS TO WATCH (Because Smart Money Watches Everything)
Ethereum doesn't trade in a vacuum, and neither should you. Here are the AMEX:USD pairs demanding your attention:
BTC/USDT (Bitcoin) — The Grand Puppeteer. BTC dominance currently dictates the entire crypto market's directional bias. When Bitcoin sneezes, Ethereum catches pneumonia. Watch for BTC's reaction at its own key levels—if BTC dumps, ETH's breakout becomes significantly less probable regardless of how pretty our setup looks. Correlation remains strongly positive.
ETH/BTC (Ethereum vs Bitcoin) — The ratio chart tells the REAL story. If ETH/BTC is trending higher alongside our breakout, that's confirmation that Ethereum is showing relative strength. If ETH breaks $2,425 but ETH/BTC is flat or falling, the move is purely BTC-driven and may lack sustainability. This is an advanced-level insight—use it wisely.
SOL/USDT (Solana) — The main L1 competitor. Solana often front-runs Ethereum moves during risk-on phases. If SOL is ripping higher while ETH consolidates, it often foreshadows ETH catching up. High-beta play with strong positive correlation to ETH price action.
MATIC/USDT (Polygon) — Leading L2 scaling solution built on Ethereum. Strong correlation to ETH fundamentals. When Polygon outperforms, it signals strength in the broader Ethereum ecosystem narrative.
LINK/USDT (Chainlink) — The oracle network that powers DeFi. LINK's performance correlates with ecosystem health. Strong LINK often precedes strong ETH as it signals institutional interest in on-chain infrastructure.
Key Correlation Insight: When all these correlated pairs align directionally, conviction increases. When divergence appears, reduce position size. Professional traders understand that conviction should scale with confluence across the ecosystem.
📰 REAL-TIME FUNDAMENTALS & ECONOMIC FACTORS (What The Market Is Actually Saying)
Alright, let's separate signal from noise. Here's the ACTUAL fundamental landscape as of mid-April 2026—not what I WANT to be true for my trade setup, but what the data actually indicates:
Institutional Flow & ETF Dynamics
U.S. spot Ethereum ETFs have recorded five consecutive days of net positive inflows, adding approximately $67.85 million on April 15 alone, led by BlackRock's ETHA. Notably, ZERO funds reported outflows during this period—a unanimous alignment suggesting institutional conviction rather than scattered interest.
Current ETH price hovers around $2,340, defending the $2,325 support zone despite these inflows. This divergence between fund flows and spot momentum is classic institutional accumulation behavior. Historically, price lags behind ETF inflows during accumulation phases before entering expansion.
On-Chain Supply Dynamics
Exchange reserves have hit 6-year lows—ETH is leaving centralized platforms and moving into cold storage and staking contracts
Over 40% of total ETH supply is now locked in staking and restaking protocols like EigenLayer
This creates a structural supply shock that retail markets appear to be underestimating
The Pectra (Glamsterdam) Upgrade Catalyst
The next major Ethereum upgrade is approaching, promising to introduce parallel transaction execution and higher gas limits. Projected throughput targets 100,000+ TPS, which would fundamentally alter Ethereum's scalability narrative. Historically, major upgrade announcements create front-running rallies in the weeks preceding implementation.
Security Infrastructure Push
The Ethereum Foundation recently launched a $1 million Audit Subsidy Program as part of their "Trillion Dollar Security Initiative." This subsidizes smart contract audits for developers building on Ethereum, reducing barriers for serious projects. This signals a maturation phase focused on hardening infrastructure for institutional-grade applications.
Institutional Price Predictions (For Context, Not Gospel)
Finder Panel Average (Year-End 2026): $5,026
Bullish Institutional Forecasts (JPMorgan, Standard Chartered): $10,000 - $12,000 range
Current Fear & Greed Index: 23 (Extreme Fear territory)
The Contrarian Signal: When institutional ETF flows are unanimously positive while retail sentiment sits in Extreme Fear, we're witnessing a textbook disbelief rally setup. Smart money accumulates during maximum pessimism.
Macroeconomic Context
Global central banks have entered what analysts describe as a "Neutral Rate" environment. Ethereum's staking yields (approximately 2.9-3.2% base, enhanced to 8-10% through restaking strategies) have become increasingly attractive compared to traditional fixed income. This "Yield Standard" narrative positions staked ETH as productive capital rather than purely speculative exposure.
🎯 FINAL VERDICT: The Professional's Playbook
Bullish Scenario: Breakout above $2,425 with volume confirmation → Target $2,550 → Extended targets possible upon reclaim of $2,586 (10-day EMA)
Bearish Risk: Failure to hold $2,300 support → Trend breakdown toward $2,200 and potentially $2,140 as bearish continuation unfolds
Current Positioning: Neutral-waiting. The edge comes from patience, not being constantly in a trade.
Remember, Thief OG's: The market doesn't owe you anything. It's a ruthless efficiency machine that transfers wealth from the impatient to the disciplined. Your job isn't to predict—it's to react with a plan. I've given you mine. Now execute yours with precision.
If this idea added value to your trading process—SMASH THAT LIKE BUTTON. Seriously, it's free and it helps more traders discover quality content. Drop a comment with your thoughts—bearish, bullish, or confused, let's discuss. And follow for more setups that blend technical edge with fundamental awareness.
Trade safe. Stack sats. Stay dangerous. 🏴☠️💎🙌
- Your favorite chart detective 🔍📉📈

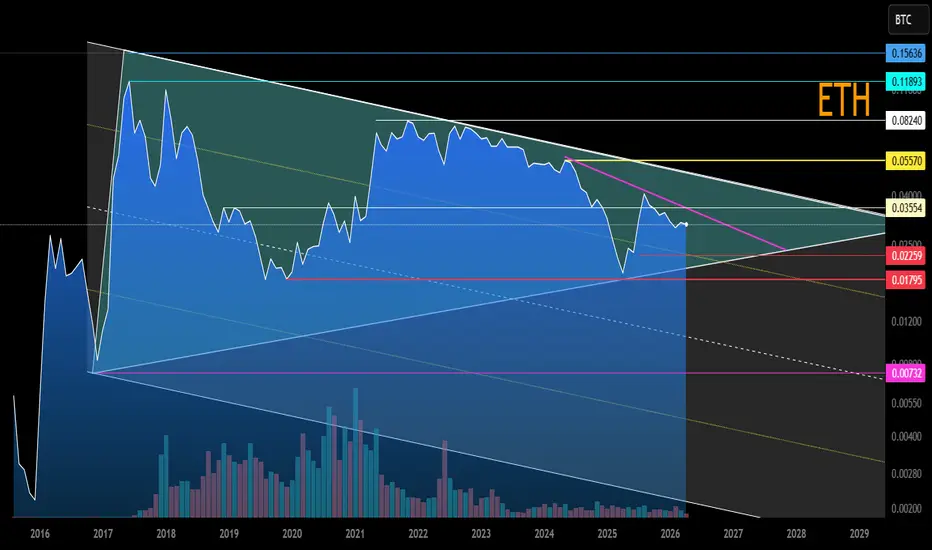
ETH/BTC Main Trend. Triangle. Reversal Zones. April 2026Logarithm. 1-month timeframe.
The entire ETH/BTC trend is shown to visualize the strength of Ethereum against Bitcoin.
A huge triangle has formed within the main trend.
The price is within the formation, currently forming a “Ross Hook” at the median, below the local descending trendline.
The key reversal zones from which the trend will form are shown.
A breakout of 0.035 means reaching the triangle's resistance. A breakout of this resistance is generally positive for the market and altcoins. Typically, when ETH is being pumped, a large group of its altcoins are also pumped.
A failure to break the local descending trendline and the local resistance level is a price drop into the lower zone of the triangle, towards its dynamic support, and a return movement to the triangle's resistance.
An extremely negative scenario (unlikely), a breakdown of the dynamic long-term support of this huge triangle, and a move of the ETH price to the channel's median. This is a low-probability scenario, but in the event of its realization (a downward breakout of the triangle), I've shown a descending channel.
ETH/USD Market Analysis📊 ETH/USD Market Analysis – Bullish Pullback Toward Demand 🚀
The chart shows a clear bullish structure on the 4H timeframe, with price respecting an ascending channel (higher highs & higher lows). However, recent price action suggests a healthy correction phase rather than a full trend reversal.
🔍 Key Observations
📈 Bullish Trend Intact
Price has been moving within a rising channel, confirming strong upward momentum.
🧱 Resistance Rejection
Price faced a sharp rejection from the marked resistance zone (~2450 area), indicating strong supply pressure at the top.
📉 Pullback to Demand Zone
Current retracement is approaching a demand zone (~2285–2255), which aligns with:
Previous structure support
Ascending trendline support
🔄 Potential Reversal Zone
The confluence of demand + trendline suggests a high-probability bounce area.
🎯 Trade Idea
🟢 Bullish Scenario (Preferred)
If price holds the demand zone:
Expect continuation toward target zone (~2450 resistance)
Confirmation needed via bullish candles / rejection wicks
🔴 Bearish Scenario (Invalidation)
If price breaks below demand + trendline:
Structure weakens
deeper correction toward lower support (~2000 zone)
🧠 Smart Insight
This looks like a classic “buy-the-dip” setup in an uptrend — but only if buyers defend the demand zone. Patience for confirmation is key.
⚡ Conclusion:
Market remains bullish overall, and this pullback could offer a strategic entry opportunity if support holds.
