ETH/USDT: Symmetrical Triangle Breakout in Progress!Hi!!!
Ethereum has finally squeezed out of its consolidation phase on the 15M chart. After days of tightening price action, the Symmetrical Triangle has resolved to the upside, signaling a return of bullish momentum.
The Technical Setup:
The Breakout: Price has decisively cleared the upper resistance of the triangle. This move marks the end of the "indecision" phase and the start of a fresh expansion.
Market Structure: We are seeing a clean push away from the apex. The immediate price action suggests buyers are aggressively stepping in to front-run the next leg up.
Resistance Flip: The previous supply zone around $2,335 is now acting as an immediate floor for this move.
Targets in Sight:
🎯 Target 1: $2,351 (The primary measured move of the triangle).
🎯 Target 2: $2,360
ETH

The Ether Bull & New ATH · EMA13 Conquered · $3,730 Next!The 2025 bullish cycle really intensified once Ether moved weekly above EMA13. As soon this happened, ETHUSDT experienced sustained bullish action for months.
The bullish wave ended August 2025 with a test of EMA13 as support in September, then again October. When EMA13 broke as support, we saw months of bearish action.
The bearish period wasn't straight down, there was some relief in late 2025 until January 2026. In January, all growth stopped as soon as ETH faced EMA13 as resistance. Just one challenge of this level and a crash from $3,400 ended at $1,750, showing how important EMA13 is to determine mid-term price action.
After almost three months of consolidation, recovery and accumulation at bottom prices, after the 6-Feb low, ETHUSDT managed last week to move and close above EMA13, giving us the strongest bullish signal of all. This opens the doors for massive growth.
Just as in October 2025 a break below this level led to four months of bearish action; a break above in April 2026 can lead to several months of bullish action. All that is needed is a follow through this week.
If bulls/buyers show up at current prices, ~$2,400, we can expect a fast and sudden advance toward $3,730. That's our next target.
ETHUSDT just closed four consecutive weeks green after a long-term higher low. The path is open for a new all-time high long-term, and maximum growth short-term.
Thanks a lot for your continued support.
Namaste.

ETHEREUM - Huge Elliott Waves Formation Ethereum is currently approaching the final stage of a global accumulation phase, structured as a complex W–X–Y–X–Z correction , which began after the breakdown of the previous impulsive cycle (1–5) and the following ABC corrective move.
Macro Structure: After the completion of the bullish impulse (1–5), the market transitioned into a corrective regime, forming an extended and complex structure rather than a simple pullback:
The initial decline formed an ABC correction, marking the shift from trend to accumulation
This was followed by a broader WXYXZ formation, typical for prolonged accumulation phases in high-timeframe markets
The final Z-leg acted as a liquidity sweep, breaking below prior structure and forcing capitulation
Formation of the Current Range: The bottom formation (WXYXZ) created a structural floor, from which the current range developed. Since then:
Price has been consolidating within a rising channel / range
Volatility has been compressing under a major resistance zone
Market behavior aligns with re-accumulation rather than distribution
This suggests that the market is absorbing supply, not distributing it.
XY Development: From the upper resistance zone, price formed a corrective XY structure, which is critical for understanding current positioning:
Wave X → Y defined the internal corrective leg within the broader accumulation
The Y wave established a key support trendline (dynamic support)
This trendline is currently being respected, with price bouncing directly from it
This reaction confirms that the structure remains technically valid and buyers are defending higher lows within the range.
In conclusion , Ethereum appears to be in the final stage of a prolonged accumulation phase, where a completed correction and a well-defined structural support are now supporting the price. This combination suggests that the current consolidation is more likely a phase of compression before expansion rather than distribution. As long as key support levels hold, the chances of going up are much higher, with a breakout above resistance potentially marking the beginning of a new impulsive leg in the cycle.

APRIL 27 Bitcoin chart analysisHello
It's a Bitcoin Guide.
My analysis is optimized for TradingView.
If you press the Replay button, you can check real-time movements.
This is the Bitcoin 30-minute chart.
*Long Position Strategy based on the movement path of the red finger
1) $77,556.3 Long Position Entry Zone / Stop Loss if broken below the green support line
2) $79,100.1 Long Position 1st Target -> Good 2nd Target Price
If broken below the green support line
Bottom at the bottom -> Up to Zone 1 is open.
Please use my analysis post merely as a reference and for practical application.
I hope you operate safely by strictly adhering to trading principles and using stop losses as a mandatory measure.
Thank you.

Ethereum Faces Heavy Confluence ResistanceEthereum is currently trading into a key resistance zone, where multiple technical levels are aligning and acting as a strong barrier to further upside. Price is now at a critical decision point, with the next move likely to define short-term direction.
Key Highlights:
- Resistance confluence with Daily level + VWAP + VAH 🔺
- Rising price on declining volume signals कमज weak momentum 📉
- Rejection here opens downside toward lower support levels ⚠️
From a technical standpoint, this region represents a high-probability reaction zone. The combination of a strong daily resistance level, VWAP, and Value Area High (VAH) creates a cluster of supply that typically requires strong bullish volume to break through. So far, that volume has been lacking.
The recent rally into this resistance has occurred on declining volume, which is often a warning sign that buying pressure is fading. This type of divergence suggests that the move higher may not be sustainable and could be driven by weaker market participation.
If Ethereum fails to reclaim and hold above this confluence zone, it significantly increases the likelihood of a rejection. In that case, a corrective move toward lower support levels becomes the more probable scenario, keeping the broader range structure intact.

APRIL 24 Bitcoin chart analysisHello
It's a Bitcoin Guide.
My analysis is optimized for TradingView.
If you press the Replay button, you can check real-time movements.
This is the Bitcoin 30-minute chart.
On the left, marked with the purple finger, I have connected the strategy exactly to the entry point of the long position I entered yesterday, 77.2K.
*The long position strategy is based on the time before and after touching section #1 marked with the purple finger at the top.
-Please pay close attention as there are many sections to explain today.
1) After confirming the touch of the purple finger at Zone 1 at the top,
At the bottom, the red finger indicates the entry zone for the $77,174.9 long position / Stop-loss price if the green support line is broken.
2) $79,274 long position 1st target -> Target prices in the order of Good, Great.
(If the rise is successful, refer to the expected path indicated by the pink finger in the middle.)
*If the price drops immediately without touching the purple finger at Zone 1:
At the bottom, Zone 2 indicates the entry zone for the $76.1K long position / Stop-loss price if the green support line is broken.
The stop-loss price is the same for those maintaining the $77.2K long position entered yesterday.
If the green support line at Zone 2 is broken,
the price may drop from the Bottom to Zone 3 over the weekend, so please exercise caution.
- Currently, a MACD dead cross is in progress on the 12-hour chart.
If the purple support line is maintained without breaking,
the warning signal will be ignored, and a vertical surge may occur.
Please use my analysis merely for reference and practical application.
I hope you operate safely by adhering to trading principles and strictly using stop-loss orders.
Thank you.

Bullish bounce off pullback support?Ethereum (ETH/USD) is falling towards the pivot, which is a pullback support that aligns with the 50% Fibonacci retracement and could bounce towards the 1st resistance.
Pivot: 2,164.55
1st Support; 1,947.06
1st Resistance: 2,621.89
Disclaimer:
The opinions given above constitute general market commentary and do not constitute the opinion or advice of IC Markets or any form of personal or investment advice.
Any opinions, news, research, analyses, prices, other information, or links to third-party sites contained on this website are provided on an "as-is" basis, are intended to be informative only, and are not advice, a recommendation, research, a record of our trading prices, an offer of, or solicitation for, a transaction in any financial instrument and thus should not be treated as such. The information provided does not involve any specific investment objectives, financial situation, or needs of any specific person who may receive it. Please be aware that past performance is not a reliable indicator of future performance and/or results. Past performance or forward-looking scenarios based upon the reasonable beliefs of the third-party provider are not a guarantee of future performance. Actual results may differ materially from those anticipated in forward-looking or past performance statements. IC Markets makes no representation or warranty and assumes no liability as to the accuracy or completeness of the information provided, nor any loss arising from any investment based on a recommendation, forecast, or any information supplied by any third party.

ETHEREUM: Historical and Huge Triangle, +300% Breakout Incoming!Hello There,
welcome to my new analysis about Ethereum from a broader timeframe perspective. Although there are still crucial bearish signs on the local timeframe, which should not be underestimated, the longer-term perspective is rather differentiated. Before moving into this dynamic, it should be said that Ethereum did not break its established trend since 2020. The price action of Ethereum managed to form several higher highs within the structure. Now, there is a major underlying formation that could be the origin of historical price moves.
As when looking at my chart, we can watch Ethereum solidly stabilize within this major range between $1000 and $3000. The $1000 mark is a highly important psychological support level. Above this level, Ethereum is now continuing to finalize this gigantic ascending triangle formation. Within this formation, Ethereum is developing a crucial wave count, of which waves A and B have already formed. Now it is continuing to complete the wave C within this whole structure. Within the local frame of the wave C, Ethereum is forming a bear flag within the descending channel.
Once the price action reaches the lower boundaries of the gigantic triangle formation, there are major underlying supports. Also determined by the 100-EMA marked in green and the 50-EMA marked in blue. Once Ethereum reaches out to these zones, there is a bounce and stabilization highly likely. Especially when the whole wave count from A to C has finalized, this will confirm the origin of a stable bounce within this area. In this case it is highly necessary that Ethereum does not break below the lower boundary because this could invalidate the triangle.
For now it seems as though there will be no such invalidation. Once Ethereum has the ability to break out above the upper boundary of this huge triangle, it will confirm the continuation setup. In this case a mere 300% bounce and expansion into the bullish direction is highly likely. As seen in my chart, the bullish targets will be active once Ethereum has completed the whole triangle formation. Also, there are other factors that make such a price action likely, such as the growing institutional adoption. Besides, Ethereum reached record-high stablecoin transfers of over $8T.
The next times will be extremely decisive, and everything depends on how the environment of Ethereum continues to develop. This will be extremely important for the forthcoming of the whole formational structure. In any case, the historical and influential price changes should not be underestimated in any case.
With this being said, it is great to consider the important trades upcoming.
We will watch out for the main market evolutions.
Thank you very much for watching!

ETHEREUM: Crucial Formation, Important Levels to Watch!Hello There,
on the short-term perspective Ethereum is forming crucial bearish pressure which could be decisive within the near future. While Ethereum remains the second largest cryptocurrency, it is recently forming crucial formations that should not be underestimated. In the past weeks, trading actions already showed major selling pressure occurred from whales dropping their ETH on the market. Now, there is an important formation forming, which could be the setup of a determined continuation. Especially when the levels confirm this will likely lead to an exaggerated price move.
When looking at the chart, we can see Ethereum is now trading within this major downtrend channel in which it already formed major bearish pressure. Furthermore, it formed a bearish EMA crossover to the downside, confirming the bearish trend. The several lower lows of the bearish trend mark the significance of this condition. Now, within the past few days, Ethereum set up to form a bear flag formation within the downtrend.
Within this bear flag formation, Ethereum already completed the initial waves A and B of the inner bear flag formation. Now with wave C, Ethereum is likely to move into the upper resistance zones. There is a major resistance zone within the upper boundaries of the channels. Several resistances come together, such as the upper boundary of the descending channel, the upper boundary of the bear flag, and the horizontal resistance line.
With a bounce into this area, which should be expected within the next times, Ethereum is entering a really crucial zone from where a pullback is highly likely. Especially when more and more whales enter the market and short sell, a pullback from this area will be an origin for bearish pressure towards the downside. The whole bear flag formation will be confirmed with a breakout below the lower boundary of the flag formation.
Once this formation has been completed, the targets as seen in my chart will be activated. From there on, a bearish continuation could also be likely if Ethereum does not manage to reverse in this area. In any case, this will be a highly important area to watch out for. Currently, it is important to consider the next phases of development and how Ethereum reacts to the resistance zones. The bearish price pressure should not be underestimated in any case.
With this being said, it is great to consider the important trades upcoming.
We will watch out for the main market evolutions.
Thank you very much for watching!

ETH/USDT — Ascending Channel CompressionETH is trading inside a well-defined ascending channel on the 4H, currently consolidating at 2316 after rejecting the 2414.56 prior high. The 2385 level is the immediate structural decision point — it held as resistance on the most recent push and price has since pulled back inside the channel without a clean reclaim.
The read across both timeframes is cautious. CVD on the 4H shows the faster line rolling over from the recent high while the slower line holds, signaling sell-side pressure building into the range. The 1H confirms this — CVD has rolled over more aggressively following the rejection at 2414, and OI is compressing at 5.14M, suggesting neither side is committed to a directional move yet.
Two scenarios from here.
Bullish: Price holds channel support, CVD stabilizes and produces a bullish cross on the 1H, and a clean reclaim of 2385 on volume triggers a continuation toward 2414 and the upper channel boundary. A CHoCH above 2385 with CVD agreement is the Gate 5 trigger.
Bearish: Failure to reclaim 2385, CVD continues lower, and a break of the ascending channel lower boundary with volume expansion signals a deeper retracement. The structural floor below sits near 2200.
No trade until the 2385 level resolves with order flow confirmation. The channel is intact. The structure has not broken. But CVD is not supporting the bull case at current price.
Waiting for the gate to open.

4H ETH/USDT📊 Context
Short-term trend: downward / consolidation under resistance
Structure: lower highs → classic supply pressure
You have a downward trendline drawn and it's working correctly
🔑 Key levels
🟢 Resistance:
2312 – current local struggle zone
2341 – mid-range / often reacts
2387 – main resistance (recent rejections)
🔴 Support:
2247
2218 – 2209 (important demand zone)
2159 (if everything lets up – next target)
📉 What just happened?
Strong upside breakout → rejection on the trendline
Quick dump → failure to maintain bullish structure
Currently: pullback after a downward impulse
This looks like:
👉 Fake breakout + continuation of the downtrend
📊 Indicators
Stoch RSI:
Coming off overbought → Downward momentum
Not yet at an extreme low → room for further decline
MACD:
Red histogram
MACD line reversing down
👉 Bearish signal
🧠 Scenarios
🔴 Scenario 1 (more likely):
Continuation of downtrend
Rejection from 2312–2320 → drop to:
2247
then 2210
👉 If 2210 breaks → quick move to 2160
🟢 Scenario 2:
False dump + bounce
Condition:
Return above 2312
Retest as support
Then:
Target: 2341 → 2387
But until it breaks the trendline → it's just a bounce.
⚠️ The most important thing:
As long as the price is below the downtrend line:
👉 you're shorting/selling the rally

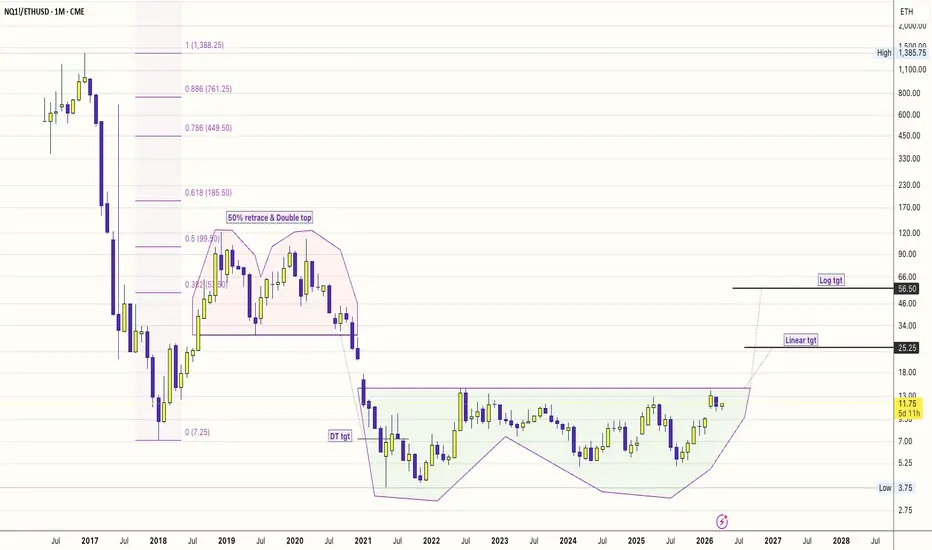
AI Infra > DeFi Infra: The 4-Year Relative Strength Breakout!1. The "Big Base" Logic
Observation: A 4-year base (2022–2026) in the NQ/ETH ratio.
This isn't just a price move; it’s a liquidity migration.
#DeFi (Ethereum) was the hero of the low-interest-rate era (2020-2021).
But in 2026, the "Real World" needs GPUs, data centers, and power grids.
The Nasdaq is the ticker for that physical reality.
The Trigger: Intel’s +24% move and Nvidia’s Blackwell dominance are the fundamental "fuel" for this technical breakout.
2. AI Infra (Hardware) vs. DeFi (Software)
The "Physical" Advantage: AI infra is now a $2.5 Trillion market.
It involves tangible assets (Chips, Fiber, Cooling).
The "Protocol" Fatigue: DeFi has become hyper-fragmented. There are too many L2s and protocols competing for the same liquidity. AI Infra, however, is a bottleneck economy—there is only so much compute to go around.
3. Key Levels
The Pivot: 13.00. A weekly close above this "Neckline" completes the 4-year U-Base.
The Targets: * Target 1 (25.25): The "Linear" target. This assumes Nasdaq continues to grow while ETH stays stagnant—a "repricing of utility."
Target 2 (56.50): The "Blue Sky" log target. This represents a world where AI agents become the primary users of the internet, making traditional human-centric DeFi secondary.
#NQ1! #ETHUSD
#NVDA, #INTC, #BTCUSD
#AIInfrastructure #RelativeStrength #DePIN #MacroEconomy #Semiconductors
In 2026, we’ve moved from "training" models to "running" them (Inference).
Running them requires constant, stable hardware—exactly what the Nasdaq companies are building.
$ETH vs $NVDA: The "World Compute" 0.886 Reality Check📉📉📉
The "World Computer" narrative is meeting the 0.886 Fibonacci reset.
While Ethereum ( CRYPTOCAP:ETH ) struggles to clear its $2k ceiling.
The actual compute leader powering 80% of #AI
( NASDAQ:NVDA ) has crushed it in relative price performance.
Ironic since Ethereum used to be mined on NVDIA GPU's !!!
The Setup: We are tracking a deep 0.886 retracement in the ETH/NVDA ratio, a level traditionally seen as the "capitulation zone" for underperforming assets.
Analysis: The AI explosion "real-world compute" has drained liquidity from speculative crypto layers.
Target: Watching for a structural bottom at the 0.886 reset level to see if the "World Computer" can finally find a bid against the hardware king.
Going forward... once achieved
ETH may only do well to simply retest the Double top neckline.

APRIL 23 Bitcoin chart analysisHello
It's a Bitcoin Guide.
My analysis is optimized for TradingView.
If you press the Replay button, you can check real-time movements.
This is the Bitcoin 30-minute chart.
Currently, a MACD Dead Cross is in progress on the 4-hour chart, and there are no separate Nasdaq indicator releases.
*Based on the movement path of the light blue finger, this is a two-way neutral strategy.
1. $780,43.6: Entry point for short position / Stop loss if the pink resistance line is broken.
2. $772,02.6: Switch to long position / Stop loss if the green support line is broken.
3. Top zone 1st target price -> Good zone 2nd target price.
- If the price drops immediately without touching $780,43.6 at the top,
this is a final long waiting strategy at the Bottom zone.
If the light blue support line in the Bottom zone is broken,
the price could fall up to zone 1.
Please use my analysis post merely as a reference and for practical application.
I hope you operate safely by strictly adhering to trading principles and using stop-losses as a necessity.
Thank you.

eth to reclaim the upwards momentum #eth i propose eth is having a small pull back and still with in upwards bullish momentum, to reclaim the blue upward channel and head toward 3400 over the next upand coming days , this supports spot trading and interday trading with low leverage . #eth
I am not a financial advisor , this is my thoughts i like to share, and the direction i am trading

APRIL 21 Bitcoin chart analysisHello
It's a Bitcoin Guide.
My analysis is optimized for TradingView.
If you press the Replay button, you can check real-time movements.
This is the Bitcoin 30-minute chart.
*Long Position Strategy based on the movement path of the red finger
1) $76,398.6 Long Position Entry Zone / Stop Loss if broken below the green support line
2) $78,795 Long Position 1st Target -> Good 2nd Target
It is an uptrend if broken below the orange resistance line.
If broken below the green support line, it is a Bottom -> The area up to zone 1 is open.
That is all, Please use my analysis post solely for reference and practical application.
I hope you operate safely by strictly adhering to trading principles and using stop losses as a necessity.
I will see you on Thursday.
Thank you.

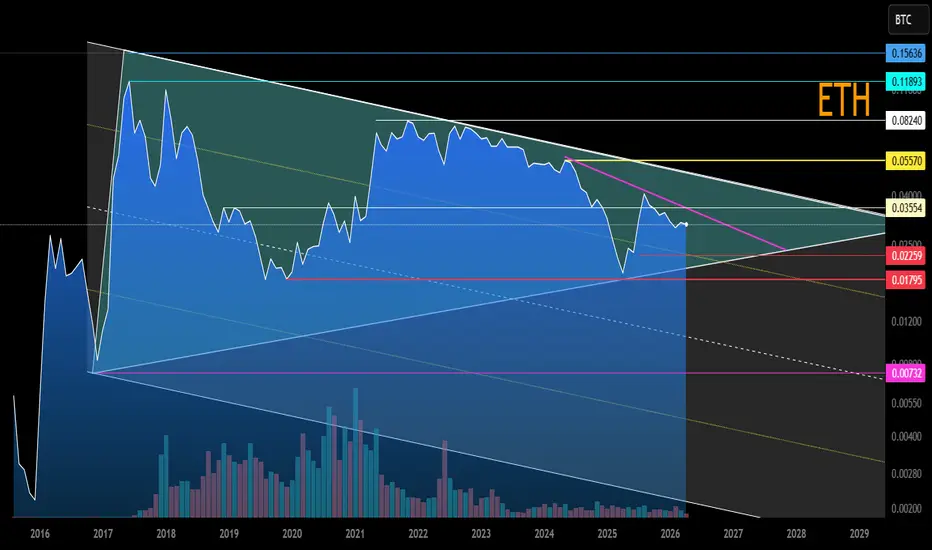
ETH/BTC Main Trend. Triangle. Reversal Zones. April 2026Logarithm. 1-month timeframe.
The entire ETH/BTC trend is shown to visualize the strength of Ethereum against Bitcoin.
A huge triangle has formed within the main trend.
The price is within the formation, currently forming a “Ross Hook” at the median, below the local descending trendline.
The key reversal zones from which the trend will form are shown.
A breakout of 0.035 means reaching the triangle's resistance. A breakout of this resistance is generally positive for the market and altcoins. Typically, when ETH is being pumped, a large group of its altcoins are also pumped.
A failure to break the local descending trendline and the local resistance level is a price drop into the lower zone of the triangle, towards its dynamic support, and a return movement to the triangle's resistance.
An extremely negative scenario (unlikely), a breakdown of the dynamic long-term support of this huge triangle, and a move of the ETH price to the channel's median. This is a low-probability scenario, but in the event of its realization (a downward breakout of the triangle), I've shown a descending channel.
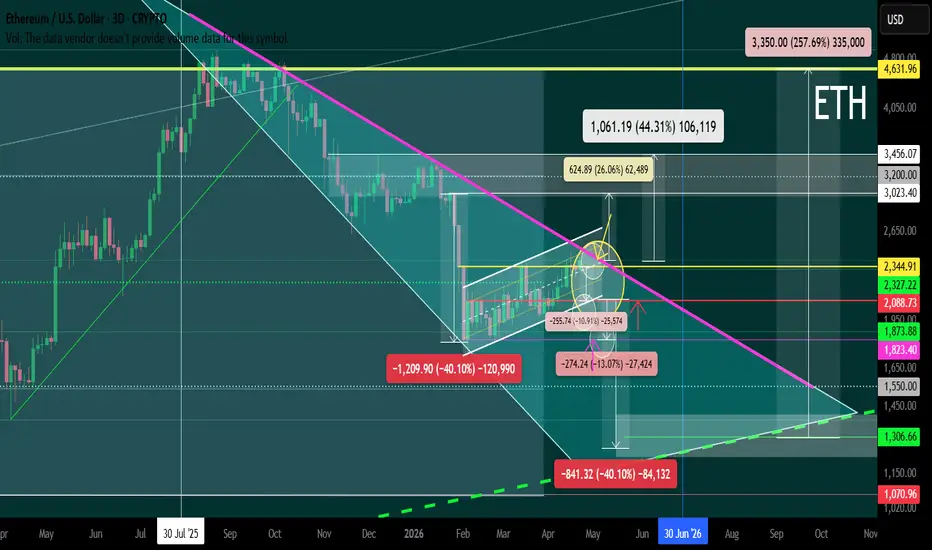
ETH/USD Local Trend. Reversal Zone. 04 2026Logarithm. 3-day time frame.
Main trend — ascending channel .
Secondary trend — horizontal channel.
Local trend — “microphone” pattern (a decline in an expanding cone toward the median of an ascending channel).
Very local — ascending channel toward the resistance of the microphone. In case of a breakout:
a) upward — a sloping pump cup toward the previous consolidation and slightly higher.
b) in case of a downward breakout — a descending pennant.
As always, all percentages from key reversal zones to key support/resistance zones are shown. Have a trading plan and manage your risks; don't exceed them. Be patient; the market doesn't owe you anything...
You can see this local reversal zone on the scale of the main trend of this banking-crypto asset in this previous idea by clicking the “play” button on the chart.
$RUNE About To Explode? Massive 50x Setup Hidden In This Entry ZCRYPTOCAP:RUNE About To Explode? Massive 50x Setup Hidden In This Accumulation Zone
1️⃣ Price is trading inside a macro descending channel since ATH, with continuous lower highs and lower lows intact
2️⃣ Currently sitting in a strong HTF demand / Accumulation zone (~$0.45–$0.32), historically reactive base
3️⃣ Recent move shows breakdown → retest → continuation, confirming prior S/R flip near ~$0.95
4️⃣ Structure compression inside falling channel → volatility contraction phase, expansion pending
5️⃣ Clean confluence: Channel support + Horizontal demand + deviation below value area
Key Level to Watch: Reclaim of ~$0.95 (HTF S/R) → Confirmation of bullish market structure shift
High Risk Accumulation Zone: $0.45–$0.32
Targets (HTF Expansion Path): $1 | $1.5 | $3 | $6 | $21 (ATH Retest Zone)
Invalidation: Sustained HTF close below ~$0.30 → Breakdown of macro demand
Deep discount zone + prolonged accumulation under resistance = asymmetric upside opportunity if structure flips.
Current phase favors smart money accumulation, not momentum chasing.
NFA & DYOR

ETH – Correction Nearing Completion?ETH has been in a clear bearish trend, printing strong impulsive moves to the downside.
Currently, price is in a correction phase, moving within a rising channel — typical behavior before continuation.
Now ETH is approaching the upper bound of this corrective structure.
This is where things get interesting 👇
As long as this channel holds, we will be expecting the bears to step back in and take control, aiming for a continuation to the downside.
Bearish trend + corrective rally = potential short opportunity.
Correction first… then continuation.
Will ETH roll over from here?
⚠️ Disclaimer: This is not financial advice. Always do your own research and manage risk properly.
📚 Stick to your trading plan regarding entries, risk, and management.
Good luck! 🍀
All Strategies Are Good; If Managed Properly!
~Richard Nasr

ETH/USDT: Trend Breakdown and Bearish Continuation StrategyHi!
The technical landscape has shifted decisively. While we always keep an eye on the $2,355 "breakout or bust" level, the weight of the evidence is now heavily skewed to the downside. The market has signaled a fundamental shift in character, moving from a trend of higher lows to a structural breakdown.
The Bearish Thesis: Why Downside is the Priority
The probability of a move toward our lower targets has increased significantly due to three specific technical failures:
The "Engulfed" Concept: The fact that price has traded through and engulfed the previous support level is a major red flag. This isn't just a wick; it’s a total neutralization of the buy-side liquidity that was holding the trend together. Once a level is engulfed like this, it typically converts into a "supply wall" that prevents the price from recovering.
Trendline Invalidation: The primary ascending trendline—the backbone of the recent rally—is now officially broken. We are no longer in a bullish trend; we are in a bearish expansion phase.
Failed Recovery: The rejection at the green box shows that the bulls don't have the strength to reclaim the broken structure. Every attempt to move higher is being met with aggressive selling.
Execution Plan: Focus on the Targets
Primary Target ($2,200): This is the first major area of interest. Given the velocity of the trendline break, we expect a move toward this zone to test the strength of the remaining buyers.
Secondary Target ($2,140): This is the high-conviction target. If the $2,200 level doesn't provide a significant bounce, the "engulfed" momentum will likely carry us straight into this deeper demand pocket.
Strategy Summary
The market has spoken: the trend is now bearish. Unless we see a sudden and high-volume surge that closes above $2,355, we are strictly looking for downside continuation. Manage your risk accordingly and don't fight the new trend—the move toward $2,200 and $2,140 is the high-probability play here.

Ethereum Daily · Back To Basics: EMA55On 17-April Ethereum hit a high of $2,465, to reach a nice 41% growth since the 6-Feb low. This is a very strong recovery so far.
I can remember vividly those days when I was saying, "Ethereum is a strong buy below $2,000." It is not possible to buy Ether below $2,000 anymore but thank God the chart shows plenty of room available for additional growth.
EMA55 is a very strong moving average on the daily timeframe, it can make all the difference. This level was first conquered 7-April, two weeks ago. The moment ETH managed to move above, it never moved back below. This is the bullish confirmation.
The level was tested four times after the bullish break. Now it is working as support as Ethereum moves even higher. Today, we are seeing the confirmation of EMA89 on the daily timeframe.
We looked at the monthly and weekly charts. We look at the MACD, Stochastic and RSI. We looked at hundreds of projects throughout the entire altcoins market. Not one bearish, everything points up. When we zoom out, zoom in or anything, all timeframes, all indicators, everything says higher and that's exactly what is happening.
ETHUSDT is set to hit a target of $3,700 in the coming weeks, can be sometime next month. The next jump can open $2,800 or $3,000 easily.
While the recovery has been good, we still need to erase the late January sudden flush. Here we get the "mirror image." A fast crash tends to be balanced by a strong rise.
Bullish momentum has been building up for months. This force can no longer be contained. Ethereum will shoot up and it will be a fast rise. Late January/early February but in reverse. Bitcoin trading close to $85,000, Ether above 3K.
Thank you for reading.
Namaste.

ETH 3H — CHoCH Confirmed at OTE, TP1 and TP2 MappedETH 3H — CHoCH Confirmed at OTE, TP1 and TP2 Mapped
Description:
The structure on ETH 3H is clean.
BOS confirmed the directional intent. Price retraced into the OTE zone between the 0.236 and 0.382 Fibonacci levels. CHoCH printed at the circled candle — the exact location where the framework demands confirmation before entry.
That retracement was not weakness. It was the institutional entry zone doing exactly what it is supposed to do.
From here the targets are mapped.
TP1: 2,462 — the liquidity level where the prior sweep originated.
TP2: 2,542 — upper channel extension with macro liquidity resting above.
Invalidation: 3H close below the CHoCH level. Below that, the OTE zone has failed and the read is off.
The Fed liquidity injection is the macro catalyst. The structure provided the entry logic. Both aligned simultaneously.
That is what a confluence setup looks like before the move, not after.
