Bitcoin Rally Failed Near the Top — Is a Bigger Drop Next?As I expected at the start of the week—just like I mentioned in the previous daily timeframe post — Bitcoin ( BINANCE:BTCUSDT ) began to decline from around the resistance lines, resistance zone($79,500-$78,750), and the 21_SMA(Weekly). In recent hours, this decline has been continuing with solid momentum.
From a classical technical analysis standpoint, it looks like Bitcoin, on the 4-hour timeframe, is forming an Adam & Adam Double Top Pattern(AADT) —one of the valid types of double-top patterns. A notable sign is that the right top is approaching the neckline with strong momentum, which adds to the pattern’s reliability.
From an Elliott Wave Theory perspective, it seems Bitcoin has completed its main wave 4 right near the resistance lines.
Also, we can see a negative Regular Divergence(RD-) between the last two peaks.
Since the S&P500 index ( FX:SPX500 ) is near its all-time highs, we must also keep an eye on it. If the S&P corrects from these highs, Bitcoin’s decline could be amplified due to their correlation. This increases the likelihood of further downside.
I expect that after breaking the support zone ($77,160-$76,740) and the neckline, Bitcoin could drop at least to around $74,900. If the downward momentum is strong, we could look for lower targets.
Target: $74,900
Stop Loss: $81,000(Worst)
Cumulative Short Liquidation Leverage: $80,100-$79,540
Cumulative Long Liquidation Leverage: $76,980-$76,200
Cumulative Long Liquidation Leverage: $74,500-$73,500
CME gap: $84,560-$79,660
CME gap: $69,535-$70,055
CME gap: $67,570-$67,170
What’s your view on Bitcoin? Could it push toward $80,000, or should we anticipate a deeper correction?
💡 Please respect each other's opinions and express agreement or disagreement politely.
📌Bitcoin Analysis (BTCUSDT), 4-hour time frame.
🛑 Always set a Stop Loss(SL) for every position you open.
✅ This is just my idea; I’d love to see your thoughts too!
🔥 If you find it helpful, please BOOST this post and share it with your friends.
Double Top or Bottom

Is Retail Vs Whales Signaling A Dangerous Crypto Setup?The crypto market often looks strongest right before it turns. Prices rise, optimism spreads, and retail participation surges rapidly. Many investors see this as confirmation of a bullish trend. However, beneath the surface, a different story begins to unfold. The current whale vs retail dynamic suggests something unusual. Retail investors aggressively enter positions while large holders remain inactive. This imbalance does not happen randomly. It has historically appeared before major market corrections.
Market cycles reward those who understand behavior, not just price. Retail investor behavior often follows emotion, while whales act with strategy. When these two groups move in opposite directions, the signal becomes too strong to ignore. The latest crypto market divergence reflects this exact pattern. Retail demand increases sharply, yet whale activity declines. This setup has repeated across multiple Bitcoin cycles. Each time, it has led to significant downside moves.
Why Whale Vs Retail Dynamics Matter More Than Price
Price action alone does not reveal the full story. Market structure depends heavily on who drives the movement. Retail traders bring momentum, but whales bring sustainability. The whale vs retail relationship defines market strength. When whales accumulate, rallies tend to last longer. When retail dominates, volatility increases and reversals become likely.
Large holders control liquidity and direction. They do not chase trends. Instead, they position early and exit quietly. This behavior creates a crypto market divergence that signals potential weakness. Retail traders often interpret rising prices as confirmation. They enter late, expecting continuation. However, whales already prepare for the opposite outcome. This disconnect creates risk.
Retail Investor Behavior Is Driving The Current Rally
Retail investor behavior shows clear signs of aggressive buying. Social sentiment rises, leverage increases, and new participants enter quickly. These signals often appear near market peaks. Retail traders tend to follow trends rather than anticipate them. They react to price movements instead of analyzing underlying flows. This approach works during early rallies but fails during late-stage moves.
The current surge in retail participation reflects strong confidence. However, confidence alone does not sustain markets. Without whale support, rallies lose strength over time.
Are Retail Traders Becoming Exit Liquidity Again
The concept of exit liquidity defines many market tops. Whales distribute assets to late buyers. Retail unknowingly absorbs this supply. The current whale vs retail setup raises this concern again. Retail investors enter aggressively while whales reduce involvement. This behavior matches previous distribution phases.
Retail investor behavior often repeats across cycles. Fear drives selling during lows, while greed drives buying during highs. Whales exploit this pattern. This does not mean an immediate crash. Markets can stay irrational longer than expected. However, the risk increases significantly under these conditions.
Final Thoughts on Whale Vs Retail
Understanding the Bitcoin correction signal requires attention to key metrics. Whale accumulation data, exchange flows, and leverage ratios provide valuable insights. Traders should not rely solely on price trends. The underlying crypto market divergence tells a more accurate story. Ignoring it increases exposure to sudden reversals.
Risk management becomes critical during these phases. Position sizing, stop losses, and patience help navigate uncertainty. Emotional decisions often lead to losses. Retail investor behavior will likely remain aggressive. However, smart money already adjusts positioning. This difference defines the next move.

BTC UPDATE (4H)Bitcoin is facing both technical and fundamental problems.
The barrier around $80K has not been breached after many attempts.
That's not a good sign.
Moreover, a five wave impulse move might be coming to an end.
There is also a double top formation is forming at the moment.
The USA has also started new military assignments around the Middle East, which is not good news for global tension.
Below the $77,150 level, it's a clear short.

USDCAD: Major Trendline Break & Support LossKey Technical Details
Trend Reversal : The chart features a steep black trendline that tracked a long-term rally. The price has clearly broken below this line, signaling that the previous bullish momentum has ended. 📉
💹 Support Breakdown: There are two horizontal white lines marking key price zones. The price has just sliced through the upper support level (around 1.3650). 🔓
💹 Price Target: A large white arrow points downward from the broken support toward the lower support level (near 1.3550), suggesting a bearish target for the current move. 🎯
💹 Current Price: The red horizontal dashed line shows the current price at 1.36150, confirming the breakout is active. 📍
Analyzing the Move
💹To understand what might happen next, we should look at the "how" and "why" of this price action. Where would you like to start our exploration?
💹Market Structure: We can look at the "Lower Highs" forming at the top of the chart and what they tell us about the shift from buyers to sellers. 🏗️
💹Support & Resistance: We can discuss why that 1.3650 level was so important and what happens to a "floor" once the price falls through it. 🧱
💹Risk/Reward: We can explore how a trader might use the target at 1.3550 to plan a potential trade. ⚖️

AAPL Top-Down Analysis | Liquidity, Confluence & EMA Structure In today’s review of Apple (AAPL), I walk through my top-down analysis process using the tools I keep on my chart to help build context and identify higher-probability areas of interest.
This review focuses on how I use the 13 and 21 EMA, supply and demand zones, and extended-hours session levels in TradingView to better understand where price may be leaning.
Rather than relying on one signal alone, the goal is to build confluence by combining multiple context clues from price action, liquidity behavior, and structure.
A major focus in this review is understanding how liquidity influences price movement and how those clues can help build a case for where price may be targeting next.
In this video, I cover:
• How I use the 13 and 21 EMA to read short-term structure
• Identifying supply and demand zones that may influence price
• Using extended-hours levels as additional liquidity reference points
• Building confluence through liquidity, structure, and price clues
This approach is designed to simplify the chart, reduce noise, and focus on how price behaves around important areas rather than forcing a prediction.
As always, the focus remains on confirmation over prediction.

Loop may be Bottomed/BottomingMajor double/triple bottom possible here, with lows around 80-90 cents, neckline around 1.95-2.30.
If it get can and hold above 1.95, I expect a move to 4.29 and then 6.33 conservatively. Higher is possible.
May play out relatively soon if it is done now, though if we see another bottom instead it could take months to resolve.

MESM Apr 27: 7171 and 7181 decide 7140 or 7200MESM analysis for Monday, April 27
I want to start with the weekly chart first, because I think this week could be a little tricky.
The main weekly level I’m watching is 7,076. For me, that is an important reference level for the whole week, and I would not be surprised if price comes back and taps it at some point.
On the 4H chart, price left a clear upper wick, which suggests hesitation near the highs. Because of that, the key downside level for me is 7,181. If price closes below that level on the 4H, then I think we could see continuation lower toward 7,140.
On the upside, the main target remains 7,200, which is still the key liquidity level above.
On the 1H chart, if I want to stay bullish today, then I do not want to see any candle close below 7,171. If that level fails, then I’ll be watching for downside continuation into 7,140.
On the 15M chart, the structure stays aligned with the 1H view, so 7,171 remains the main intraday level.
Key levels
7,200 = upside target
7,181 = 4H weakness trigger
7,171 = key 1H / intraday support
7,140 = downside target
7,076 = weekly level to keep in mind
So for today, my plan is:
Watch 7,171 and 7,181 closely
If they fail, watch for downside into 7,140
If support holds, bulls still have a chance to push toward 7,200
Keep 7,076 in mind as the larger weekly reference
Not financial advice. No confirmation, no trade. CME_MINI:MESM2026

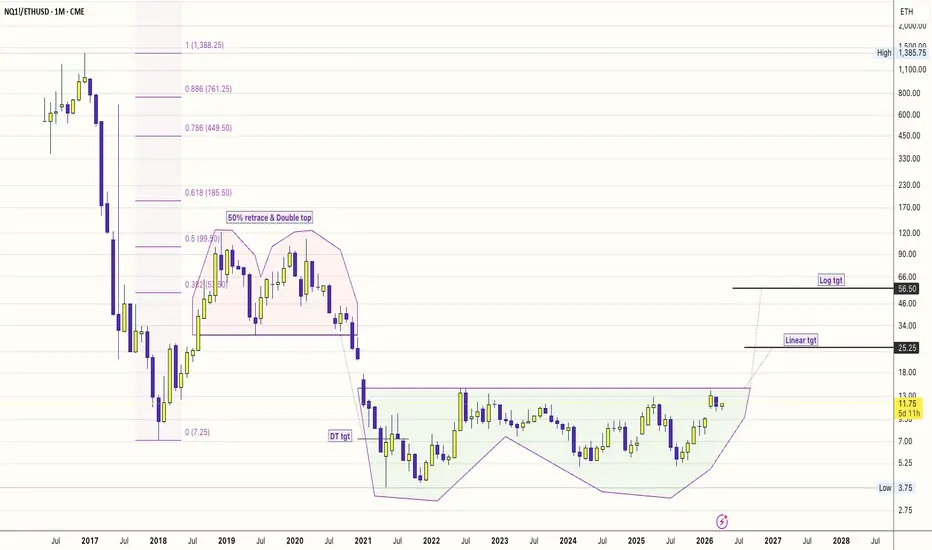
AI Infra > DeFi Infra: The 4-Year Relative Strength Breakout!1. The "Big Base" Logic
Observation: A 4-year base (2022–2026) in the NQ/ETH ratio.
This isn't just a price move; it’s a liquidity migration.
#DeFi (Ethereum) was the hero of the low-interest-rate era (2020-2021).
But in 2026, the "Real World" needs GPUs, data centers, and power grids.
The Nasdaq is the ticker for that physical reality.
The Trigger: Intel’s +24% move and Nvidia’s Blackwell dominance are the fundamental "fuel" for this technical breakout.
2. AI Infra (Hardware) vs. DeFi (Software)
The "Physical" Advantage: AI infra is now a $2.5 Trillion market.
It involves tangible assets (Chips, Fiber, Cooling).
The "Protocol" Fatigue: DeFi has become hyper-fragmented. There are too many L2s and protocols competing for the same liquidity. AI Infra, however, is a bottleneck economy—there is only so much compute to go around.
3. Key Levels
The Pivot: 13.00. A weekly close above this "Neckline" completes the 4-year U-Base.
The Targets: * Target 1 (25.25): The "Linear" target. This assumes Nasdaq continues to grow while ETH stays stagnant—a "repricing of utility."
Target 2 (56.50): The "Blue Sky" log target. This represents a world where AI agents become the primary users of the internet, making traditional human-centric DeFi secondary.
#NQ1! #ETHUSD
#NVDA, #INTC, #BTCUSD
#AIInfrastructure #RelativeStrength #DePIN #MacroEconomy #Semiconductors
In 2026, we’ve moved from "training" models to "running" them (Inference).
Running them requires constant, stable hardware—exactly what the Nasdaq companies are building.
$ETH vs $NVDA: The "World Compute" 0.886 Reality Check📉📉📉
The "World Computer" narrative is meeting the 0.886 Fibonacci reset.
While Ethereum ( CRYPTOCAP:ETH ) struggles to clear its $2k ceiling.
The actual compute leader powering 80% of #AI
( NASDAQ:NVDA ) has crushed it in relative price performance.
Ironic since Ethereum used to be mined on NVDIA GPU's !!!
The Setup: We are tracking a deep 0.886 retracement in the ETH/NVDA ratio, a level traditionally seen as the "capitulation zone" for underperforming assets.
Analysis: The AI explosion "real-world compute" has drained liquidity from speculative crypto layers.
Target: Watching for a structural bottom at the 0.886 reset level to see if the "World Computer" can finally find a bid against the hardware king.
Going forward... once achieved
ETH may only do well to simply retest the Double top neckline.

Trend Continuation ShortMarket already shifted bearish → no reason to countertrend
Bounce is corrective, not impulsive → weak buyers
Price rejects near EMA / equilibrium zone (~94.8–95.0)
Sellers defending structure → continuation play
👉 Key idea:
In trends, weak pullbacks into resistance are opportunities—not reversals.
📊 1. Context
Strong prior selloff → bearish momentum established
Market forming lower highs
Bounce into equilibrium (EMA zone)
No strong reclaim of prior structure
⚙️ 2. Setup
Corrective move into resistance
Weak bullish continuation
Rejection near EMA / structure
Sellers stepping back in → continuation bias
🎯 3. Execution Plan
Entry: ~94.8–95.0 (rejection zone)
Stop: Above local high (~95.5)
Target: ~93.5–93.6
R:R: ~1.5R+
Invalidation: Strong acceptance above 95.5
🧠 NOTE
In trending markets, corrective moves into resistance with weak momentum often lead to continuation as trapped buyers unwind.

W OracleFollowing the previous idea, which confirmed the reversal momentum upon breaking above the weekly 10 SMA, it is now time to take a closer look at the bullish structure that has formed.
The price has formed a double bottom, with the second low at $134.5 resting on the support level indicated in blue.
The double bottom pattern will only be confirmed with a close above $171, which would activate the next target in the $207 area. A retest of the $171 level is highly likely after the breakout before the move toward $207 continues.
Prior to the breakout, a correction toward $156 is possible to fill the large GAP created by the initial breakout.
Stay tuned for further updates
If you find my ideas helpful, please leave a like

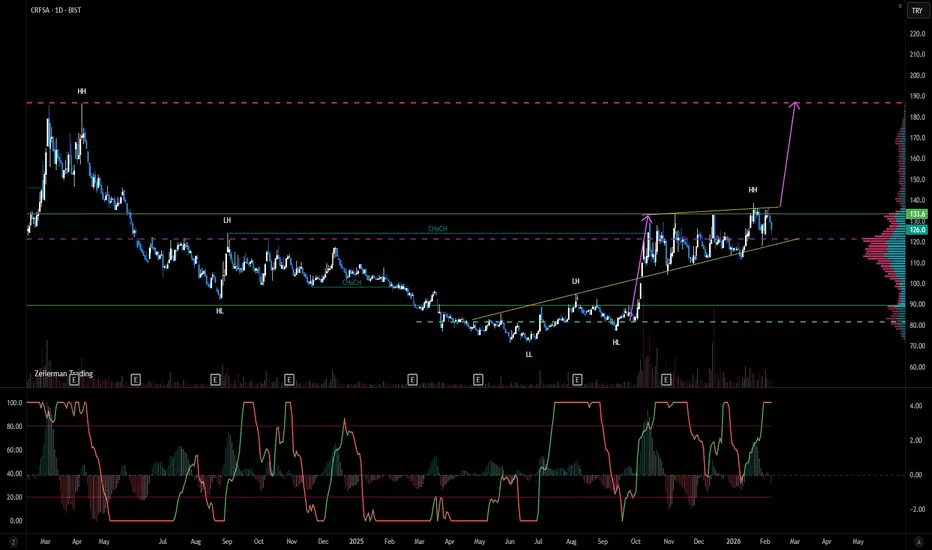
CRFSA time to breakoutAfter a long zig zags, time to breakout for CRFSA is aproaching for the previous double top target 187 . Not for trading advice...
MESM Forecast04/24: ATH printed,but upper wick warns of pullbackMESM analysis for Friday, April 24
MESM just printed a fresh all-time high around 7190, but after making that high, price showed rejection and the current 4H candle is leaving a long upper wick. That makes me cautious here because it can be an early sign of weakness near the highs.
On the 4H chart, the key level for me is 7140. If price starts losing that level, then I think we could see a deeper pullback develop. The first downside target I’m watching is 7100, and after that the bigger liquidity level sits around yesterday’s low near 7080.
On the 1H chart, the key level is 7134. If bears want control, then I do not want to see price strongly reclaim and hold that area after rejection. But if buyers step back in and defend it, then another move toward the highs is still possible.
On the 15M chart, the main short-term reaction area is the green order block zone. If price breaks below that zone, I’ll be watching for more weakness. If buyers defend it, then price may still rotate back up.
Key levels
7190 = fresh all-time high
7140 = key 4H weakness trigger
7134 = 1H decision level
7100 = first downside target
7080 = downside liquidity / yesterday’s low
Green zone = 15M order block
So for today, my plan is:
Stay careful because of the upper wick at the fresh high
Watch 7140 for weakness
If price loses support, watch 7100 first and 7080 after that
If buyers defend the green zone, then another push higher is still possible
Not financial advice. No confirmation, no trade. CME_MINI:MESM2026

Possible BUY on XAUUSDAfter making a 3rd touch on the trendline and also failing to break below the low, it looks like the support level may be strong enough to cause a break of the trendline.

HIMS - Is this the breakout to get back to Oct highs? Following the selloff from Oct 2025 highs, HIMS has now broken out. From this breakout we can clearly see a dbl bottom; with the right side being a higher high!
Now we have created a cup and handle and retested the neckline!
Will enter 6/18 $35 strike calls!
Measured move gets over $40.
Happy trading.

GBPUSD, Bullish Push From 1.3500Following a break of structure from last week's price action, GBPUSD fails to go lower beyond 1.3500. However, I see spikes and closures above 1.35 on the second leg of the W Formation, GBPUSD could be setting up another rally to break past the external high.
Had a very long break, good to be back


$BTCUSD: has double bottomedBITSTAMP:BTCUSD : I see BTC to have double bottomed. There was positive divergence before the double bottom. Resistance at $78K area generated expected reaction and BTC is behaving well. I plan to add to my IBIT holding at pullback.

MESM Forecast April 23: Still range-bound,7183 above, 7100 belowMESM analysis for Thursday, April 23
MESM is still trading inside a choppy range, so for today I’m not expecting much unless price gives a clear breakout or breakdown.
On the 4H chart, price already tapped the level we were watching around 7122 from the overnight session. The key level for me now is 7173. If the current 4H candle fails to close above 7173, then I think price could rotate lower toward 7100.
On the 1H chart, the candle is leaving a long upper wick, which tells me price may be facing rejection near the highs. That makes me want to stay cautious unless bulls can reclaim momentum.
On the 15M chart, the main upside trigger is 7170. If price can close above that level on the 15-minute, then I’ll be watching for continuation higher into 7183, which is the previous high.
If price stays weak instead, then the downside liquidity I’m watching is 7100, followed by 7085.
Key levels
7173 = key 4H resistance
7170 = 15M breakout trigger
7183 = previous high / upside target
7100 = downside liquidity
7085 = next downside target
So for today, my plan is:
Below 7173, stay cautious and watch for weakness
Above 7170 on the 15M, look for continuation into 7183
If price breaks lower, watch 7100 and then 7085
Not financial advice. No confirmation, no trade. CME_MINI:MESM2026

GBPUSD | Long 22/04/2026Going long on GBPUSD, following the pullback to the internal low. Seems like the bottom has been set

US100Double Top with RSI Divergence 📉
The price has formed a Double Top pattern accompanied by a clear RSI Divergence, signaling a potential bearish reversal. I am entering the trade as the momentum shifts.
Risk Management: 0.75%
Risk/Reward (RR): 1:1
Stop Loss (SL): Above the Double Top highs

XAGUSD – Double Bottom + Bullish DivergencePotential reversal forming after sweep of lows.
Structure showing early strength.
📍 Buy on confirmation above 78.30
🎯 Target: 79.20 zone
🛑 Below recent low invalidates
RR: 1:2 setup

INDOTECH : DOUBLE BOTTOM FORMATIONThe stock NSE:INDOTECH has witnessed a significant downfall over the past sessions, indicating sustained bearish pressure. However, price action now suggests that it is nearing the completion of a Double Bottom pattern — a classic bullish reversal structure.
The formation of two consecutive lows around a similar price zone indicates strong support and potential exhaustion of selling momentum. Currently, the price is approaching the neckline, and a decisive breakout above this level would confirm the pattern and signal a possible trend reversal.
🔹 Trade Setup:
Entry: After a confirmed breakout above the neckline
Target: 2100 – 2200
Stop Loss: Low of the breakout candle
📌 Patience is key — avoid early entries and wait for a strong breakout confirmation with volume support.
⚠️ Disclaimer: This analysis is for educational purposes only and does not constitute any buy or sell recommendation.
