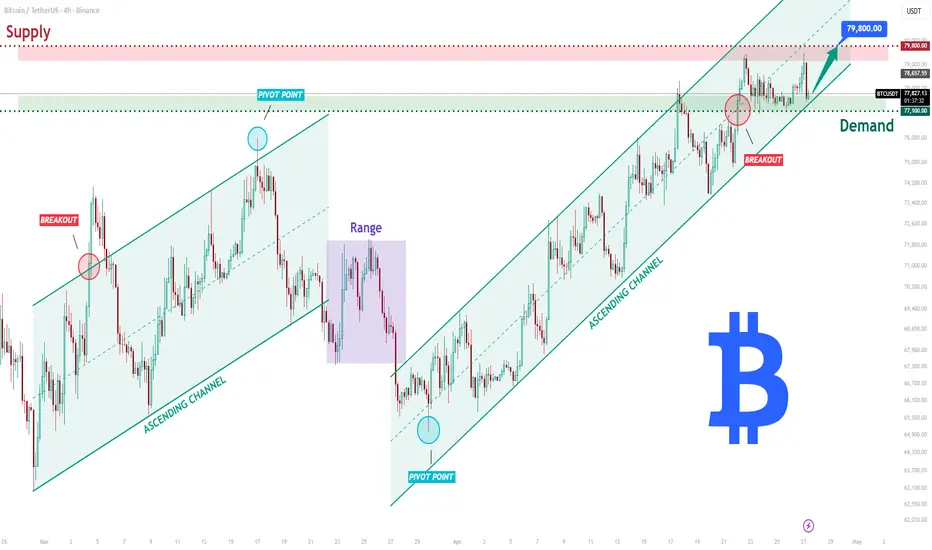
BTCUSDT Long: Trend Support Holds - Bulls Eye 79.800$Hello traders! Here’s my technical outlook based on the current BTCUSDT (4H) chart structure. Bitcoin previously traded within an ascending channel, confirming strong bullish momentum. After a period of consolidation, price found a bottom at a pivot point and continued its upward movement within a new ascending channel.
Currently, price is holding above the 77,000 demand zone, which acts as key support, while approaching the 79,800 supply zone. A recent breakout and retest confirm buyer strength, while the channel structure continues to support price from below.
As long as BTCUSDT holds above the 77,000 support and respects the ascending channel, the bullish bias remains valid. A continuation from this zone could push price toward the 79,800 resistance (TP1). Manage your risk!
Crypto
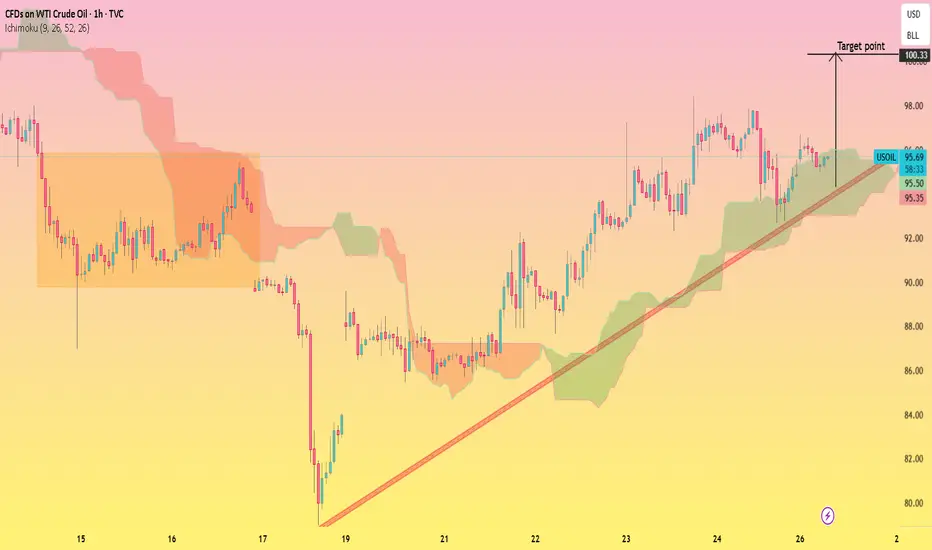
WTI Crude Oil — Bullish Continuation Toward 100.33
This 1-hour chart of WTI Crude Oil shows a strong recovery from the mid-chart bottom, followed by a steady uptrend supported by a rising trendline. Price action is holding above the Ichimoku Cloud, indicating sustained bullish momentum.
Higher lows and higher highs confirm trend continuation, with price recently bouncing from both the ascending trendline and cloud support. The structure suggests buyers remain in control as long as price respects these dynamic support zones.
**Target:**
* Upside target: **100.33**
A continuation above recent highs and trendline support increases the probability of reaching this level. A breakdown below the cloud and trendline would weaken the bullish outlook.
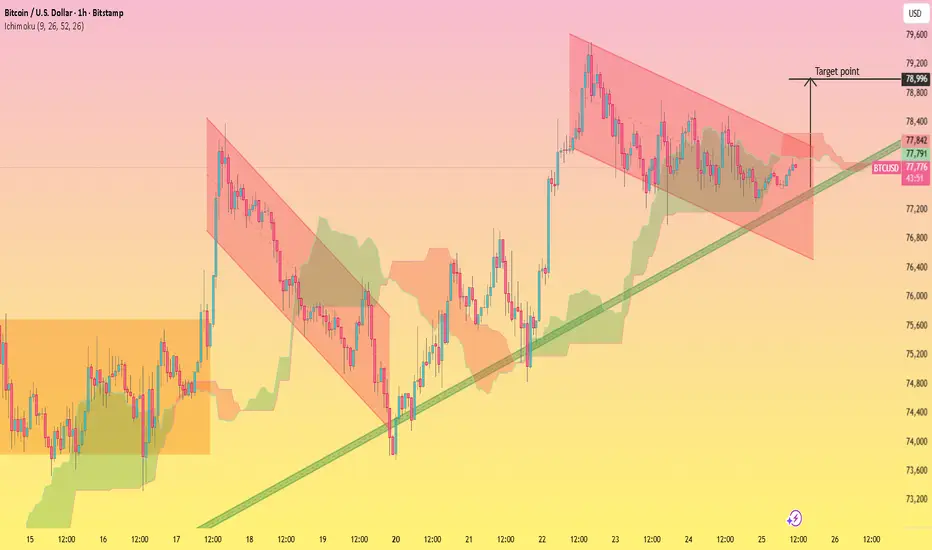
BTCUSD Descending Channel Breakout with Bullish Trendline..This 1H BTCUSD chart shows price previously respecting a **descending channel** (marked in red), indicating short-term bearish pressure. However, the structure shifted after a strong bullish impulse from the lower support area, where price bounced off a **rising trendline** (green).
Currently, price is consolidating inside a range while holding above the ascending trendline and partially supported by the Ichimoku cloud. The descending resistance is still in play, but momentum is slowly favoring buyers as higher lows are being formed.
A breakout above the descending channel resistance would confirm bullish continuation, especially if price sustains above the cloud and trendline confluence.
**🎯 Target:**
* **Primary Target:** 78,900 – 79,000 zone
* This aligns with the projected breakout move and prior resistance area.
**⚠️ Key Levels to Watch:**
* Support: 77,200 – 77,400 (trendline + cloud support)
* Resistance: 78,400 → 79,000 (channel top + target zone)
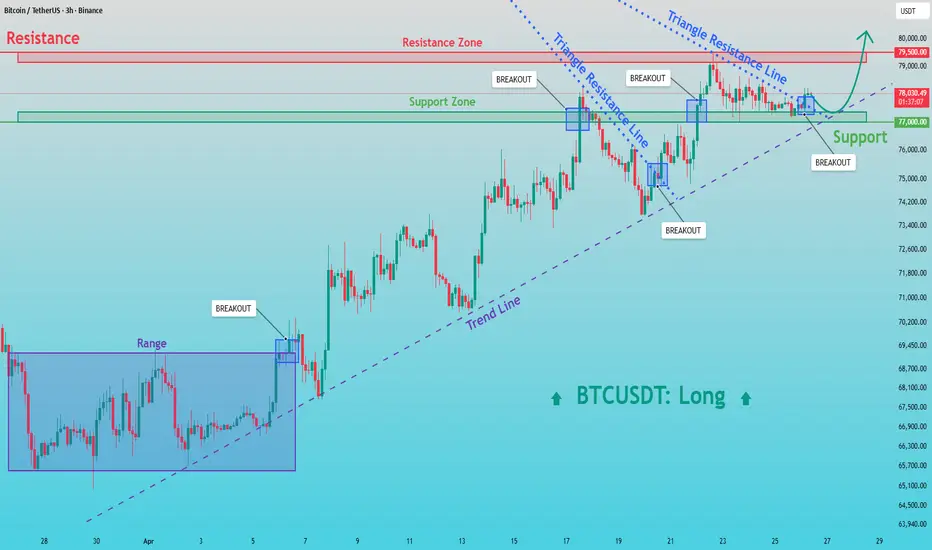
BTCUSDT: Respects Trendline - 79.5K Breakout in FocusHello everyone, here is my breakdown of the current BTCUSDT setup.
Market Analysis
Bitcoin previously traded inside a range. After the breakout, price continued higher and formed an ascending trend with consistent higher lows along the trendline. Later, the market entered a triangle structure, where multiple breakouts and retests confirmed strong buyer control.
Currently, BTCUSDT is consolidating below the 79,500 resistance zone. A recent pullback and reaction from support indicate that buyers are still active, while resistance remains the main barrier.
My Scenario & Strategy
As long as BTCUSDT holds above the 77,000 support and respects the ascending trendline, the bullish scenario remains valid. A bounce from this zone could push price toward the 79,500 resistance (TP1).
However, if price breaks below 77,000 and loses the trend structure, a deeper correction may follow.
That’s the setup I’m tracking. Thank you for your attention, and always manage your risk.
XRP – Compression Before Expansion?XRP is currently bullish, trading within a rising wedge in blue.
Momentum is building… but still waiting for confirmation.
For the bulls to take over and kick off the next impulse upward, a clean break above the minor red channel is needed 🚀
Until then, price remains in a compression phase.
Meanwhile, if XRP dips back into the accumulation zone, that would open the door for fresh trend-following long setups from value.
Structure is tightening… move is coming.
Which way do you see it breaking? 🐂🐻
⚠️ Disclaimer: This is not financial advice. Always do your own research and manage risk properly.
📚 Stick to your trading plan regarding entries, risk, and management.
Good luck! 🍀
All Strategies Are Good; If Managed Properly!
~Richard Nasr

The Ether Bull & New ATH · EMA13 Conquered · $3,730 Next!The 2025 bullish cycle really intensified once Ether moved weekly above EMA13. As soon this happened, ETHUSDT experienced sustained bullish action for months.
The bullish wave ended August 2025 with a test of EMA13 as support in September, then again October. When EMA13 broke as support, we saw months of bearish action.
The bearish period wasn't straight down, there was some relief in late 2025 until January 2026. In January, all growth stopped as soon as ETH faced EMA13 as resistance. Just one challenge of this level and a crash from $3,400 ended at $1,750, showing how important EMA13 is to determine mid-term price action.
After almost three months of consolidation, recovery and accumulation at bottom prices, after the 6-Feb low, ETHUSDT managed last week to move and close above EMA13, giving us the strongest bullish signal of all. This opens the doors for massive growth.
Just as in October 2025 a break below this level led to four months of bearish action; a break above in April 2026 can lead to several months of bullish action. All that is needed is a follow through this week.
If bulls/buyers show up at current prices, ~$2,400, we can expect a fast and sudden advance toward $3,730. That's our next target.
ETHUSDT just closed four consecutive weeks green after a long-term higher low. The path is open for a new all-time high long-term, and maximum growth short-term.
Thanks a lot for your continued support.
Namaste.

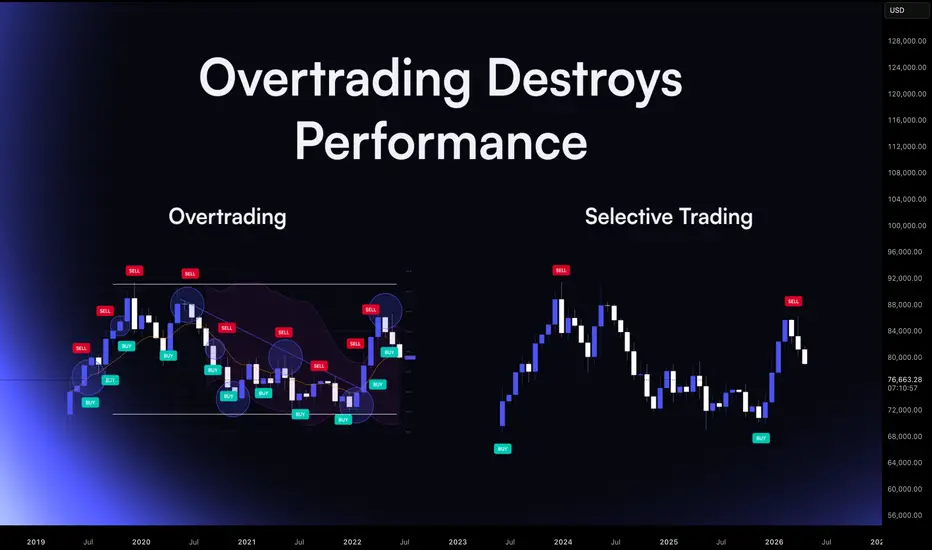
How Overtrading Slowly Destroys PerformanceOne of the most common reasons traders struggle to achieve consistency is not the strategy they use, but how often they trade. Many traders believe that more activity leads to more opportunity. In reality, excessive participation often leads to the opposite result.
Overtrading occurs when traders take positions that do not fully meet their criteria. The trades may look acceptable in isolation, but they lack the structural alignment that defines a high-quality setup.
This behavior usually develops gradually.
At first, the trader takes only clear opportunities. Over time, the desire to remain active increases. Charts are watched continuously, and small movements begin to appear significant. Trades that once would have been ignored start to feel justifiable.
The result is a higher frequency of trades with lower quality.
Each additional trade introduces risk. When these trades are taken without strong structural reasons, the probability of success decreases. Losses begin to accumulate not because the strategy stopped working, but because the trader stopped applying it selectively.
Another problem with overtrading is emotional fatigue.
Every trade requires attention, decision-making, and risk management. As the number of trades increases, mental energy becomes depleted. Decision quality gradually declines. Traders may begin to enter earlier than planned, move stops impulsively, or exit trades prematurely.
This degradation of execution often goes unnoticed at first.
Performance data may show several small losses rather than one large mistake. However, the cumulative effect becomes significant. Over time, a large number of marginal trades erodes profits that stronger setups could have produced.
Transaction costs can also amplify the problem.
Frequent trading increases fees and slippage, especially in fast markets. These costs may appear small on a single trade but become meaningful when multiplied across dozens of unnecessary positions.
Professional traders approach participation differently.
Instead of measuring productivity by the number of trades taken, they measure it by the quality of opportunities selected. Many experienced traders spend long periods observing the market without entering a position. Their goal is to wait for conditions where structure, liquidity, and participation align.
This selective approach reduces exposure to random price movement.
Fewer trades often produce clearer results. Each position is based on a defined thesis, risk is easier to manage, and emotional pressure remains lower because the trader is not constantly reacting to every movement.
The objective in trading is not to be active.
It is to be effective.
A strategy can only demonstrate its edge when trades are taken under the conditions it was designed for. Overtrading weakens that edge by introducing unnecessary exposure to environments where probability is unclear.
Consistency in trading rarely comes from doing more.
It comes from learning when not to act.
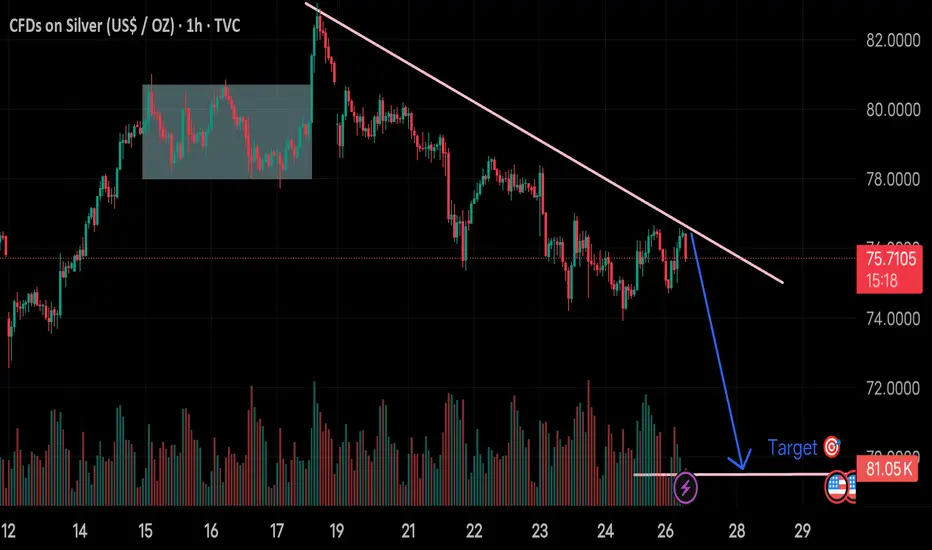
(Silver 1H chart)...(Silver 1H chart).
Price is trending down under a descending trendline
Recent structure shows lower highs + lower lows
I have already marked a horizontal support zone around ~70
Realistic downside targets
If that trendline holds and price rejects again:
Primary target:
70.0 – 69.5 (major support / liquidity zone — matches my marked area)
Extended target (if breakdown happens):
67.5 – 66.5 (next strong support range)
What needs to happen first
For my bearish target to play out cleanly:
Price should reject the trendline again (~76–77 area)
Then break below ~73.5 support with momentum
Invalidation
My idea weakens if:
Price breaks and holds above the trendline (~77.5–78)
Bitcoin Rebound Scenario – Push Toward 79,000 IncomingHello traders! Here is my technical outlook based on the current BTCUSDT (1H) chart structure. Bitcoin previously traded within a range, showing consolidation before a breakout that confirmed bullish momentum. After the breakout, price continued higher and formed an ascending structure with consistent higher lows along the trend line. Currently, price is holding above the 77,000 buyer zone, which acts as strong support, while approaching the 79,000 resistance level (seller zone). At the same time, a descending resistance line is limiting upward movement, and a recent rejection suggests short-term selling pressure. As long as BTCUSDT holds above the 77,000 support and respects the ascending trend line, the bullish bias remains valid. I expect a potential rebound from this zone, which could push price toward the 79,000 resistance (TP1). Please share this idea with your friends and click Boost 🚀

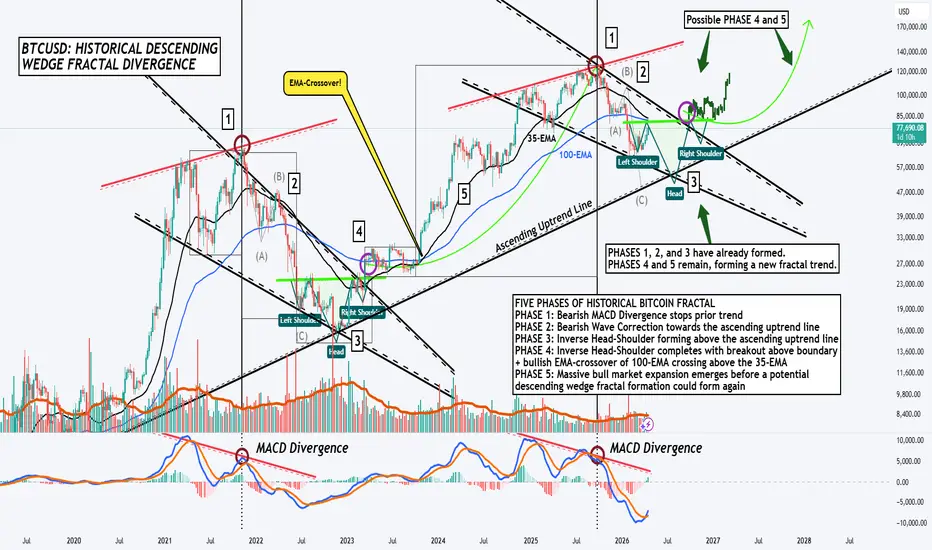
BTCUSD: THIS Historical Fractal Formation Could Complete Again!Hello There,
welcome to my new analysis about BTCUSD on the weekly timeframe. I have spotted a major historical fractal formation that could complete BTCUSD now again. The first phases of the fractal have already been completed. With BTCUSD moving further in this fractal formation, this could be a start of the new cycle repeating.
As when looking at my chart, we can see there that the historical descending wedge fractal consists of exactly five phases. In the first phase, a bearish MACD divergence with the MACD bands closing below the previous high MACD bands signals the MACD divergence. In the second phase, a bearish wave count to the downside dumps right into the ascending uptrend line.
The third phase is an inverse head-and-shoulders formation. The fourth phase is a breakout above the upper boundary of this huge established descending wedge formation and setup above. The fifth phase is the massive bullish expansion towards the upside, also confirmed by a bullish EMA crossover with the 100-EMA in blue crossing above the 35-EMA in black.
Bitcoin has right now exactly completed the first three phases of the fractal since September 2025 again. While there could be short-term bullish pressure that could test the 100-EMA, this is likely to be the point of the major head forming of this inverse head-and-shoulders formation. If this completes as well, there is a huge possibility of BTCUSD continuing with the next phases.
A confirmation breakout above the upper boundary of the gigantic descending wedge formation would confirm phase 4 with the setup to the further cycle repetition in phase 5. The additional EMA crossover would confirm the completion of the historical descending wedge fractal again. In the next times, the further formations of the price action will pave the way for the future cycle.
In this manner, thank you a lot for watching!
The support is highly appreciated.
VP
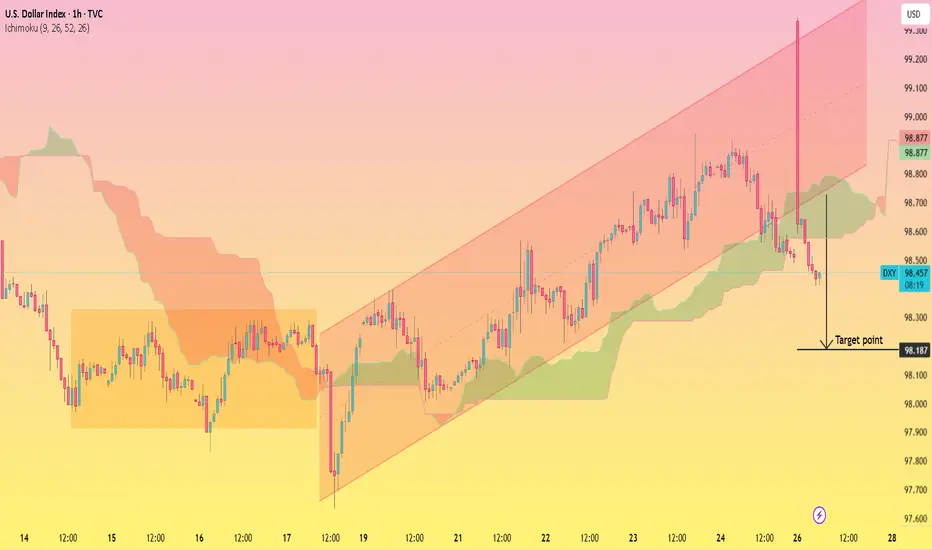
U.S. Dollar Index (DXY) — Bearish Pullback Toward 98.187 SupportThis 1-hour chart of the U.S. Dollar Index shows price previously trending upward within a rising channel, supported by the Ichimoku Cloud. After reaching the upper boundary, a sharp rejection (long wick spike) signals exhaustion. Price has since broken below short-term structure and is slipping toward the cloud support.
Momentum appears to be weakening, with lower highs forming and price edging closer to the lower channel boundary and cloud base.
**Target:**
* Downside target: **98.178** (marked horizontal support and projected move from the breakdown)
If price fails to hold above the cloud and channel support, continuation toward this level becomes likely. A reclaim of the cloud, however, would invalidate the bearish setup.
ETHEREUM - Huge Elliott Waves Formation Ethereum is currently approaching the final stage of a global accumulation phase, structured as a complex W–X–Y–X–Z correction , which began after the breakdown of the previous impulsive cycle (1–5) and the following ABC corrective move.
Macro Structure: After the completion of the bullish impulse (1–5), the market transitioned into a corrective regime, forming an extended and complex structure rather than a simple pullback:
The initial decline formed an ABC correction, marking the shift from trend to accumulation
This was followed by a broader WXYXZ formation, typical for prolonged accumulation phases in high-timeframe markets
The final Z-leg acted as a liquidity sweep, breaking below prior structure and forcing capitulation
Formation of the Current Range: The bottom formation (WXYXZ) created a structural floor, from which the current range developed. Since then:
Price has been consolidating within a rising channel / range
Volatility has been compressing under a major resistance zone
Market behavior aligns with re-accumulation rather than distribution
This suggests that the market is absorbing supply, not distributing it.
XY Development: From the upper resistance zone, price formed a corrective XY structure, which is critical for understanding current positioning:
Wave X → Y defined the internal corrective leg within the broader accumulation
The Y wave established a key support trendline (dynamic support)
This trendline is currently being respected, with price bouncing directly from it
This reaction confirms that the structure remains technically valid and buyers are defending higher lows within the range.
In conclusion , Ethereum appears to be in the final stage of a prolonged accumulation phase, where a completed correction and a well-defined structural support are now supporting the price. This combination suggests that the current consolidation is more likely a phase of compression before expansion rather than distribution. As long as key support levels hold, the chances of going up are much higher, with a breakout above resistance potentially marking the beginning of a new impulsive leg in the cycle.

SOLANA Ascending Trendline Support with Bullish ContinuationThis 1H SOLANA chart shows a **gradual bullish structure** supported by a strong **ascending trendline** (green), where price continues to form higher lows. Earlier, price moved inside a rising channel before experiencing a sharp rejection (circled area), leading to a temporary bearish pullback.
After the correction, the market stabilized and resumed consolidation above the trendline, with the **Ichimoku cloud acting as dynamic support**. Price is currently ranging just below a minor resistance zone (around 86.50), indicating accumulation before a potential breakout.
The overall structure suggests that buyers are still in control as long as the trendline holds and price remains above the cloud.
**🎯 Target:**
* **Primary Target:** 88.60 – 88.70
* This aligns with the projected breakout move and previous resistance zone.
**⚠️ Key Levels to Watch:**
* Support: 85.50 – 86.00 (trendline + cloud support)
* Resistance: 86.50 → 88.60 (range high to target zone)
**💡 Insight:**
Holding above the ascending trendline keeps the **bullish bias intact**. A clean breakout above 86.50 can trigger momentum toward the target, while a breakdown below the trendline would weaken the setup and may lead to deeper retracement.

USD/JPY (1H) Sell Setup Target...USD/JPY (1H) Sell Setup Target.
Entry Zone: 159.20 – 159.40
Target 1: 158.90
Target 2: 158.50
Target 3: 158.00 (main support zone)
Stop Loss: 159.75 above resistance
Analysis: Price has broken below the rising trendline and is showing weakness under resistance. If bearish pressure continues, downside move toward 158.00 is possible. If price breaks above 159.75, sell setup weakens.

Rocket Pool (RPL) —A New Market Cycle is UnderwayWe start with a two years long downtrend reaching its end. Here we cannot say that Rocket Pool is likely to produce a small jump, an inverted correction, weak bullish action, etc. It is 100% clear that a new bullish cycle is starting now for this project, an uptrend.
In February RPLUSDT printed one of the biggest candle in all of its history coupled with the highest volume ever.
Resistance has been challenged and the market is now sideways with no new lows.
"Rocket Pool is a decentralized ETH liquid staking derivative provider. Rocket Pool pairs smart node operators with stakers to pool ETH for staking, then returns rETH to stakers for maintaining liquidity and control of their staked tokens. RPL is the utility and governance token, it is required for becoming a node operator."
This is a very nice project. This adds to our list of no longer bearish, downtrend no-more, the start of a bullish cycle confirmed. One by one, we are getting there. The bullish case strengthens day by day.
Thank you for reading.
The best is yet to come!
Namaste.

Compound · Early bullish action & long-term growthGood afternoon my fellow Cryptocurrency trader, I hope you are having a wonderful day.
›› Is the current move real or fake?
›› Are we witnessing the start of a new cycle, a new bullish period or a bull-trap, which one is it?
›› How to know if this move promises higher prices or if the results will be the same as before?
Great questions, let's ask the chart.
Compound has been bearish for years, when it comes to the broader market cycle and chart structure —since May 2021.
Compound has been bearish also based on the last market cycle, since December 2024.
Between June 2022 through December 2024, we had bullish action, higher highs and higher lows. From December 2024 through present day the market was bearish. Here we can see the alternating waves.
The all-time low came in October 2025. In February, COMPUSDT produced a higher low vs this ATL. And notice how trading volume was extremely low.
This month the action is turning bullish. It is the best since December 2024 supported by really high volume, a volume breakout, and this is the signal that supports additional growth.
A four months long higher low supported by a high volume bullish breakout is a combination good enough to support a change of trend.
›› How long can this uptrend last? What to expect?
If an uptrend develops it can last years, the same as previous cycles.
If we are only witnessing a bullish jump before lower prices, an inverted correction, then the duration can be 1-3 months.
Seeing how a new all-time low was hit followed only by a higher low, it is more likely that the bottom is in and thus a new uptrend forms.
If we were set to experience lower this year on COMPUSDT, the low in February 2026 would be lower compared to October 2025. That's the logic based on TA.
Thank you for reading. Your continued support is highly appreciated.
Namaste.

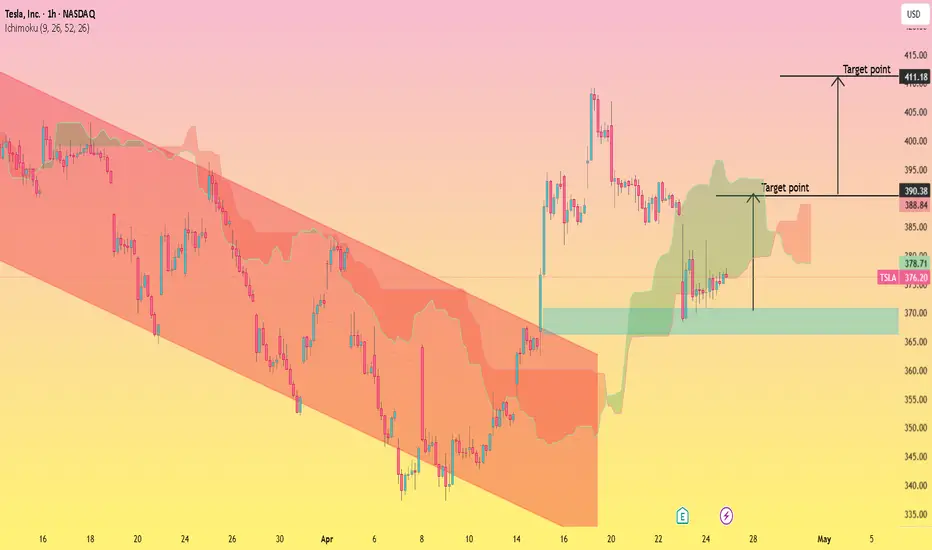
Tesla Breakout After Downtrend – Bullish TargetsThis chart of Tesla, Inc. (TSLA) shows a clear shift from a strong downtrend into a bullish recovery. Initially, the price was moving inside a descending channel (red zone), indicating consistent selling pressure. However, the price eventually broke out of this channel with a sharp upward move, signaling a potential trend reversal.
After the breakout, the price formed a consolidation range around the green support zone (near 370–372), showing stability and accumulation. The presence of the cloud (likely an Ichimoku indicator) suggests the market is trying to build bullish momentum above support.
Targets:
First Target: Around 390–395 (short-term resistance area marked on chart)
Second Target: Around 410–412 (major resistance / target point shown above)
THORChain (RUNE) · A fast rise —Guaranteed higher pricesEven before the project hits bottom, trading volume starts to climb. It goes higher and higher and higher...
A better volume signal can be gotten through the more exotic exchanges. The bigger exchanges can have kind of irrelevant volume patterns, in some cases.
See here how well the volume indicator reveals a bottom process and also the start of a bullish move. This is always true when I look at smaller exchanges.
It is a good practice to look at the same project on several exchanges before concluding your analysis, some valuable insights might be gained from this practice.
RUNEUSDT (THORChain) is set to hit the highest price since late January, completing its bottom recovery process. With the recovery being over and done, next we get to experience growth, it is that simple.
This conclusion based on price action and the chart structure is supported by the market cycle and the just mentioned volume indicator.
Alright my dear friend, this is all I have to say.
Buckle up, it will be a fast ride. Many times faster compared to the decline.
Notice how RUNEUSDT was going down and lower for months. All losses will be recovered in a matter of days.
Thank you for reading. I will share more.
Namaste.

Injective—INJUSDT 4X—Long trade with 2,700% profits potentialThe action is already on. Notice how this INJUSDT chart is already green; high volume, full green candle, pushing higher... This is how everything can change in a matter of days.
Just weeks ago, everything was trading at the bottom, very close to support. Now, everything is already 0.5 levels higher and ready for more.
Injective (INJUSDT) finished its bearish period with a double-bottom—October 2025 vs Feb-March 2026. A long-term process.
After this bottom, we see the chat we have today. Prices start to rise slowly then everything speeds up.
This pair is already moving so it becomes more risky, thus the relatively low leverage.
This is a time sensitive trade-setup. Can result in big wins right away because the market is growing now, and everything will be hyper bullish in a matter of days.
In just 1-3 days we can see a major marketwide advance. It is already happening and hundreds of projects are moving up.
Can I say FOMO?
—————
LONG INJUSDT
Leverage: 4X
Potential: 2700%
Allocation: 4%
Entry zone: $3.15 - $3.88
Targets:
1) $4.66
2) $5.88
3) $6.66
4) $7.92
5) $9.16
6) $11.2
7) $14.4
8) $17.7
9) $21.2
10) $25.1
Stop-loss: Close weekly below $3.13
—————
Thanks a lot for your continued support.
Namaste.

Sei—SEUSDT 4X—Long with 1,172% profits potentialGood life my fellow Cryptocurrency trader, it is such a wonderful pleasure to write again for you today. I don't know if I should smile or cry, so I'll be certain to do both but only after I share with you this amazing trade.
It is already happening... The altcoins market bull market that is.
We went through a very annoying bear market but that is over, there is no point in crying over spilled milk. The most awesome-great is yet to come. I am here for you, you can count on new content daily for years non-stop.
SEIUSDT is hyper, mega bullish coming out of an all-time low, and this is simply the best possible.
The current session (candle) is the fourth one after the ATL and full green. Early recovery signal based on price action.
I will not go into too many details because these numbers are time sensitive. It is either now or now, never is not an option, it is not too late.
You can jump in and see profits—a big win—right away.
The Cryptocurrency market is turning green, you can bet your house on it.
When in doubt, follow me! your mind will be clean.
—————
LONG SEIUSDT
Leverage: 4X
Potential: 1172%
Allocation: 4%
Entry zone: $0.0535 - $0.0640
Targets:
1) $0.0691
2) $0.0812
3) $0.1025
4) $0.1360
5) $0.1690
6) $0.1900
7) $0.2222
8) $0.2474
9) $0.2475
Stop: Close weekly below $0.05300
—————
This is a high probability chart setup. Relatively low risk with a huge potential for reward. Waiting time is count in days, not months nor weeks. Days and we are full blown bullish.
Thanks a lot for your amazing and continued support.
You deserve the best... If you are reading this now, your timing is great.
I love you.
Namaste.

Tether Dominance (USDT.D) · Cryptocurrency Bull Market ConfirmedTether Dominance Index (USDT.D) just lost EMA13 as support on high volume, the highest bearish volume since October 2025.
During the entire bullish move that started August last year, USDT.D traded above EMA13. The level was tested first as support mid-March and just now it failed—the orange line on the chart. This clearly shows the end of the uptrend.
This isn't a surprise really as this is the same Bitcoin chart but in reverse. Bitcoin broke above resistance while Tether Dominance broke below support. TOTAL, TOTAL2 & TOTAL3 moved above resistance while Tether Dominance broke below support.
Just in case there are any lingering doubts, this index supports the altcoins starting now a bull market, Bitcoin as well. Long-term growth.
Namaste.

Bitcoin (BTC) Weekly Above EMA8 & EMA13 · New ATH ConfirmedRecently, in two instances only Bitcoin moved above EMA8 and EMA13 on the weekly timeframe after a correction low. This event is always proceeded by sustained bullish action. A rising wave lasting months.
Bitcoin is hyper-bullish right now. Truly, the most bullish possible.
When Bitcoin starts trading above $95,000 or $100,000, market conditions would be great but not better than what we see today. The most bullishness and highest potential comes at support, at low prices.
Believe it or not, Bitcoin is still a great buy below $80,000.
All recent growth is based on strategic positioning and wise accumulation. There is a complete lack of FOMO and this reveals a strong base being built.
It is likely that Bitcoin will never revisit the low prices we are witnessing now. The whales, institutions, countries and corporations, are loading up at low prices. These are the same whales that bought high their first time around. This time they have more experience and decided to buy at support. These people plan long-term.
"The current rally reflects steady capital inflows." That's the phrase I saw in a news article, "...rather than speculative momentum."
Bitcoin is set to close four consecutive weeks green. The last time this happened was April 2025, a year ago.
Bitcoin never closes four weeks green in succession during a relief rally or a weak period. This type of behavior reflects a very strong bullish bias and anticipates long-term growth. This is easy to confirm by looking at past action.
After early July 2025 Bitcoin never closed more than two consecutive weeks green. Only now this bearish pattern is broken.
The current weekly chart—BTCUSDT:
A descending channel has been broken.
Support was found above long-term, highly important, MA200 weekly.
The April 2025 low ($74,500) has been conquered as resistance.
There is a rounded bottom based on candle close.
Bitcoin closed last week above EMA8 & EMA13.
Bitcoin closed three consecutive weeks green last week.
This week shows the highest price in three months.
The RSI is rising with strong momentum after hitting the lowest level since July 2022, the previous bear market bottom.
The MACD is pointing straight up after a true all-time low. There is also a recent bullish cross on the MACD.
The STOCH is rising strongly while pointing to months of bullish action.
Many of the smaller altcoins have been rising for 2, 3, 4 and even 5 months.
And it goes on and on and on. We have a staggering number of bullish signals, it is hard to mention them all.
Do you still think Bitcoin is going down? If you do, why are you reading this post?
Thanks a lot for your continued support.
Namaste.

Celestia—TIAUSDT 4X—Long trade with 2,556% profits potentialThe charts are very similar between projects but there are always some variations. Sometimes subtle, at other times strong.
TIAUSDT tried to move away from the extreme opportunity buy-zone but a retrace pushed prices back down. This is good. The retrace is a classic higher low and the first attempt to break resistance gives further strength to the bullish-case.
Instead of support being challenged and weakened, resistance is being challenged. As soon as resistance breaks, we get a bullish wave.
The consolidation at bottom prices is happening as a higher low—vs October 2025. This clearly shows that the bearish move ended long ago with the past few months being the transition period. From bearish to sideways, from sideways to up.
This is another strong chart setup.
—————
LONG TIAUSDT
Leverage: 4X
Potential: 2556%
Allocation: 5%
Entry zone: $0.3055 - $0.3700
Targets:
1) $0.4053
2) $0.4854
3) $0.6183
4) $0.8332
5) $0.9862
6) $1.1800
7) $1.3959
8) $1.6035
9) $1.7435
10) $2.0915
11) $2.3333
12) $2.6542
Stop: Close weekly below $0.3000
—————
Thanks a lot for your continued support.
I am wishing you the best. Good profits, peace and calm, great sleep and trading success.
Namaste.
