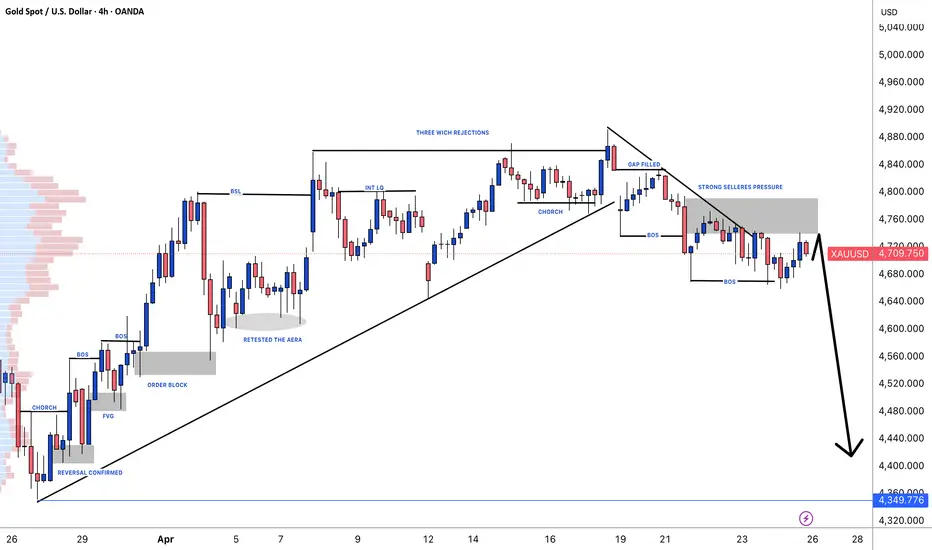
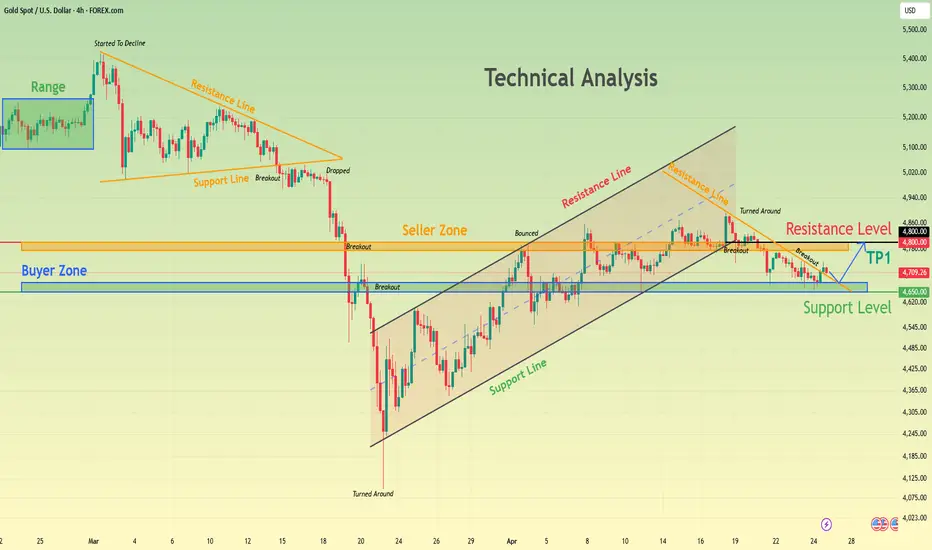
XAUUSD(GOLD): Get Ready For Swing Sell! Trade Is Going To Be BigDear Traders,
As we mentioned in our previous analysis, gold is likely to continue falling. It did just that, but it then bounced back to the entry level. This is due to low market volume on Friday evening. As the week opens, we could see the price start dropping again as the week progresses. Furthermore, looking at the USD, we might see it showing signs of reversal and becoming bullish this week. This could also contribute to increased selling volume in the market. If you agree with our idea, please like and comment for more.
The Setupsfx_ Team
Chart Patterns
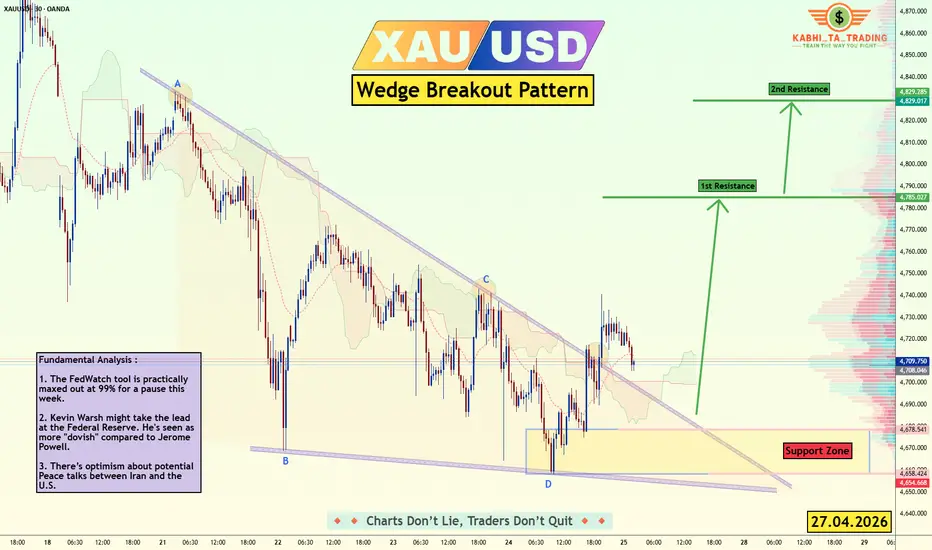
BUY XAU/USD - Wedge Breakout (27.04.2026) XAU/USD is showing a potential wedge breakout pattern after price reacted strongly from the marked support zone. Gold has broken above the descending wedge trendline, suggesting that bullish momentum may be building for a move toward higher resistance levels. OANDA:XAUUSD
Support Zone:
The key support zone is around 4,658 – 4,678. This area acted as the main demand zone where buyers stepped in.
1st Resistance:
The first upside target is around 4,785.
2nd Resistance:
If bullish momentum continues, the next resistance level is around 4,829.
Fundamental Analysis :
1. The FedWatch tool is practically maxed out at 99% for a pause this week.
2. Kevin Warsh might take the lead at the Federal Reserve. He's seen as more "dovish" compared to Jerome Powell.
3. There’s optimism about potential Peace talks between Iran and the U.S.
Disclaimer ⚠️
This analysis is for educational purposes only and is not financial advice. Always use proper risk management, wait for confirmation, and trade according to your own strategy.
#XAUUSD #Gold #GoldTrading #ForexTrading #ForexAnalysis #WedgeBreakout #BuySetup #PriceAction #TechnicalAnalysis #TradingView #KABHITATrading
Support the idea with a like, comment, and follow for more gold trading analysis.
EURUSD _ H1 - BREAKOUT — BULLS TAKING CONTROL!📊 Description: OANDA:EURUSD
EUR/USD has delivered a strong breakout and retest from the descending channel while bouncing sharply from the major demand/support zone. Buyers defended the lower red zone perfectly, showing clear accumulation and momentum shift. Price is now pushing higher with bullish structure, and if current momentum continues, the next upside targets are the marked resistance zones above. This setup suggests sellers are losing control while bulls prepare for continuation.
🔑 Key Levels:
Major Support Zone: 1.1667 – 1.1690
Immediate Resistance: 1.1790
Psychological Resistance: 1.1820
Bullish Invalidation: Break below 1.1665
📌 Trading Insight:
As long as price remains above the support zone and broken channel, bullish bias remains strong. Pullbacks into support may attract fresh buyers for the next expansion higher.
👍 Support This Analysis If you found this idea useful:
👍 Like this analysis
💬 Drop your view in the comments – Bullish or Bearish?
🔔 Follow for more high-probability setups
Your support helps grow and share valuable trading insights 🚀
⚠️ Disclaimer
This content is for educational purposes only

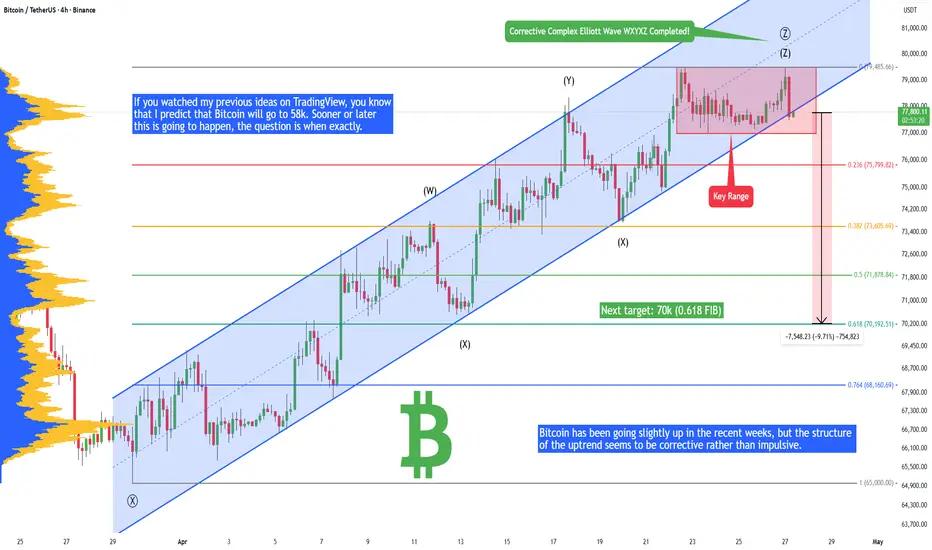
Bitcoin - Ready for a 10% drop! (sell now)Bitcoin has been going slightly up in the recent weeks, but the structure of the uptrend seems to be corrective rather than impulsive. Signs of a corrective trend are overlapping swings, huge retracements between waves, and holding parallel channels (price never went above the channel). If a trend is bullish, the price should go above the parallel channel - in this case, Bitcoin is not strong enough, and instead, the bulls are losing steam, and the price is starting to lose this blue parallel ascending channel.
If you watched my previous ideas on TradingView, you know that I predict that Bitcoin will go to 58k. Sooner or later this is going to happen, the question is when exactly. I think this uptrend on Bitcoin is starting to be very overextended, and we should see the end of this trend very soon! Probably today or tomorrow.
The next target is around 70k (0.618 FIB). The stock market S&P500 is at an all-time high and moving up relatively slowly but very steadily. Instead, Bitcoin is moving up very fast (during bull markets), but with huge drops every 4th year. The dynamics of these markets are very different.
IN the short on Bitcoin - watch this red range at the top of the channel. When you see a breakdown, enter a short position or exit your long position. This is how you can trade based on confirmations.
Write a comment with your altcoin + hit the like button, and I will make an analysis for you in response. Trading is not hard if you have a good coach! I am very transparent with my trades. Thank you, and I wish you successful trades!
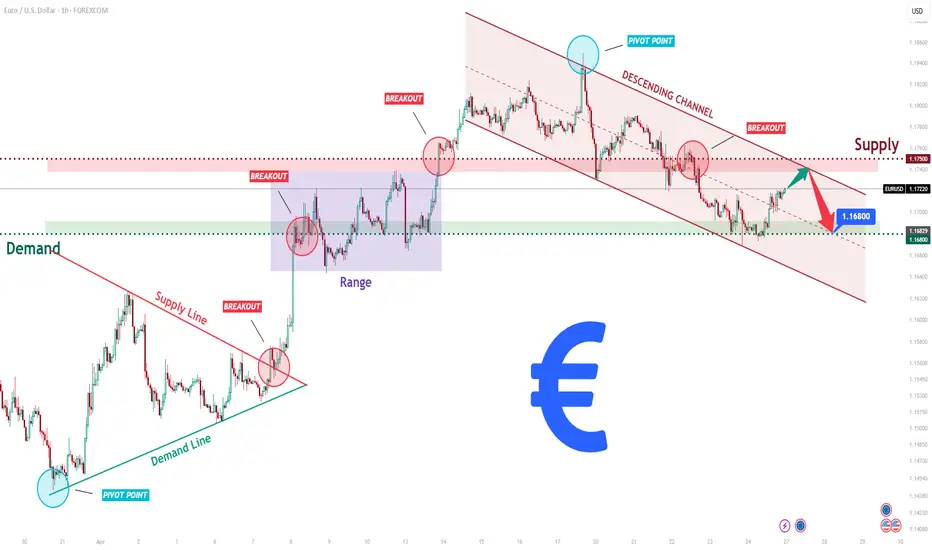
EURUSD Short: In Descending Channel — 1.1680 Support in FocusHello traders! Here’s my technical outlook based on the current EURUSD (1H) chart structure. EURUSD was previously trading under pressure from sellers and buyers forming a triangle. After several breakout attempts, the price managed to break above the structure and entered a short-term consolidation range. After that, the market rose but faced a reversal at the pivot point, signaling strong resistance.
Currently, price is trading back inside the descending channel and approaching the 1.1750 supply zone, while holding above the 1.1680 demand zone. A recent reaction from the channel resistance suggests increasing selling pressure.
As long as EURUSD remains below the 1.1750 resistance and respects the descending channel, the bearish bias remains valid. A rejection from this area could push price toward the 1.1680 support (TP1). Manage your risk!
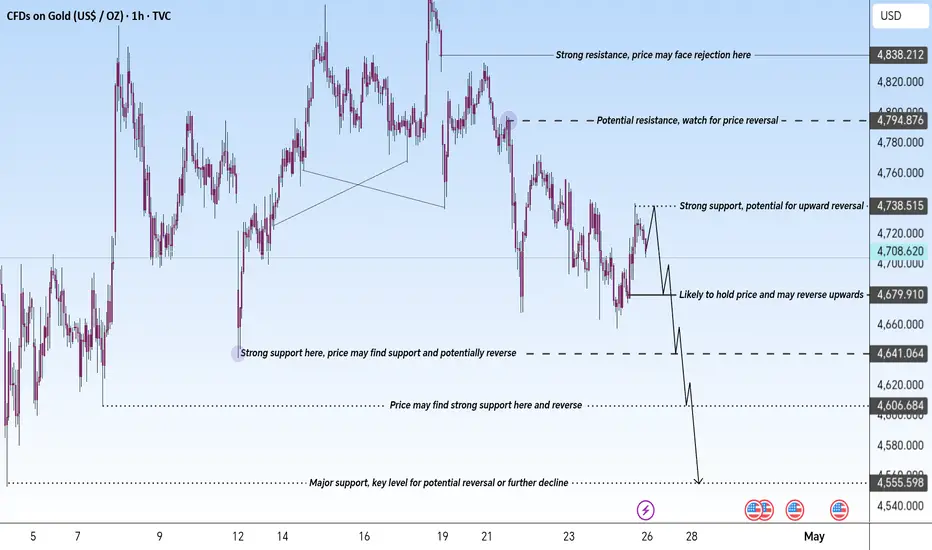
Gold Price Analysis – Key Support and Resistance LevelsThis chart provides a detailed analysis of Gold (XAU/USD), highlighting crucial support and resistance levels. The Key Resistance at 4,838 USD represents a significant point where price may face rejection, while Support Levels at 4,794 USD and 4,738 USD are expected to hold the price, providing potential for upward movement
Traders should monitor these levels for possible reversals or breakouts. The price behavior around these zones will help guide trading decisions based on market reactions. Keep a close watch on the trend for further opportunities
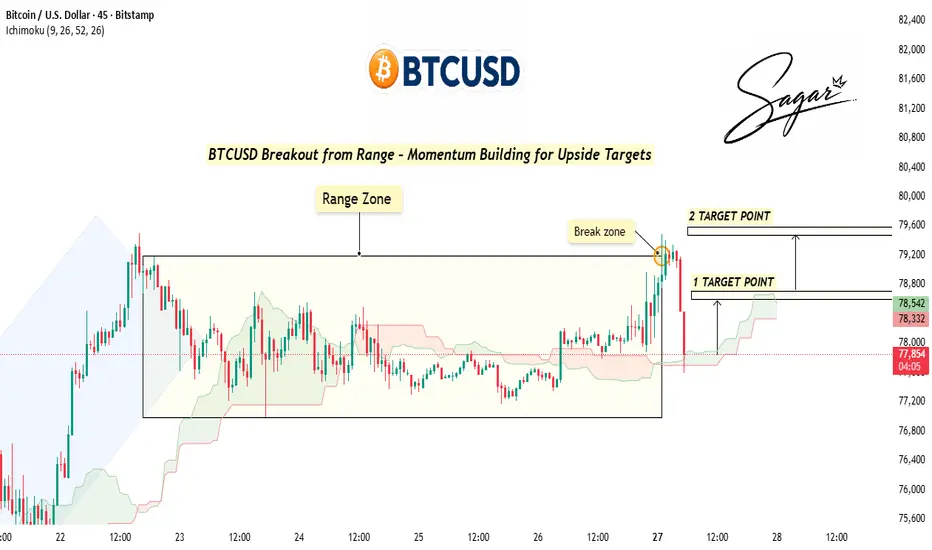
BTCUSD Range Expansion: Breakout Signals Bullish ContinuationBTCUSD has transitioned from a prolonged consolidation phase into a breakout scenario, clearing the upper boundary of the established range. This move signals a shift in market structure toward a bullish bias, supported by price holding above the Ichimoku cloud.
However, the immediate rejection after the breakout suggests potential short-term volatility, indicating either a liquidity grab or early profit-taking. For continuation, price must maintain strength above the breakout zone, which now acts as key support.
As long as this level holds, upside targets remain in focus near 78.8K and 79.6K. A failure to sustain above the breakout area could result in a pullback back into the prior range before any further directional move.
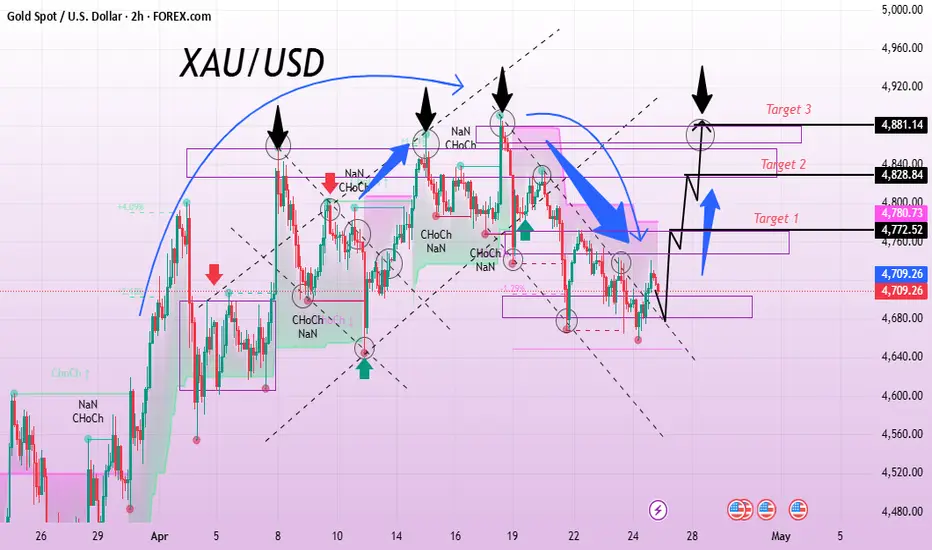
Gold Set for Potential Surge Ahead🚀 The XAU/USD chart shows a recent bearish correction after a strong bullish trend, with price breaking below a rising channel and forming lower highs. Multiple Change of Character signals indicate short-term weakness, but price is now consolidating near a key demand zone around 4,680–4,700, suggesting possible accumulation before a reversal.
Fundamentally, uncertainty following the attack on Donald Trump may increase safe-haven demand for gold, supporting a bullish outlook 📊. If buyers step in and confirm higher lows, momentum could shift upward.
The first target is 4,772, where initial resistance may appear 🎯. A successful breakout could push price toward the second target at 4,828, aligning with previous resistance levels 📈. With continued bullish strength and geopolitical tension, price may extend to the third target at 4,881 💰.
Overall, the setup favors a potential recovery, but confirmation is still required before strong continuation 🔥
If you found this analysis helpful, don’t forget to LIKE 👍 and COMMENT 💬!
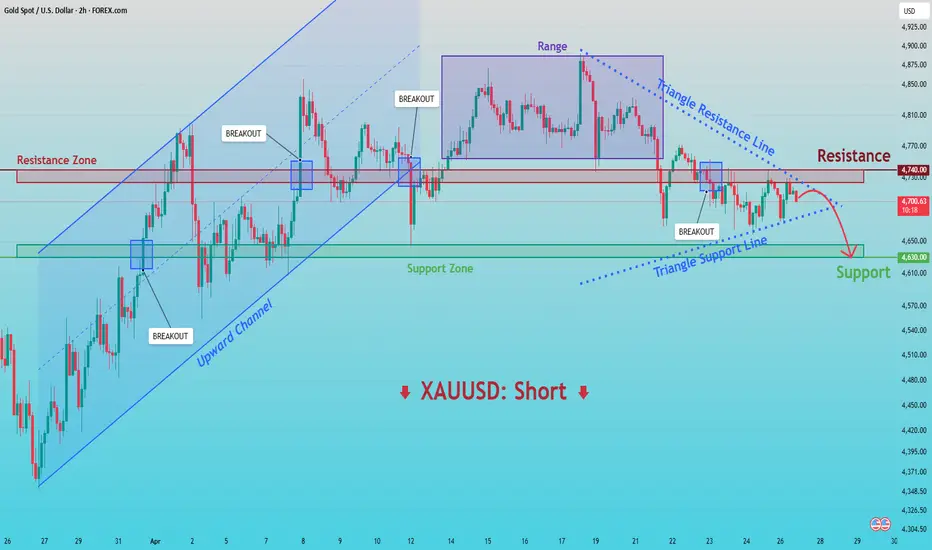
XAUUSD: Triangle Compression - Potential Drop to 4,630$ SupportHello everyone, here is my breakdown of the current XAUUSD setup.
Market Analysis
Gold previously traded within an upward channel, forming higher lows and confirming bullish momentum. After reaching zone around 4,800, price started to lose strength and entered a consolidation phase, forming a triangle structure with multiple breakouts and retests.
Currently, XAUUSD is trading below the 4,740 resistance zone while holding above the 4,630 support zone. A recent rejection from resistance and continued compression inside the triangle suggest building bearish pressure.
My Scenario & Strategy
As long as XAUUSD remains below the 4,740 resistance and respects the triangle structure, the bearish scenario remains valid. A rejection from this area could push price toward the 4,630 support (TP1).
However, if price breaks above 4,740 and holds, the bearish scenario would be invalidated, opening the path for further upside.
That’s the setup I’m tracking. Thank you for your attention, and always manage your risk.
Gold Breaks Triangle Structure - Possible Rebound Toward 4,800$Hello traders! Here is my technical outlook based on the current XAUUSD (4H) chart structure. Gold previously traded within a range, showing consolidation before breaking down and confirming bearish pressure. After the drop, price found a bottom and initiated a recovery, forming an ascending channel.Currently, the price is holding above the 4650 buyer zone, which acts as a strong support, approaching the 4800 resistance level (seller zone). At the same time, we are seeing a break of the triangle structure, which indicates buyer interest and bullish bias. A potential bounce from the 4650 zone could push the price to the 4800 resistance level (TP1). Please share this idea with your friends and click Boost 🚀
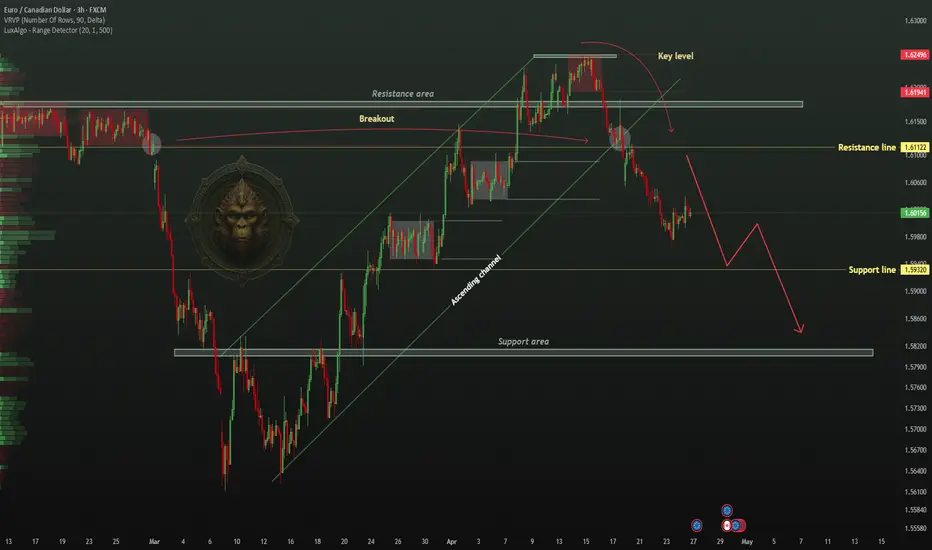
TheGrove | EURCAD Sell | Idea Trading AnalysisYou can expect a reaction on Ascending channel, the direction of selling from the specified Resistance line,
EURCAD moving higher as it tests the strong resistance level..
We expect a bearish move from the confluence zone.
Hello Traders, here is the full analysis.
I think we can soon see more fall from this range! GOOD LUCK! Great SELL opportunity EURCAD
I still did my best and this is the most likely count for me at the moment.
-------------------
Traders, if you liked this idea or if you have your own opinion about it, write in the comments. I will be glad 🤝
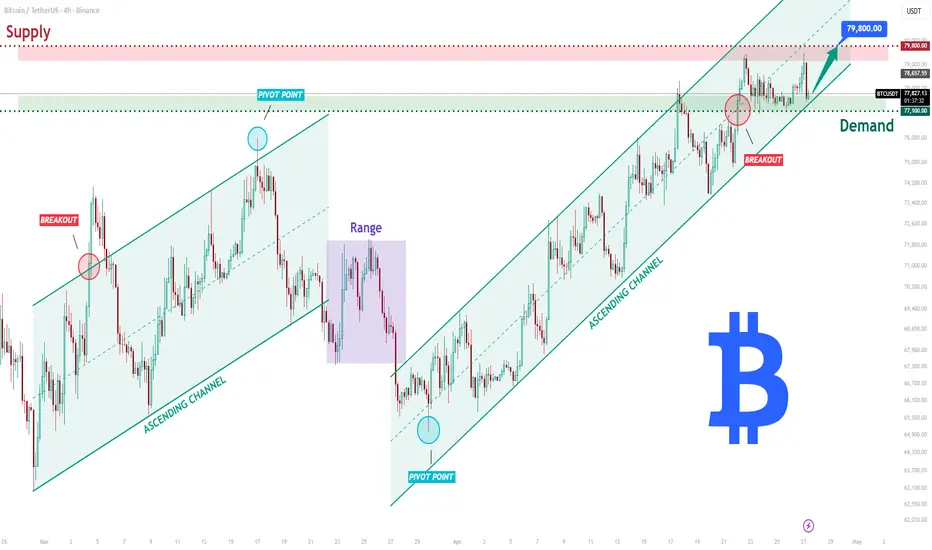
BTCUSDT Long: Trend Support Holds - Bulls Eye 79.800$Hello traders! Here’s my technical outlook based on the current BTCUSDT (4H) chart structure. Bitcoin previously traded within an ascending channel, confirming strong bullish momentum. After a period of consolidation, price found a bottom at a pivot point and continued its upward movement within a new ascending channel.
Currently, price is holding above the 77,000 demand zone, which acts as key support, while approaching the 79,800 supply zone. A recent breakout and retest confirm buyer strength, while the channel structure continues to support price from below.
As long as BTCUSDT holds above the 77,000 support and respects the ascending channel, the bullish bias remains valid. A continuation from this zone could push price toward the 79,800 resistance (TP1). Manage your risk!
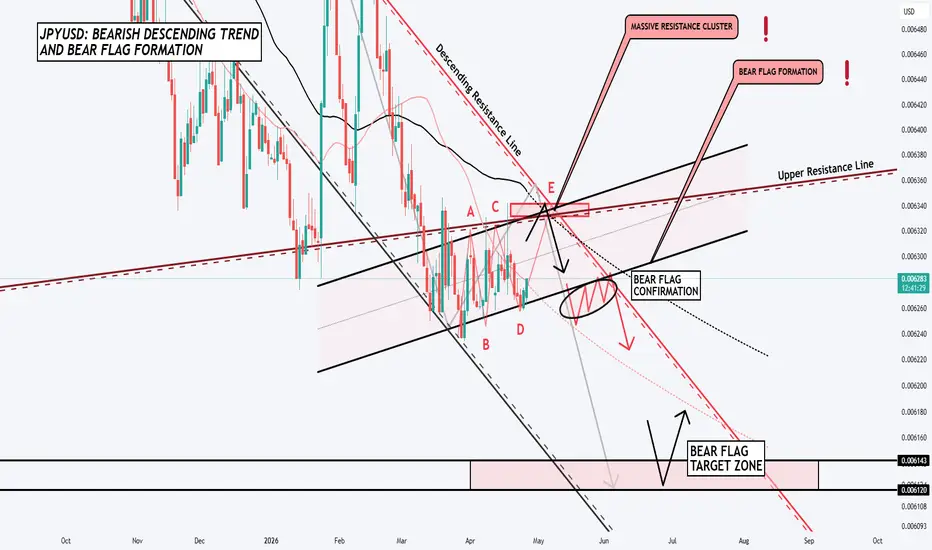
JPYUSD: Descending Trend and Bear-Flag Point to Bearish Target!Hello There,
welcome to my new analysis about JPYUSD on the daily timeframe perspective. JPYUSD emerged with strong bearish pressure increasing bearish alignments and is forming one lower low after another. Right now, I have spotted a lot of signs that point towards the bearish direction's continuation.
When looking at my chart, we can watch there how JPYUSD pulled back from this crucial descending resistance line several times. This is a strong resistance, which will likely keep being a resistance within the next times. Also, JPYUSD has this upper resistance line as a major resistance.
The fact that JPYUSD now trades below the upper resistance line makes it a really bearish setup. Below this structure, JPYUSD is forming this determining bear flag formation. The formation is going to complete with a pullback from the massive resistance cluster as seen in my chart.
Once the pullback happens and JPYUSD continues to the downside, it is going to activate the bear flag target zone with a final breakdown below the bear flag lower boundary. Right now, there is not a high possibility of JPYUSD reversing to the bullish side because the resistances and bearish signs are just too strong.
Once the formation has been completed and the final targets reached, further assumptions need to be made. It will be important to determine if JPYUSD has the ability to reverse once the final targets have been reached.
In this manner, thank you a lot for watching!
The support is highly appreciated.
VP
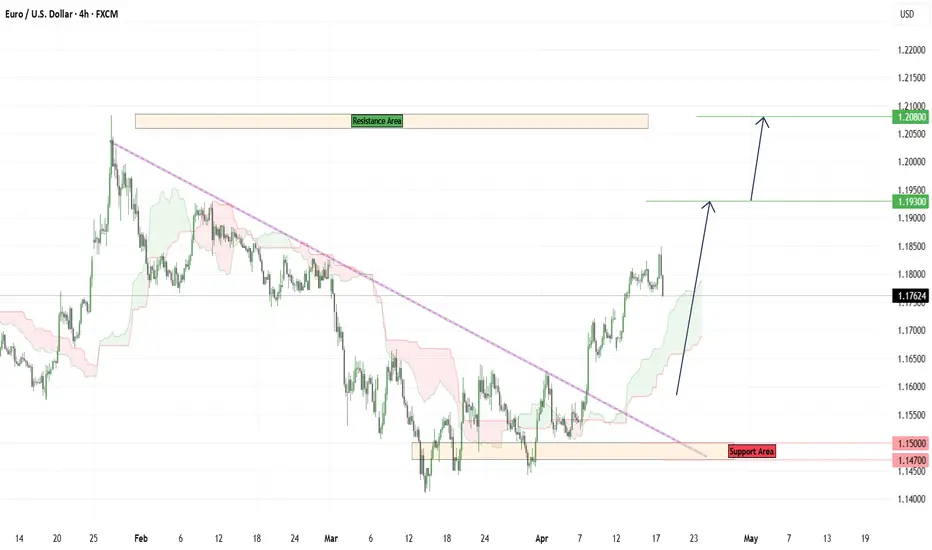
EURUSD – Market Long AnalysisEURUSD – Market Structure Analysis
After an extended corrective phase, EURUSD formed a solid consolidation base, reflecting a period of accumulation. The recent strong bullish impulse indicates a shift in sentiment, as price successfully broke above the descending trendline and short-term resistance, confirming early bullish strength.
At the moment, price is holding above the reclaimed structure and building support around the recent breakout zone. This behavior highlights increasing buyer control, and as long as this structure remains valid, further upside continuation remains favorable.
📊 Key Trading Scenarios
✅ Bullish Scenario 🚀
* Price maintains strength above the 1.1700 – 1.1650 support region
* Continued formation of higher highs & higher lows confirms bullish structure
🎯 Target 1: 1.1930
🎯 Target 2: 1.2080
❌ Bearish Scenario ⚠️
* A confirmed breakdown below 1.1500 may weaken bullish momentum
🎯 Downside Target 1: 1.1470
🎯 Downside Target 2: 1.1400
📍 Critical Levels to Monitor
🔴 Immediate Resistance: 1.1930
🔴 Major Resistance: 1.2080
🟢 Key Support Zone: 1.1700 – 1.1650
⚠️ Trading Insight
Price is currently reacting after a strong bullish breakout and is holding above a key support region. Sustaining above this level would strengthen the bullish continuation outlook, while a failure to hold may trigger a corrective move toward lower demand zones.
Note:
This analysis is based on current price action and market structure. Market conditions can change at any time—always apply proper risk management.
27.04.26 Daily ForecastPairs on Watch -
FX:GBPJPY : This pair is positioned at the highs in a similar structure to USDJPY, however this pair is in session where we know momentum can step in quickly and the small stacks in price can go sooner than we think. I am waiting for price to break out of the small piece of consolidation its currently in and then any lower timeframe continuations I will look to get short.
FX:USDJPY : Price is still looking bullish and has a reason to head to the highs with them being unfulfilled. We can see an expanding type structure is currently forming where it almost becomes a running channel to break out to the upside, if this happens I will look for a lower timeframe flag to get long. The base may not be in just yet which is fine, a bit of patience and wait for the conformation.
FX:GBPUSD : With where the DXY is positioned we could get a position shape up on this pair in either direction. With the gap on the DXY it is whether the fill was enough for it to continue selling, if that is the case we could see price break above the high on GBPUSD and form a continuation where we can get long into the next high.

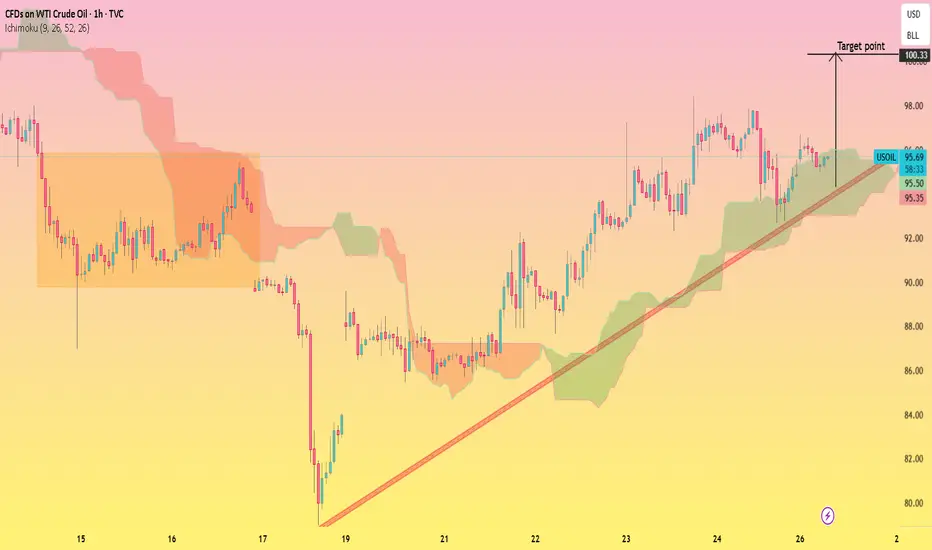
WTI Crude Oil — Bullish Continuation Toward 100.33
This 1-hour chart of WTI Crude Oil shows a strong recovery from the mid-chart bottom, followed by a steady uptrend supported by a rising trendline. Price action is holding above the Ichimoku Cloud, indicating sustained bullish momentum.
Higher lows and higher highs confirm trend continuation, with price recently bouncing from both the ascending trendline and cloud support. The structure suggests buyers remain in control as long as price respects these dynamic support zones.
**Target:**
* Upside target: **100.33**
A continuation above recent highs and trendline support increases the probability of reaching this level. A breakdown below the cloud and trendline would weaken the bullish outlook.
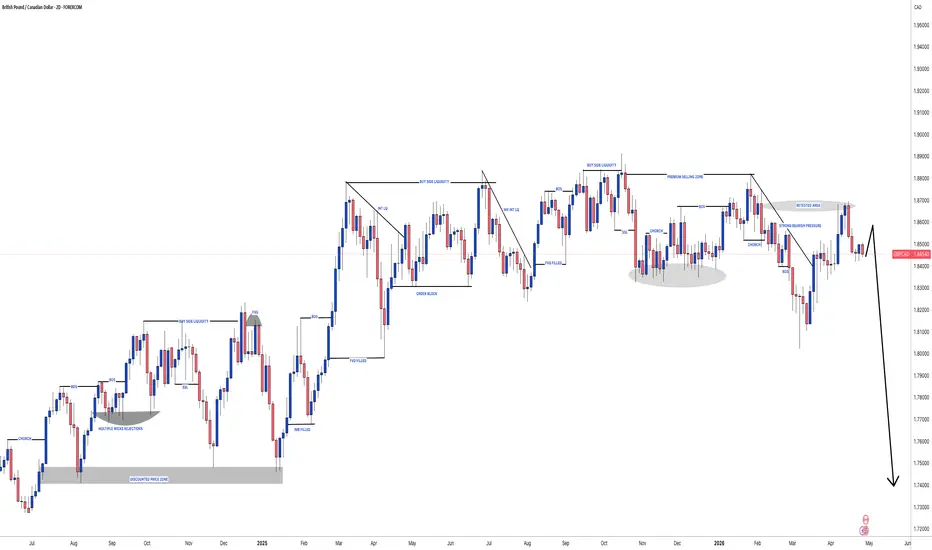
#GBPCAD: Up To +1100 Pips Selling Opportunity, One Not To Miss! Dear fellow traders,
The GBPCAD pair has been consolidating for two days. It’s trading in a range pattern and hasn’t shown a clear trend yet. To confirm a trend for this trade, we need a strong bearish impulse move that pushes the price to its yearly low. As shown on the chart, we can enter the trade and set our take profit at the arrow end.
Good luck and trade safely!
The Setupsfx_ Team
Euro Bullish Channel - Potential Move to 1.1790 After CorrectionHello traders! Here is my technical outlook based on the current EURUSD (3H) chart structure. EURUSD previously traded within a range, showing consolidation before a breakdown that confirmed bearish pressure. After the drop, price found a bottom and initiated a recovery phase, forming an ascending channel with higher lows. Currently, price is holding above the 1.1710 buyer zone, which acts as strong support, while approaching the 1.1790 resistance level (seller zone). At the same time, a breakout from the previous structure and continued respect of the trendline indicate growing bullish momentum. As long as EURUSD holds above the 1.1710 support and respects the ascending channel, the bullish bias remains valid. A potential bounce from this zone could push price toward the 1.1790 resistance (TP1). Please share this idea with your friends and click Boost 🚀

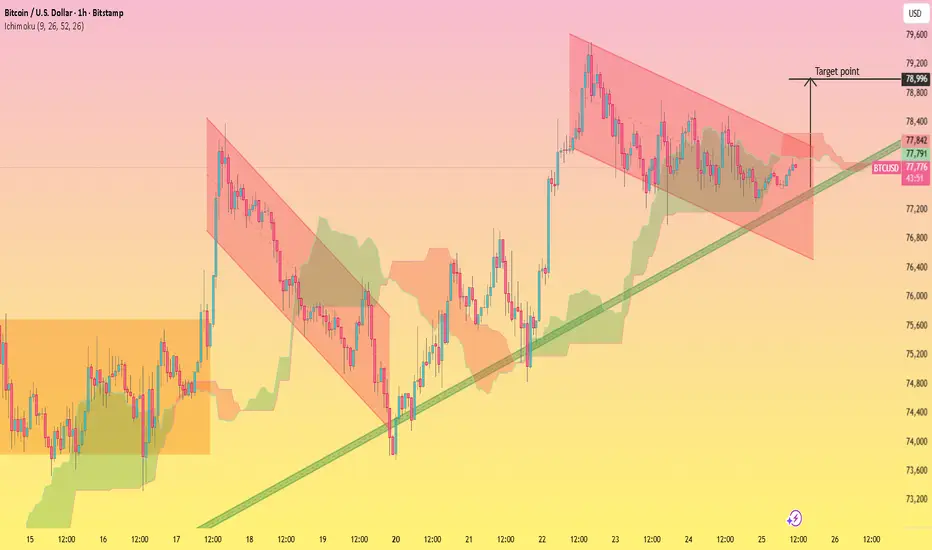
BTCUSD Descending Channel Breakout with Bullish Trendline..This 1H BTCUSD chart shows price previously respecting a **descending channel** (marked in red), indicating short-term bearish pressure. However, the structure shifted after a strong bullish impulse from the lower support area, where price bounced off a **rising trendline** (green).
Currently, price is consolidating inside a range while holding above the ascending trendline and partially supported by the Ichimoku cloud. The descending resistance is still in play, but momentum is slowly favoring buyers as higher lows are being formed.
A breakout above the descending channel resistance would confirm bullish continuation, especially if price sustains above the cloud and trendline confluence.
**🎯 Target:**
* **Primary Target:** 78,900 – 79,000 zone
* This aligns with the projected breakout move and prior resistance area.
**⚠️ Key Levels to Watch:**
* Support: 77,200 – 77,400 (trendline + cloud support)
* Resistance: 78,400 → 79,000 (channel top + target zone)
Descending Trendline Compression into Demand — Potential BullishThis chart shows a market that has been in a clear short-term downtrend, defined by a descending trendline connecting lower highs. Price has now compressed into a key horizontal demand zone (~4700 area) while simultaneously interacting with that trendline — this is where things get interesting.
What’s happening:
Downtrend structure: Lower highs and lower lows respected the red descending trendline.
Demand zone: Price repeatedly reacts around the highlighted zone, suggesting buyers are active there.
Confluence: The latest touch combines trendline support + horizontal demand, increasing the probability of a reaction.
Bullish scenario (your drawn path):
A bounce from the demand zone holds.
Price breaks back above the descending trendline.
Reclaims the 4,742–4,754 resistance zone.
If that level flips to support, continuation higher becomes likely.
Bearish risk:
Clean breakdown below the demand zone invalidates the setup.
That would likely lead to continuation of the broader downtrend with new lows.
Key levels:
Support: ~4700 (demand zone)
Resistance: 4,742 → 4,754
Trend trigger: Break and hold above the descending trendline
Read on structure:
Right now this is not yet bullish — it’s a potential reversal zone. Confirmation comes only after:
Trendline break
Higher low formation
Resistance reclaim

Silver Rally with Incoming with Big TargetsXAGUSD is showing a strong potential bullish reversal after forming a clear inverse head and shoulders pattern, signaling a shift in market structure 📊. Price has respected the descending channel and is now attempting a breakout, indicating growing buyer momentum 🚀. The right shoulder formation suggests accumulation, while recent candles show rejection from lower levels, adding confidence to bullish continuation.
If momentum sustains, the first target at 75.62 looks achievable as immediate resistance turns into support 🎯. A clean breakout above this zone could push price toward the second target at 78.58, where stronger resistance may appear. Continued bullish pressure may drive price further to the third target at 80.40, completing the projected move 📈.
Overall, buyers are stepping in with strength, and trend reversal confirmation is building. Proper risk management remains key while following this bullish setup ⚡
If you found this analysis helpful, don’t forget to LIKE 👍 and COMMENT 💬!

Descending Trendline Breakout – Bullish Targets Ahead Price has decisively broken above a strong descending trendline that had been acting as dynamic resistance for an extended period, indicating a clear shift in market structure. This breakout suggests that sellers are losing control while buyers are stepping in with increased momentum.
Before the breakout, price was consolidating near a well-defined demand zone, showing signs of accumulation. The move above the trendline confirms bullish intent, especially as price is now attempting to hold above this level—potentially turning previous resistance into new support.
If this structure holds, the market is likely to continue its upward move toward the next key resistance levels marked as targets at 187.311 and 187.707. These zones represent areas where price may face reactions, but a strong bullish push could lead to continuation beyond them.
Overall, as long as price maintains support above the broken trendline and continues forming higher lows, the bullish outlook remains valid. Any rejection or breakdown below the trendline, however, could signal a false breakout and shift the market back into consolidation or bearish pressure.

Gold Key Levels & Trend OutlookThis chart highlights key support and resistance levels for Gold, indicating potential areas for price bounce, pullback, or breakout. Key levels: 4659–4683 (strong support), 4701–4733 (minor
resistance / watch zone), 4768–4797 (key resistance / target), 4831–4880 (major resistance / top target). Traders can use this analysis for planning entries, exits, and managing risk.
