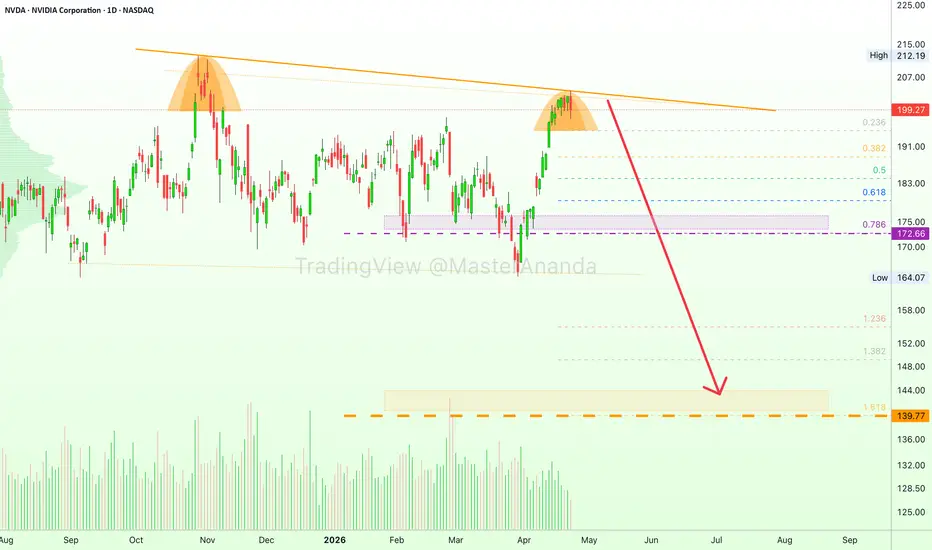
NVIDIA Corporation (NVDA) just produced a six months long lower high. April 2026 vs October 2025. This is a major bearish signal that points to the unfoldment of a bearish wave. This signal is coming in today and confirmation is still needed.
Additional bearish signals (back to basics):
» Decreasing volume for years.
» Bearish MACD, RSI & STOCH.
» Bearish stock market based on market cycle.
NVDA D RSI:
When the RSI peaked in October 2025, it led to several months of bearish action. The same signal is now being repeated.
NVDA D MACD:
The MACD peaked yesterday. Notice how the histogram is already dropping.
NVDA D STOCH:
The stochastic is already crashing down with plenty of room to move lower. The bearish signal on this indicator is many times stronger compared to October 2025.
You can sell everything or go short. There is no need to wait or hold because it will be a very strong correction. If you enjoy the stock, it is better to sell to buy back when prices are low.
» Sell the ones trading at resistance—like this one.
» Buy the ones trading at support—like Crypto (altcoins).
Namaste.
Trade active
The bearish chart structure is about to become invalid.» If NVDA moves above the ATH and starts growing, the bearish potential of this chart is nullified.
» On the other hand, if the ATH is confirmed as resistance—daily, weekly—then the bearish potential strengthens.
Thanks a lot for your continued support.
Namaste.
🔥 TOP Results Leverage (Altcoins)
t.me/masteranandatrades/8266
🔶 TOP Results Lev. & Spot (Crypto)
t.me/masteranandatrades/8135
🚨 FREE 3-25X Leverage Trade-Numbers 👇
t.me/masteranandatrades/8443
t.me/masteranandatrades/8266
🔶 TOP Results Lev. & Spot (Crypto)
t.me/masteranandatrades/8135
🚨 FREE 3-25X Leverage Trade-Numbers 👇
t.me/masteranandatrades/8443
Related publications
Disclaimer
The information and publications are not meant to be, and do not constitute, financial, investment, trading, or other types of advice or recommendations supplied or endorsed by TradingView. Read more in the Terms of Use.