GOLD: Waiting For The Buy Model To Set UpIn this Weekly Market Forecast, we will analyze Gold for the week of April 27 - May1st.
Gold has been going no where but sideways. But I believe that changes this week.
Not interested in shorting this market. Not with fundamentals supporting higher prices at the moment.
FOMC is Wednesday, and my weaken the USD. That would allow GOLD to surge, as it is struggling to move lower from the -FVG.
Patience will allow the market to unfold, and give me a queue to enter a valid buy model.
Enjoy!
May profits be upon you.
Leave any questions or comments in the comment section.
I appreciate any feedback from my viewers!
Like and/or subscribe if you want more accurate analysis.
Thank you so much!
Disclaimer:
I do not provide personal investment advice and I am not a qualified licensed investment advisor.
All information found here, including any ideas, opinions, views, predictions, forecasts, commentaries, suggestions, expressed or implied herein, are for informational, entertainment or educational purposes only and should not be construed as personal investment advice. While the information provided is believed to be accurate, it may include errors or inaccuracies.
I will not and cannot be held liable for any actions you take as a result of anything you read here.
Conduct your own due diligence, or consult a licensed financial advisor or broker before making any and all investment decisions. Any investments, trades, speculations, or decisions made on the basis of any information found on this channel, expressed or implied herein, are committed at your own risk, financial or otherwise.
Support and Resistance

Euro Bullish Channel - Potential Move to 1.1790 After CorrectionHello traders! Here is my technical outlook based on the current EURUSD (3H) chart structure. EURUSD previously traded within a range, showing consolidation before a breakdown that confirmed bearish pressure. After the drop, price found a bottom and initiated a recovery phase, forming an ascending channel with higher lows. Currently, price is holding above the 1.1710 buyer zone, which acts as strong support, while approaching the 1.1790 resistance level (seller zone). At the same time, a breakout from the previous structure and continued respect of the trendline indicate growing bullish momentum. As long as EURUSD holds above the 1.1710 support and respects the ascending channel, the bullish bias remains valid. A potential bounce from this zone could push price toward the 1.1790 resistance (TP1). Please share this idea with your friends and click Boost 🚀

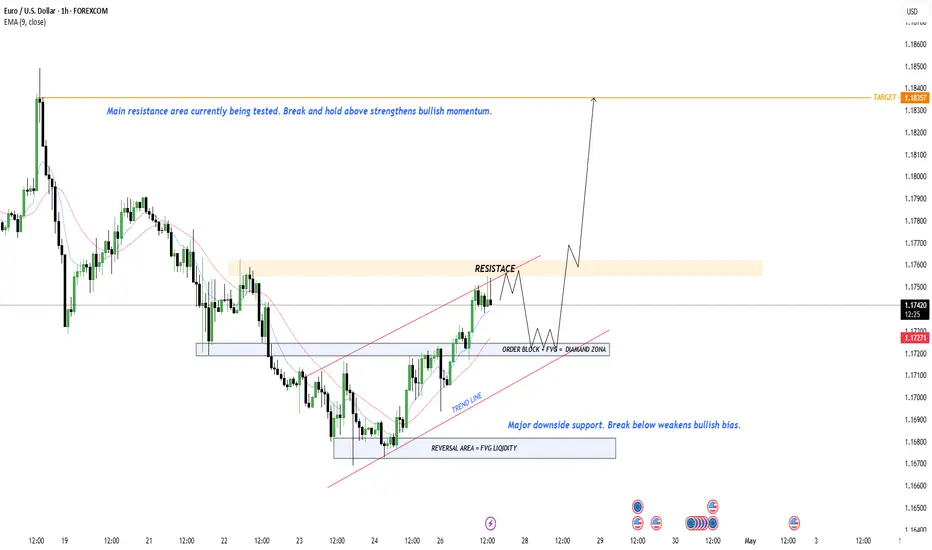
EURUSD 1H: Approaching Resistance After Trendline BounceEURUSD is approaching a key resistance zone after a bullish move from the order block and trendline support. The structure shows higher lows, indicating strengthening bullish momentum while price remains supported above the demand zone.
If price breaks and holds above the 1.1760 resistance area, continuation toward the 1.1835 target becomes more likely. However, rejection from resistance could lead to a pullback toward the 1.1720 order block support before another bullish attempt.
Bias:
Bullish while price holds above the order block and trendline support, with upside potential toward 1.1835.
Educational purposes only — not financial advice.
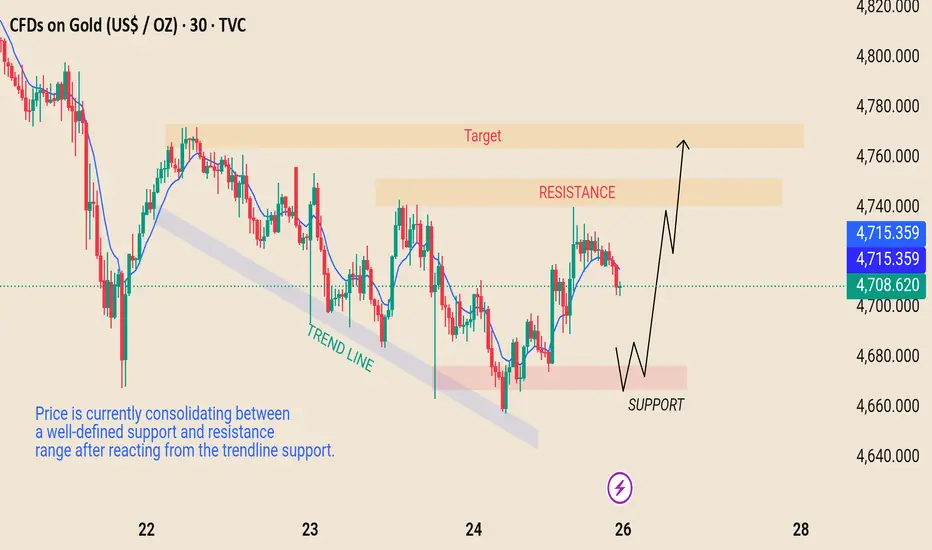
Range Structure: Support Holding, Resistance AheadPrice is currePrice is currently reacting near a short-term resistance zone after bouncing from a defined support area and trendline. Structure shows a potential range with higher lows forming, suggesting buyers are attempting to gain control.
A break and hold above resistance could open the path toward the highlighted target zone, while rejection may lead to another retest of support. Key levels remain clearly defined, so monitoring price action around these zones is important for confirmation.
This analysis is for educational purposes only and not financial advice.
EURUSD Bearish Reversal at Resistance – Shorts FavouredEUR/USD is currently experiencing a bearish trend, confirmed by both technical indicators and fundamental factors chart shows price within a descending channel, forming lower highs and lower lows, indicating sellers are in control.
EURUSD the trend remains bearish, with the EMA50 providing dynamic resistance. The Elliott Wave pattern and price action point to a further drop below 1.1700, confirming the downward momentum. If 1.1700 breaks, the pair could quickly head toward 1.1625, which is a crucial support level. on the fundamental side, the US Dollar remains strong due to ongoing inflationary concerns and hawkish Fed expectations, delaying rate cuts into late 2026. This is keeping US yields elevated, further pushing the dollar up and applying pressure on EUR/USD. Additionally, geopolitical tensions in the Middle East are fueling a risk-off sentiment, where the dollar benefits as a safe haven. On the euro side, Germany's growth forecast has been downgraded, and overall Eurozone growth is slowing, adding further bearish pressure to the EUR.
Moreover, the European Central Bank (ECB) remains uncertain about future rate hikes, which is making investors cautious about the euro, despite rising inflation from energy costs linked to the ongoing conflict in the Middle East. The ECB's indecision about further tightening contrasts with the Fed’s clear stance, creating further divergence between the euro and dollar.
Tecnically the combination of strong US fundamentals, weak Eurozone outlook, and bearish technical signals all suggest that EUR/USD will likely continue to trend lower, targeting 1.1660 and 1.1625. A break below these levels could lead to further downside, with key levels around 1.1600 to watch closely.
You may find more details in the chart,
Trade wisely best of luck buddies.
Ps; Support with like and comments for better analysis Thanks for Supporting.

GOLD - Technical AnalysisICMARKETS:XAUUSD bounced off the 4668 support level toward the end of Friday’s session following a long squeeze, thereby breaking the local bearish structure. The market’s next move depends on geopolitical developments.
The dollar closed Friday in the red, and technically, the index looks poised to continue its decline. Oil is stagnant. Gold, technically, is still under pressure from bears, but Friday’s session closed above Thursday’s close, which gives us positive signals, provided that the fundamental and geopolitical backdrop supports the market. (The previous idea—a break below 4668—remains valid, provided gold returns to that level.) This coming week, all eyes are on the U.S.-Iran negotiations, as well as fundamental data: the Fed’s rate decision, the regulator’s meeting, and GDP and inflation figures.
Resistance levels: 4740, 4795
Support levels: 4668, 4644, 4600
Technically, at the moment, I expect a bounce from 4700 (4688) and a retest of the 4740 liquidity zone. A close above 4740 will open the door for continued growth toward 4800.
However, if the price fails to react at 4700 and retreats to 4668, the likelihood of a further decline will resume.
Best regards, R. Linda!

GOLD Price Update – Clean & Clear ExplanationGold market is currently in a broader bearish structure, with price respecting a descending trendline and forming consistent lower highs. This confirms that sellers have been in control over the past sessions. However, in the short term, price is showing signs of a potential bullish retracement from a key demand zone.
Recently, price tapped into a strong support area around 4,690 – 4,700, where buyers stepped in and pushed the market upward. This reaction suggests liquidity was taken from the downside, and now the market is attempting to rebalance.
At the moment, price is trading near an internal structure zone, where we can expect some consolidation or minor pullback before the next move. The highlighted setup shows a possible buy opportunity, but only after a clean reaction or confirmation from this zone.
If buyers maintain control, the next target is the major resistance zone around 4,780 – 4,785, which aligns with the higher timeframe supply and descending trendline. A break above this resistance would signal a potential shift in structure and continuation toward higher levels.
On the downside, if price fails to hold the current zone and breaks below 4,690, it would invalidate the bullish idea and likely lead to a continuation of the bearish trend, targeting lower liquidity levels.
Ps; Support with like and comments for better analysis Thanks for Supporting.

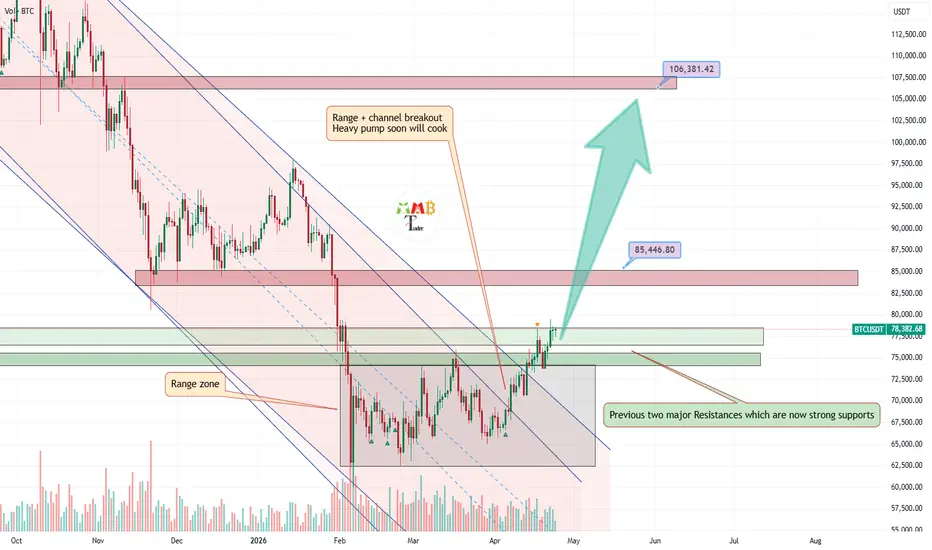
Bitcoin–Descendng Chanel and Trendline Broken, Bull Market aheadBitcoin has achieved a significant technical breakout. Both the daily descending channel and the d escending trendline resistance have now been broken to the upside. This is a major structural shift, as these two confluent resistance levels had been capping price action for an extended period.
Following the breakout, the price has also completed a valid retest of the broken resistances. In technical analysis, a successful retest occurs when the price returns to the broken resistance level (which now acts as support) and holds above it, confirming that the breakout is genuine rather than a false move. Additionally, a period of range-bound consolidation after the breakout further strengthens the new support zone.
Now that the former resistances have been transformed into strong support levels, the path of least resistance is to the upside. The next major psychological and technical target is the 80,000 level. Once Bitcoin is able to break and close above 80K, it is expected to trigger the next phase of the bull market.
This anticipated bull market comes after approximately one year of ranging and dumping, during which Bitcoin consolidated, shook out weak hands, and built a base for the next leg higher.
✍🏼Author's word: Like & comment(your thoughts) if you found it helpful.🩷
XAU/USD | Gold at a Key Decision Level – Waiting for Direction!By analyzing the #Gold chart on the 4H timeframe, we can see that price opened the week with a bearish gap down to around $4672, but buyers quickly stepped in and pushed it back up toward $4739. However, this move lacked continuation and price is now trading around the $4692 region, sitting right at a critical support area.
From a structural perspective, the $4680 – $4700 zone is currently acting as a key demand area. As long as price manages to hold and stabilize above this level, we can expect another bullish attempt toward the nearest supply zones at $4725 – $4750, followed by $4780 – $4820 as the next major resistance cluster. In this case, short-term upside targets would be $4725, $4750, and then $4780.
On the other hand, if price fails to hold above this demand zone and we see a clean breakdown, the market could enter another bearish leg toward lower liquidity levels. In that scenario, the next downside targets would be $4665, followed by $4640, and potentially $4600 as selling pressure builds.
Overall, this is a key reaction zone where the next directional move will likely be determined. Keep in mind that the market remains highly sensitive to geopolitical developments, and any shift in tensions between Iran and the US could quickly change the direction of Gold.
Please support me with your likes and comments to motivate me to share more analysis with you and share your opinion about the possible trend of this chart with me !
Best Regards , Arman Shaban

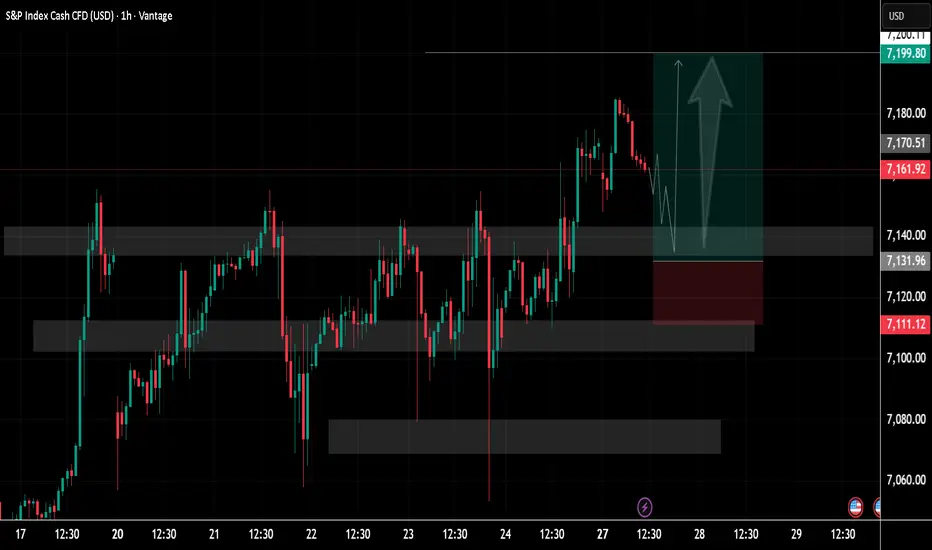
SP500 Price Update – Clean & Clear ExplanationS&P 500 in a structured bullish setup forming after a period of consolidation.
Price action has been ranging between multiple clearly marked zones, with repeated reactions from both demand and supply areas. Earlier sessions show choppy movement, but the market gradually builds higher lows and higher highs, signalling a shift toward bullish control.
A strong impulsive move upward breaks above the mid-range resistance, followed by a modest pullback. The highlighted grey zones represent key support and resistance levels, with the current price hovering just above a previously tested resistance—now acting as potential.
The projected path shows a temporary dip (liquidity grab or retest) before a continuation upward, aligning with a classic break-and-retest bullish structure.
Ps; Support with like and comments for better analysis Thanks for Supporting.
EUR/CAD: Strong Bearish Pressure📉EURCAD is currently experiencing significant bearish pressure this morning.
A bearish breakout of the support line of a flag pattern, observed within a clear intraday downtrend on an hourly timeframe, provides strong confirmation of this movement.
I anticipate that the price will soon reach the 1.5967 level.

USDCHF – Follow the Trend!USDCHF is currently trading below a strong resistance / supply zone.
This area has acted as resistance multiple times before… and now it’s being retested again.
As long as price holds below this zone, the bias remains bearish and we will be looking for trend-following short setups.
Clean structure. Clear level. Simple plan.
Will sellers step in again? 🤔
⚠️ Disclaimer: This is not financial advice. Always do your own research and manage risk properly.
📚 Stick to your trading plan regarding entries, risk, and management.
Good luck! 🍀
All Strategies Are Good; If Managed Properly!
~Richard Nasr

Gold Rejection From Resistance Targets Lower LevelsGold is pulling back from a lower high and approaching the 0.5–0.618 Fibonacci support zone, where buyers may attempt to stabilize price. The overall structure shows rejection from resistance, suggesting short-term bearish pressure while price remains below the resistance band.
If price reacts positively from the 4,721–4,708 Fibonacci support zone, a corrective move back toward the 4,749 resistance may occur. However, a confirmed break below the 0.618 level could expose the downside toward the 4,669 target zone.
Bias:
Short-term bearish below resistance, with downside risk increasing if Fibonacci support fails.
Educational purposes only — not financial advice.

EURJPY - The end of the correction will lead to an uptrend FX:EURJPY remains in a bullish trend. Signs of the correction coming to an end are emerging, which generally gives the market a chance to continue its upward movement.
The currency pair has been in a bullish trend since last March. Technically, the bullish structure remains intact. The weak Japanese yen is supporting the euro’s upward movement.
Technically, the price is breaking through the resistance of the local correction and local consolidation. If the bulls keep the price above 186.8–186.87, we can expect growth to continue in the medium term.
Resistance levels: 187.92, 187.70
Support levels: 186.87, 186.43
A retest of 186.87 and price consolidation above that level will confirm the price’s readiness for growth. Zones of interest: 187.7–187.95
Best regards, R. Linda!

THE KOG REPORT THE KOG REPORT:
In last week’s KOG Report we said we would want price to come down into the lower defence region of 4785-95 which is where we wanted the long trade to come from. On open, we managed to breach the 1H RB and activate the bias level which brought us to the level we wanted for the short but as you can see, we broke below the defence region. We had marked the lower level for another attempt which we did get successfully, resulting in the long and then more ranging price action which gave us some extremely good scalping opportunities.
During the week we gave our updates on the path and the RB targets which worked well but we didn’t get that higher level we wanted.
A successful week in Camelot however with our indicators and algo playing their part, not only on gold but the numerous pairs we trade and analyse.
So, what can we expect in the week ahead?
Again, due to news over the weekend we may open with gaps across the markets for that reason we’ll say we’ll stick with the plan but traders need to be aware of the extreme movement we may see from the open.
We have a resistance level above at the 4735 level with support below at 4704 and below that 4675-90. We would need 4735 to hold price down on the open to then target the breach of 4710 making it easier for price to attempt the lower levels before attempting the long trade from the lower defence regions sitting at the 4610-20 region at extreme. We need to hold above that level to go higher, failure to do so can result in a lower move into the 4550s.
On the flip, higher defence here sits at the 4754 level, we’ll use that level as the bias for this week and say we will need a strong break above to then go higher.
We would expect a choppy open and first day of the week, while price should settle closer to the FOMC statement which is expected on Wednesday. We’ll update traders with the FOMC KOG Report prior to the statement.
RED BOX TARGETS:
BREAK ABOVE 4710 for 4729, 4735, 4741, 4750 and 4756 in extension of the move
BREAK BELOW 4689 for 4680, 4675, 4665 and 4658 in extension of the move
Please do support us by hitting the like button, leaving a comment, and giving us a follow. We’ve been doing this for a long time now providing traders with in-depth free analysis on Gold, so your likes and comments are very much appreciated.
As always, trade safe.
KOG

EURUSD: Massive 1:9 RR Trade | RBS & Gap ConfluenceRBS zone (Resistance Become Support). The second zone is a 4H timeframe Gap, which aligns with the 8H timeframe. Price got rejected on the 1H timeframe. Stop Loss is 13 pips, and the target is 126 pips. We need a 1H candle close below 1.16792 to continue towards the final target

GBPUSD Downtrend Continuation: Sellers in ControlGBP/USD is showing a bearish reaction mainly due to a confluence of technical resistance and underlying fundamental pressure.
GBPUSD the market likely performed a buy-side liquidity sweep above recent highs, triggering stop orders before reversing downward. This is a common smart money pattern that leads to bearish continuation On the fundamental side, the move is supported by relative strength in the US Dollar and/or weakness in the British Pound. This can be driven by factors such as:
On the technical side, price rallied into a strong resistance / supply zone around 1.3550–1.3580, which has previously acted as a rejection area. The market attempted to break higher but failed, forming rejection wicks and weak follow-through, indicating that buyers are losing strength. Additionally, price respected a descending trendline, confirming that the upside momentum is limited. This type of behaviour often signals a distribution phase, where institutional traders sell into buying pressure.
You may find more details in the chart,
Trade wisely best of luck buddies.
Ps; Support with like and comments for better analysis Thanks for Supporting.

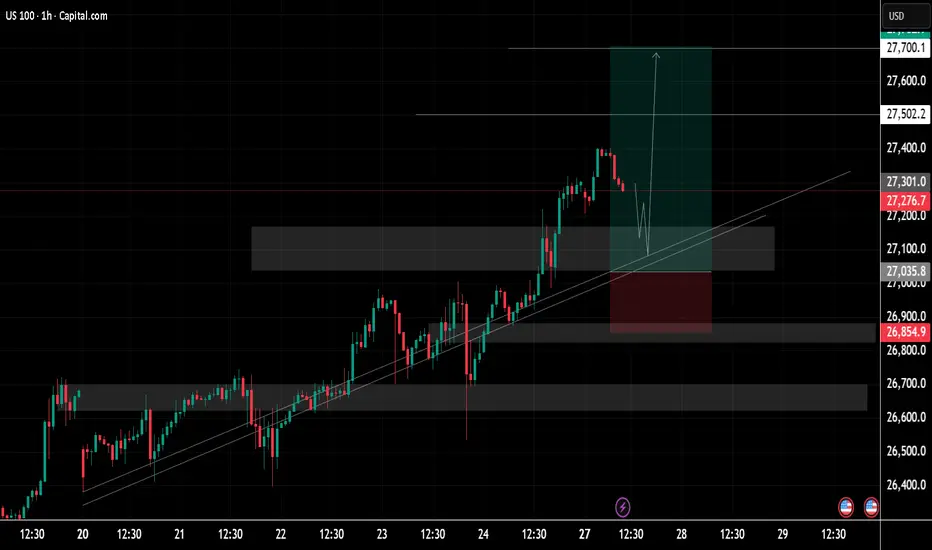
US100 Price Update – Clean & Clear ExplanationUS 100 a strong upward trend, where the price has been consistently respecting an ascending trendline. This suggests the market is bullish and likely to continue moving higher if the support levels remain intact.
In terms of risk management, the stop-loss is set at 26,854, a critical support level. This level is essential for determining the trend's strength; if the price dips below this, the market might experience a significant reversal. The gray areas on the chart indicate possible resistance levels, and the current price action suggests that if the index can break through these levels, it will likely continue its upward momentum, aiming for the next resistance level at 27,700.
For traders, the best strategy right now would be to consider entering a long position as the price approaches the ascending trendline support. This entry should aim for a target at the upper resistance zone around 27,700, with a stop-loss positioned just below the recent low near 26,854 to manage risk. This approach takes advantage of the current bullish momentum while safeguarding against potential downside movement.
Ps; Support with like and comments for better analysis Thanks for Supporting.
Gold 30M: Bullish Recovery From Fibonacci SupportGold is rebounding from the 0.5–0.618 Fibonacci retracement zone after forming a short-term higher low, suggesting early signs of bullish recovery. Price is currently approaching a descending trendline resistance, where continuation strength will be tested.
If price holds above the 4,699–4,689 Fibonacci support, buyers may continue pushing toward the 4,739 resistance zone, with a potential extension toward the 4,768 target area. However, rejection at the trendline resistance could lead to another pullback toward the support zone before continuation.
Bias:
Short-term bullish while holding above Fibonacci support, with upside potential toward 4,739 and 4,768.
Educational purposes only — not financial advice.

XAUUSD | CSP Setup – Resistance Rejection After Gap FillGold has done exactly what it was supposed to do — filled the weekend gap and tapped straight into the resistance zone sitting around 4,730, where the very first rejection originally formed. That double touch at the same level is not a coincidence. It's the market telling us sellers are defending that area with intent.
What We're Watching:
The structure here is clean. Price rejected the resistance zone, pulled back, and is now hovering just above what we're identifying as the neckline region near 4,710. What we are looking for is one more push back up toward that resistance — a minor deviation or retest — before sellers step in again and drive price back down through the current market area. Once that neckline breaks with conviction, that's our entry signal.
The Setup:
We don't chase the resistance rejection itself. We wait for the proper market structure break — price needs to come back, form that lower high, and then crack the neckline cleanly. That's the confirmation that sellers have taken dominance and the move down has legs. Entry after the MSB keeps us on the right side of the trade with structure behind us, not hope.
Targets:
The short-term target sits just under the resistance zone on any failed retest, but the major target we're focused on is the 4,678 area — the zone marked clearly on the chart. That's where this move has room to breathe if the structure break plays out the way we expect.
If we decide to break early that neckline zone which could happen as well we will still look for that short!
Definitely one to keep an eye on as the session develops.
If this added value, boost it forward.
Swallow Academy

AUDCAD Potential Upsides! Hey Traders, in today's trading session we are monitoring AUDCAD for a buying opportunity around 0.97600 zone, AUDCAD is trading in an uptrend and currently is in a correction phase in which it is approaching the trend at 0.97600 support and resistance area.
Trade safe, Joe.

GOLD Sideways Market: Bulls vs Bears at Key LevelsGold is currently trading inside a descending channel, showing a short-term bearish structure. However, price has recently bounced from the lower boundary, creating a range-bound (sideways) environment between key support and resistance levels.
Right now, gold is not trending cleanly in one direction — instead, it is moving both up and down because the market is in a compression phase. This happens when institutions are collecting liquidity on both sides, taking out buyers above resistance and sellers below support. As a result, we see false breakouts and choppy movement, rather than a strong trend.
Another major reason behind this two-sided movement is fundamental uncertainty. Gold is highly sensitive to USD strength, interest rate expectations, and upcoming economic news. When the market is waiting for important data, price tends to stay indecisive, creating a range until a clear direction is confirmed this current structure suggests the market is preparing for a strong expansion move, but direction will only be confirmed after a breakout.
If price breaks and holds above the 4,780–4,800 resistance zone, we can expect a bullish move as buyers take control and push price higher. On the other hand, if price breaks below the 4,660 support level, it will likely continue bearish toward 4,600, following the overall channel direction.
You may find more details in the chart,
Trade wisely best of luck buddies.
Ps; Support with like and comments for better analysis Thanks for Supporting.

GBPCHF Potential Upsides!Hey Traders, in tomorrow's trading session we are monitoring GBPCHF for a buying opportunity around 1.06000 zone, GBPCHF is trading in an uptrend and currently is in a correction phase in which it is approaching the trend at 1.06000 support and resistance area.
Trade safe, Joe.
