GOLD: Waiting For The Buy Model To Set UpIn this Weekly Market Forecast, we will analyze Gold for the week of April 27 - May1st.
Gold has been going no where but sideways. But I believe that changes this week.
Not interested in shorting this market. Not with fundamentals supporting higher prices at the moment.
FOMC is Wednesday, and my weaken the USD. That would allow GOLD to surge, as it is struggling to move lower from the -FVG.
Patience will allow the market to unfold, and give me a queue to enter a valid buy model.
Enjoy!
May profits be upon you.
Leave any questions or comments in the comment section.
I appreciate any feedback from my viewers!
Like and/or subscribe if you want more accurate analysis.
Thank you so much!
Disclaimer:
I do not provide personal investment advice and I am not a qualified licensed investment advisor.
All information found here, including any ideas, opinions, views, predictions, forecasts, commentaries, suggestions, expressed or implied herein, are for informational, entertainment or educational purposes only and should not be construed as personal investment advice. While the information provided is believed to be accurate, it may include errors or inaccuracies.
I will not and cannot be held liable for any actions you take as a result of anything you read here.
Conduct your own due diligence, or consult a licensed financial advisor or broker before making any and all investment decisions. Any investments, trades, speculations, or decisions made on the basis of any information found on this channel, expressed or implied herein, are committed at your own risk, financial or otherwise.
Goldoutlook

Gold Recovers on Geopolitical Signals, Awaiting a Breakout📊 Market Developments:
Global gold prices are seeing a slight recovery (+0.16%) following reports regarding Iran's proposal, which helped ease previous sell-off pressure. Market sentiment is currently Neutral as investors await new economic data to determine a clearer trend.
📉 Technical Analysis:
- Key Resistance: 4,760 USD and 4,785 USD.
- Nearest Support: 4,700 USD and 4,647 USD.
- EMA: Price is hovering around 4,717 USD, right at the EMA 09 (4,717.9). This indicates a sideways short-term trend; a clear candle close above or below this line is needed for confirmation.
Candlestick/Volume/Momentum: RSI 14 is at 53.79, showing a balance between buying and selling. The chart indicates price accumulation in a narrow range after a correction.
📌 Outlook:
Gold may continue to recover toward 4,760 USD in the short term if the 4,700 USD psychological support holds and geopolitical reports remain positive.
💡 Trading Strategy:
🔻 SELL XAU/USD: 4,758 – 4,762
🎯 TP: 40/80/200/300 pips
❌ SL: 4,765 USD
🔺 BUY XAU/USD: 4,700 – 4,705
🎯 TP: 40/80/200/300 pips
❌ SL: 4,697 USD

Gold (XAU/USD) 4H Analysis – Key Support & Resistance Levels(XAU/USD), where price is currently trading within a key range. The zone around 5119–5238 acts as a strong resistance area, while the level near 4604 serves as solid support.
Price recently bounced from the support after a downtrend and is now moving in a consolidation phase. If the price holds above the support, a potential move to the upside can be expected. A breakout above the resistance zone may trigger further bullish momentum. On the other hand, a break below the support could bring back bearish pressure.
This setup highlights important entry and exit levels for short-term traders.
Not financial advice

Panduhh's Gold Viewpoint IntradayThese are the intraday equilibrium levels for the current structure in Gold Futures
Also on my profile is NQ futures and many stocks.
Levels are derived from internal framework using structure and geometric relationships—not time-based inputs.
Focus is not on prediction, but on order flow response at price.
Reaction at each level determines outcome:
– Acceptance → continuation within value
– Rejection → rotation away
– Failure → discovery beyond the range

Gold May Extend Losses If It Breaks Below 4,690📊 Market Overview:
Gold is currently trading around 4,700 USD/oz after a slight decline, driven by renewed inflation concerns and expectations that the Federal Reserve may keep interest rates higher for longer. Gold fell about 0.7% to near 4,705 USD on April 23 as oil prices rose and rate cut expectations were delayed.
Additionally, the market is awaiting the Fed’s upcoming monetary policy decision, causing gold to move sideways with cautious volatility.
📉 Technical Analysis:
• Key Resistance:
4,740 – 4,750
4,770 – 4,785
• Nearest Support:
4,690 – 4,680
4,660 – 4,650
• EMA:
Price is below EMA 09 (M15–H1) → short-term trend is bearish / sideways bearish.
• Candlestick / Volume / Momentum:
Multiple small candles with long upper wicks around 4,730 – 4,740
Declining volume → weakening buying pressure
Momentum fading after a technical rebound
→ Indicates accumulation before a breakout
📌 Outlook:
Gold may continue to decline if it clearly breaks below 4,690, potentially extending losses toward 4,660 – 4,650.
Conversely, if it holds above 4,690 and rebounds, price may return to 4,740 – 4,760.
💡 Trading Strategy:
🔻 SELL XAU/USD: 4,742 – 4,745
🎯 TP: 40 / 80 / 200 / 300 pips
❌ SL: 4,749
🔺 BUY XAU/USD: 4,653 – 4,650
🎯 TP: 40 / 80 / 200 / 300 pips
❌ SL: 4,646

Precious Metals: Near-Term Bearish Signal???without going into statistics and testing yet (I've already started conducting them, but I'm not in a hurry to release the data yet), I would like to draw attention to the slope of the max pain curve as in gold and silver in the near term 👉 both curves give signals for a decrease in prices for precious metals

Gold: Retest or Rebound?1️⃣ Market Overview
Gold (XAU/USD) dropped sharply to around 4,670 in the latest session before rebounding to 4,750 – 4,760.
The market is currently in a technical rebound after the sharp decline, but bullish momentum is still not clearly established.
2️⃣ Technical Analysis
Short-term trend: Bearish → technical rebound
Momentum: Weak
Structure: Retest after breakdown
Resistance:
• 4,780
• 4,800
Support:
• 4,720
• 4,700
• 4,670 (recent low)
3️⃣ Outlook
The market is experiencing a technical rebound, but the short-term bearish trend still dominates.
If price remains below 4,780, it will likely retest the 4,700 – 4,670 zone.
4️⃣ Trading Strategy
🔻 SELL XAU/USD: 4,797 – 4,800
🎯 TP: 40 / 80 / 200 / 300 pips
🛑 SL: 4,805
🔺 BUY XAU/USD 4,670 – 4,667
🎯 TP: 40 / 80 / 200 / 300 pips
🛑 SL: 4,662

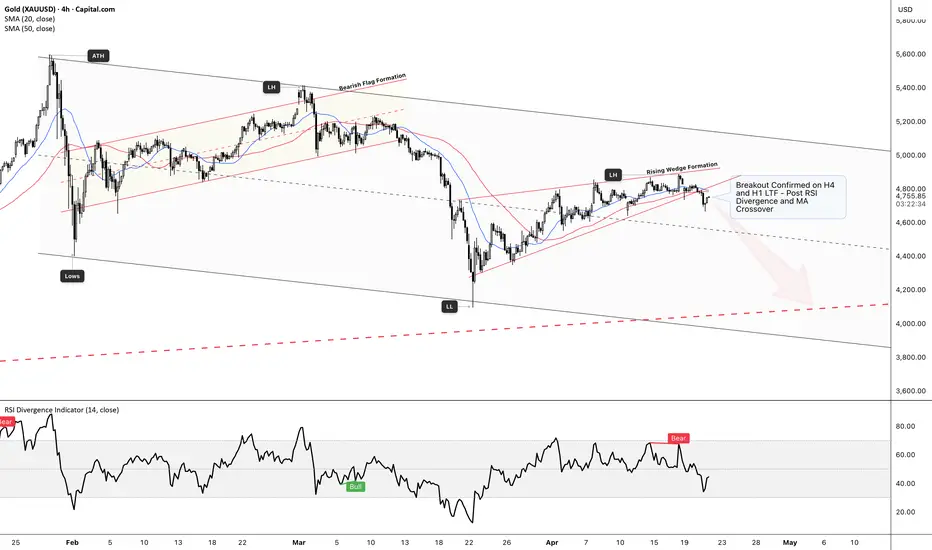
XAUUSD (Gold) – Structure Breakdown & Bearish OutlookHTF - D1 View
CAPITALCOM:GOLD is currently trading within a broader descending channel, respecting long-term bearish structure despite recent short-term bullish attempts.
On the left side of the chart, we saw a bearish flag formation form after the ATH, which led to continuation downside — setting the tone for the current macro bias.
Recently, price formed a rising wedge on H4, which is typically a weakening bullish structure. This wedge developed after a strong impulsive move from the lows (LL), but momentum started fading as price printed lower highs internally.
📝 Key confluences:
🔻RSI bearish divergence signaling weakening bullish momentum
🔻MA crossover suggesting a shift in short-term trend
🔻Rejection at wedge resistance + channel mid-zone
We’ve now seen a confirmed breakdown on H4, with LTF alignment (H1) supporting the move.
📉 Bias: Bearish
As long as price remains below the wedge and fails to reclaim that structure, the expectation is continuation towards:
◘ Channel support region & Long Term Support Confluence around $4200 - $4100 range
◘ Potential sweep of previous lows at $4100
📌 Any pullbacks into the broken wedge structure or moving averages could offer sell opportunities, not buys.
⚠️ Invalidation:
A strong reclaim and hold above the wedge resistance would weaken this bearish outlook.
Bottom line:
This isn’t a reversal market — it’s a corrective structure inside a larger downtrend. Treat rallies as setups, not signals of strength.
Gold at Resistance – Drop Incoming?Description:
On the 4H chart of Gold against US Dollar, price is currently trading near a strong resistance zone around 4,780–4,800, aligning with a descending trendline.
After a recent bounce, momentum is slowing as price struggles to break above resistance. A rejection from this zone could lead to a move back toward the strong support area near 4,550–4,600.
If support fails, further downside could push price toward the 4,416 level, with an extended target near 4,100.
Key Levels:
Resistance: 4,780 – 4,800
Support: 4,550 – 4,600
*Target: 4,416 → 4,100
Not financial idea

XAUUSD 30M TRADE IDEA I created this XAU/USD chart analysis on the 30M Timeframe
Market Overview :
The chart shows a significant recovery after a sharp localized dip. The price action suggests that the "Weekend Gap" has been successfully filled and breached, turning the market sentiment from bearish back to bullish in the short term.
Key Technical Levels :
● New Major Support Zone (4,790 – 4,800): This is the most critical area. After the sharp sell-off, buyers stepped in aggressively here. As long as the price stays above 4,790, the structure remains bullish.
● Weekend Gap Area: Market successfully pushed through the consolidation zone created during the gap. This indicates strong buying pressure.
● Major Resistance (4,880 – 4,890): This is the previous local high. Expect the price to face some selling pressure or consolidation once it reaches this level again.
Trading Plan & Strategy :
1. The Bullish Path (Primary Scenario)
Entry: Look for Buy opportunities near the 4,790 - 4,800 support zone.
2. The Bearish Path (Alternative Scenario)
If the price fails to hold the 4,790 level and closes below it on a 30m/1h candle, the bullish thesis is invalidated. In that case, we could see a Correction Continuation toward lower liquidity zones.

Gold Sideways – Waiting for a Breakout in the U.S. Session📊 Market Overview:
Gold prices (XAU/USD) are currently fluctuating around 4,795 – 4,800 USD/oz after a slight decline at the beginning of the week due to the recovery of the USD and rising bond yields. However, buying interest remains at lower support levels as the market awaits further signals from the U.S. Federal Reserve’s interest rate policy and geopolitical developments.
At the moment, the market is in a sideways accumulation phase before determining a clearer direction in the U.S. session.
📉 Technical Analysis:
• Key Resistance:
4,812
4,825
• Nearest Support:
4,785
4,772
• EMA:
Price is fluctuating around EMA 09 → short-term trend remains sideways with no clear direction yet.
• Candlestick / Volume / Momentum:
Small candles appearing consecutively → sign of market accumulation
Volume slightly decreasing after the previous drop → selling pressure weakening
Momentum is neutral → breakout likely when U.S. session liquidity increases or major news appears
📌 Outlook:
Gold could rebound in the short term if it holds above 4,785 and breaks decisively above 4,812.
Conversely, if 4,772 is broken, the price may extend its correction to lower levels.
💡 Trading Strategy:
🔻 SELL XAU/USD: 4,825 – 4,830
🎯 TP: 40 / 80 / 200 / 300 pips
❌ SL: 4,835
🔺 BUY XAU/USD: 4,785 – 4,780
🎯 TP: 40 / 80 / 200 / 300 pips
❌ SL: 4,775

Gold Faces Short-Term Selling Pressure📊 Market Overview:
Gold is currently trading around 4,790 USD/oz, slightly down at the start of the week as a stronger USD and rising bond yields reduce gold’s appeal. Renewed U.S.–Iran geopolitical tensions are also adding volatility to the market but have not yet been strong enough to push gold prices higher.
At the moment, the market is in a correction phase after the previous strong rally, with short-term selling pressure dominating.
📉 Technical Analysis:
• Key Resistance:
4,820 – 4,830
4,850 – 4,860
• Nearest Support:
4,760 – 4,750
4,720 – 4,700
• EMA: Price is currently below the EMA 09 on M15–H1, indicating a short-term bearish / corrective bias.
• Candlestick / Volume / Momentum:
Consecutive bearish candles appeared after rejection at 4,830.
Volume is gradually declining → the market is consolidating.
Weak momentum → a breakout could occur during the U.S. session.
📌 Outlook:
Gold may continue to decline in the short term if it breaks 4,760, with the next target around 4,720 – 4,700.
On the other hand, if price holds above 4,750 and climbs back above 4,820, the bullish trend could be reactivated.
💡 Suggested Trading Strategy:
🔻 SELL XAU/USD: 4,820 – 4,825
🎯 TP: 40 / 80 / 200 / 300 pips
❌ SL: 4,829
🔺 BUY XAU/USD: 4,755 – 4,750
🎯 TP: 40 / 80 / 200 / 300 pips
❌ SL: 4,746

Gold Moves Weakly Sideways – Downside Risk Dominates📊 Market Overview:
Gold is currently trading around 4,789 USD/oz, maintaining a consolidation phase as the market watches the progress of U.S.–Iran negotiations and expectations regarding the Federal Reserve's interest rate policy.
A mild recovery in the USD and stable risk sentiment have prevented gold from making a strong short-term breakout.
📉 Technical Analysis:
Important Resistance:
4,800 – 4,805
4,830 – 4,845
Nearest Support:
4,770 – 4,765
4,745 – 4,740
EMA:
Price is currently fluctuating around and slightly below the EMA 9 on M15–H1, indicating a weak sideways / consolidation trend in the short term.
Candlestick / Volume / Momentum:
Recent candles show many doji and small-body candles, suggesting the market is waiting for new information.
Volume has gradually declined after the rebound, indicating buying pressure is not strong enough for a breakout.
Momentum remains neutral, meaning the market may continue to move sideways before a clear breakout occurs.
📌 Outlook:
Gold may continue moving sideways in the short term. A decisive break above 4,805 could shift the trend upward, while a break below 4,765 may extend the downside.
💡 Suggested Trading Strategy
🔻 SELL XAU/USD: 4,800 – 4,805
🎯 TP: 40 / 80 / 200 pips
❌ SL: 4,808
🔺 BUY XAU/USD: 4,765 – 4,770
🎯 TP: 40 / 80 / 200 pips
❌ SL: 4,762

Gold Consolidates Around 4,820 – Waiting for a Clear Breakout📊 Market Overview
Gold prices are currently trading around 4,820 USD/oz, maintaining a sideways consolidation after the previous rally. The intraday range remains relatively narrow, indicating that the market is cautious and waiting for new catalysts from U.S. economic data and interest rate policy expectations.
📈 Technical Analysis
• Near resistance: 4,835 – 4,850
• Near support: 4,800 – 4,790
• Price is still holding above the key support at 4,800, suggesting buying pressure remains.
• The short-term structure remains a consolidation within an uptrend, though momentum is slowing.
🔎 Outlook
➡️ The short-term uptrend remains intact if price holds above 4,800. However, the market needs a clear breakout above 4,835–4,850 to confirm the next bullish wave.
📌 Trading Strategy
BUY XAU/USD : 4,793 – 4,790
🎯 TP: 40 / 80 / 200 / 300 pips
🛑 SL: 4,784

Gold Sideways in U.S. Session – Awaiting Breakout🧭 Market Overview
Gold is currently trading around 4,810 USD/oz during the U.S. session on April 15, 2026. Earlier, the price briefly climbed to the 4,830–4,840 zone but failed to maintain the upward momentum. The market is now entering a consolidation phase with narrow fluctuations, reflecting cautious sentiment among investors as they wait for new catalysts from the U.S. session.
🔎 Technical Analysis
• Near resistance: 4,835 – 4,850
• Near support: 4,800 – 4,790
• Short-term trend: Sideway consolidation
• Short-term EMA: Price is hovering around EMA 34 and EMA 89 (M15–M30 timeframes)
• Momentum: Neutral, with slightly declining volume → indicating a potential breakout setup
🧠 Outlook
Gold is currently consolidating within the 4,800–4,830 range. If the price holds above 4,800, there is a high probability of another upward move to retest the 4,835–4,850 zone. Conversely, if 4,790 is broken, selling pressure could increase rapidly during the remainder of the U.S. session.
🎯 Suggested Trading Strategy (Short-term – Scalping)
🔻 SELL XAU/USD: 4,835 – 4,840
🎯 TP: 40 / 80 / 200 / 300 pips
🛑 SL: 4,845
🔺 BUY XAU/USD: 4,795 – 4,800
🎯 TP: 40 / 80 / 200 / 300 pips
🛑 SL: 4,790

Gold May Experience Volatility Before a BreakoutMarket Overview
Gold is currently trading around 4,827 – 4,830 USD/oz, maintaining a sideways consolidation after the previous strong rally. Buying momentum remains, but the market is slowing down as it approaches a key resistance zone, suggesting potential volatility or liquidity sweeps before choosing a clear direction during the U.S. session.
📈 Technical Analysis
• Short-term trend: Sideways – bullish bias
• Nearest resistance: 4,840 – 4,850
• Major resistance: 4,870 – 4,880
• Nearest support: 4,800
• Major support: 4,770 – 4,760
Key technical signals:
• Price remains above short-term EMAs (EMA 34 / EMA 89) → bullish structure intact
• Volume is decreasing as price approaches 4,850 → accumulation signal ⏳
• Price structure is forming compression before a breakout
⚠️ Outlook
Gold still maintains a short-term bullish structure, but the 4,840 – 4,850 zone is the key decision level. The market is likely to continue sideways movement and volatility before a clear breakout during tonight’s U.S. session.
Proposed Trading Strategy (Short-term)
🔻 SELL XAU/USD: 4,847 – 4,850
🎯 TP: 40 / 80 / 200 / 300 pips
🛑 SL: 4,856
🔺 BUY XAU/USD: 4,800 – 4,805
🎯 TP: 40 / 80 / 200 / 300 pips
🛑 SL: 4,794

Gold Sideways – Waiting for a Breakout in the U.S. Session📊 Market Overview
Gold is currently trading around 4,725–4,735 USD/oz, maintaining a sideways consolidation phase after the pullback earlier in the European session. The range is gradually tightening as the market awaits fresh momentum from the U.S. session.
📉 Technical Analysis
• Short-term trend: Sideways
• Resistance: 4,745 – 4,750
• Support: 4,710 – 4,700
• Signal: No clear breakout yet
🔎 Outlook
Gold is consolidating around 4,720–4,740; if the price holds above 4,700, the potential for a rebound during the U.S. session remains intact.
🎯 Suggested Trading Strategy
🔻 SELL XAU/USD: 4,745 – 4,750
🎯 TP: 40 / 80 / 200 / 300 pips
🛑 SL: 4,755
🔺 BUY XAU/USD: 4,705 – 4,710
🎯 TP: 40 / 80 / 200 / 300 pips
🛑 SL: 4,698

XAUUSD Bearish Rejection from Supply Zone – Short Setup Toward This chart highlights a clear market structure shift with a bearish bias on XAUUSD after rejecting a strong supply zone.
Price formed a lower high inside the supply zone (~4,800), confirming seller dominance.
The marked selling area (4,740 – 4,760) is acting as a strong resistance where price is consolidating.
Multiple rejections within this zone indicate liquidity grab and distribution.
The structure shows a potential bearish continuation pattern.
🟢 Support & Targets
Immediate support: 4,643
Major demand zone: 4,570
If support breaks, expect strong bearish momentum toward demand
📉 Trade Idea:
Look for short entries in the selling area
Confirmation: bearish rejection / lower timeframe structure break
Targets:
TP1: 4,643 (support)
TP2: 4,570 (demand zone)
⚠️ Risk
Invalidate idea if price breaks and holds above supply (4,800)
Always wait for confirmation before entry

Gold consolidates around 4,760 — potential upside if 4,800 break1️⃣ Market Overview
Gold (XAU/USD) is currently trading around 4,758 – 4,766 after pulling back from the 4,800 area. The market is in a consolidation phase, with buying pressure still appearing when price dips toward support.
2️⃣ Technical Analysis
Short-term trend: Sideway — slightly bullish
• Resistance: 4,780 — 4,800 — 4,835
• Support: 4,745 — 4,720 — 4,700
Current signals show the price consolidating within a narrow range with no strong reversal signs.
3️⃣ Quick Outlook
If price holds above 4,745, gold may continue consolidating and could push higher once 4,800 is clearly broken.
4️⃣ Suggested Trading Strategy
🔺 BUY XAU/USD: 4,742 – 4,745
🎯 TP: 40 / 80 / 200 pips
🛑 SL: 4,738
🔻 SELL XAU/USD: 4,797 – 4,800
🎯 TP: 40 / 80 / 200 pips
🛑 SL: 4,806

Gold rises, watch for a pullback near 4,820📊 Market Overview:
Global gold prices on April 8, 2026 continue their strong upward momentum after rebounding from the 4,630 area, currently trading around 4,800 USD/oz. The rally is mainly driven by a weaker USD and increased safe-haven demand. However, as price approaches the short-term peak zone, profit-taking pressure is starting to appear, causing strong intraday volatility.
📉 Technical Analysis:
• Key Resistance:
• 4,820 – 4,830
• 4,850 – 4,870
• Nearest Support:
• 4,770 – 4,760
• 4,730 – 4,710
• EMA: Price remains above EMA 09 → short-term trend is still bullish, but the range is expanding and consolidation may be needed.
• Candlestick / Volume / Momentum:
• Long upper wicks appear around 4,820 → sign of short-term profit taking
• Volume increased during the previous rally but is now gradually decreasing
• Momentum remains positive with no clear reversal signal yet
📌 Outlook:
Gold may continue rising in the short term if it holds above 4,770, but a quick pullback could occur if price breaks below 4,760.
💡 Suggested Trading Strategy:
🔻 SELL XAU/USD: 4,825 – 4,830
🎯 TP: 40 / 80 / 200 pips
❌ SL: 4,834
🔺 BUY XAU/USD: 4,763 – 4,760
🎯 TP: 40 / 80 / 200 pips
❌ SL: 4,757

Gold Consolidates Around 4660—Risk of Correction if 4620 Breaks📊 Market Overview:
• Gold is currently fluctuating around 4,640 – 4,660 USD/oz, as the market remains cautious ahead of upcoming US inflation data and ongoing geopolitical tensions in the Middle East.
• The strong USD and expectations that the Federal Reserve will keep interest rates higher for longer are limiting gold’s upside momentum.
• After touching the 4,700+ area, the price corrected and is now moving in a sideways accumulation phase.
📉 Technical Analysis:
Key Resistance:
• 4,680 – 4,700
• 4,730 – 4,750
Nearest Support:
• 4,620 – 4,600
• 4,580 – 4,550
EMA:
Price is currently trading below EMA 09 on the short-term timeframe → indicating mild bearish / weak sideways momentum.
Candlestick / Volume / Momentum:
• Multiple long upper wicks near 4,700, signaling strong profit-taking pressure.
• Declining volume suggests the market is in an accumulation phase.
• Short-term momentum is weakening after the previous strong rally.
📌 Outlook:
Gold may experience a short-term correction if the 4,620 support is broken, potentially revisiting the 4,600 – 4,580 zone.
On the other hand, if 4,620 holds, the market could continue sideways consolidation before another attempt toward 4,700.
💡 Suggested Trading Strategy:
🔻 SELL XAU/USD: 4,697 – 4,700
🎯 TP: 40 / 80 / 200 / 300 pips
❌ SL: 4,705
🔺 BUY XAU/USD: 4,603 – 4,600
🎯 TP: 40 / 80 / 200 / 300 pips
❌ SL: 4,595

Gold Consolidates Around 4,660 — Downside Risk if 4,600 Breaks📊 Market Overview:
Gold prices are currently trading around $4,620/oz, down compared to last weekend as the stronger USD and expectations of higher interest rates for longer are putting short-term pressure on the precious metal.
The market is entering a consolidation phase after the recent strong volatility, waiting for more U.S. economic data and signals from the Fed to determine the next direction.
📉 Technical Analysis:
• Key resistance: 4,660 – 4,670
• Strong resistance: 4,680 – 4,700
• Nearest support: 4,600 – 4,590
• Strong support: 4,570 – 4,550
• EMA: Price is currently trading below EMA 09 on the M15–H1 timeframe → short-term trend leaning bearish/sideways
• Candlestick / Volume / Momentum:
• Consecutive small-body candles after the drop → accumulation signal
• Declining volume → market waiting for a breakout
• Weak momentum, no strong buying pressure yet
📌 Outlook:
Gold may continue its short-term correction if the 4,600 support breaks, which could push the price back to 4,570 – 4,550.
Conversely, if gold holds above 4,600 and breaks 4,660, a recovery toward 4,700 could be confirmed.
💡 Suggested Trading Strategy:
🔻 SELL XAU/USD: 4,700 – 4,703
🎯 TP: 40 / 80 / 200 / 300 pips
❌ SL: 4,707
🔺 BUY XAU/USD: 4,590 – 4,587
🎯 TP: 40 / 80 / 200 / 300 pips
❌ SL: 4,583

Gold at a Decision Point — Break or Pullback?Gold (XAUUSD) on the daily chart is sitting right under a descending trendline, which has been acting as resistance. After that strong push up earlier this year, price slowed down and started forming a lower high, showing that buyers are losing a bit of momentum.
Even with that, price is still holding above the 200-day moving average, so the bigger picture hasn’t fully turned bearish. Right now it’s more of a pause, and this area matters.
If gold can break and hold above that trendline, it could open the door for another move up toward the highs. But if it gets rejected again, we could see it drift back down toward the 200-day and test that support.
This is one of those spots where you don’t want to rush it — let the market show its hand first.
