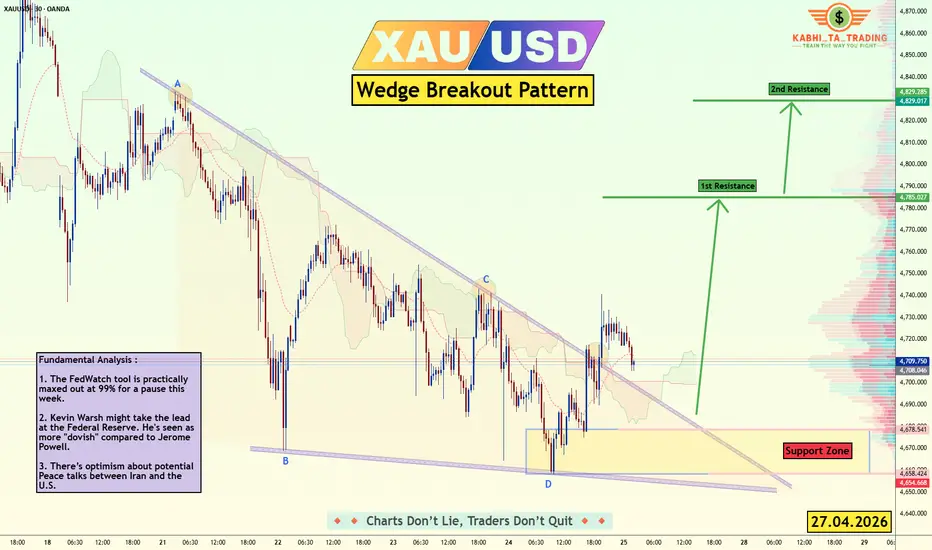
BUY XAU/USD - Wedge Breakout (27.04.2026) XAU/USD is showing a potential wedge breakout pattern after price reacted strongly from the marked support zone. Gold has broken above the descending wedge trendline, suggesting that bullish momentum may be building for a move toward higher resistance levels. OANDA:XAUUSD
Support Zone:
The key support zone is around 4,658 – 4,678. This area acted as the main demand zone where buyers stepped in.
1st Resistance:
The first upside target is around 4,785.
2nd Resistance:
If bullish momentum continues, the next resistance level is around 4,829.
Fundamental Analysis :
1. The FedWatch tool is practically maxed out at 99% for a pause this week.
2. Kevin Warsh might take the lead at the Federal Reserve. He's seen as more "dovish" compared to Jerome Powell.
3. There’s optimism about potential Peace talks between Iran and the U.S.
Disclaimer ⚠️
This analysis is for educational purposes only and is not financial advice. Always use proper risk management, wait for confirmation, and trade according to your own strategy.
#XAUUSD #Gold #GoldTrading #ForexTrading #ForexAnalysis #WedgeBreakout #BuySetup #PriceAction #TechnicalAnalysis #TradingView #KABHITATrading
Support the idea with a like, comment, and follow for more gold trading analysis.
Gold
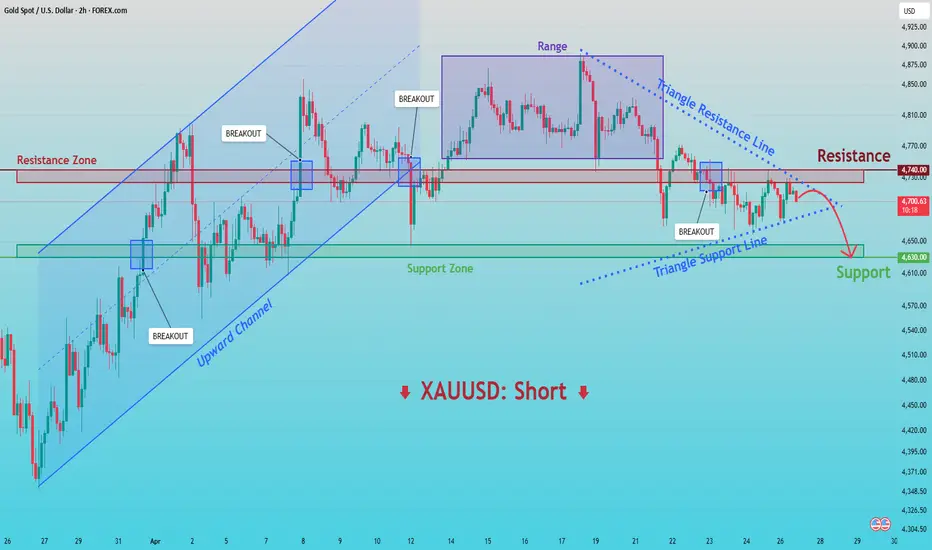
XAUUSD: Triangle Compression - Potential Drop to 4,630$ SupportHello everyone, here is my breakdown of the current XAUUSD setup.
Market Analysis
Gold previously traded within an upward channel, forming higher lows and confirming bullish momentum. After reaching zone around 4,800, price started to lose strength and entered a consolidation phase, forming a triangle structure with multiple breakouts and retests.
Currently, XAUUSD is trading below the 4,740 resistance zone while holding above the 4,630 support zone. A recent rejection from resistance and continued compression inside the triangle suggest building bearish pressure.
My Scenario & Strategy
As long as XAUUSD remains below the 4,740 resistance and respects the triangle structure, the bearish scenario remains valid. A rejection from this area could push price toward the 4,630 support (TP1).
However, if price breaks above 4,740 and holds, the bearish scenario would be invalidated, opening the path for further upside.
That’s the setup I’m tracking. Thank you for your attention, and always manage your risk.
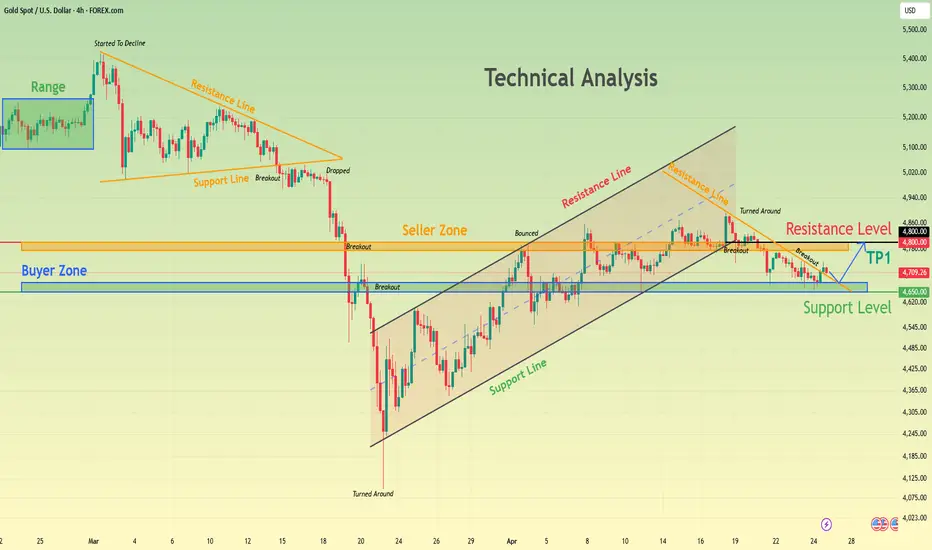
Gold Breaks Triangle Structure - Possible Rebound Toward 4,800$Hello traders! Here is my technical outlook based on the current XAUUSD (4H) chart structure. Gold previously traded within a range, showing consolidation before breaking down and confirming bearish pressure. After the drop, price found a bottom and initiated a recovery, forming an ascending channel.Currently, the price is holding above the 4650 buyer zone, which acts as a strong support, approaching the 4800 resistance level (seller zone). At the same time, we are seeing a break of the triangle structure, which indicates buyer interest and bullish bias. A potential bounce from the 4650 zone could push the price to the 4800 resistance level (TP1). Please share this idea with your friends and click Boost 🚀
GOLD: Waiting For The Buy Model To Set UpIn this Weekly Market Forecast, we will analyze Gold for the week of April 27 - May1st.
Gold has been going no where but sideways. But I believe that changes this week.
Not interested in shorting this market. Not with fundamentals supporting higher prices at the moment.
FOMC is Wednesday, and my weaken the USD. That would allow GOLD to surge, as it is struggling to move lower from the -FVG.
Patience will allow the market to unfold, and give me a queue to enter a valid buy model.
Enjoy!
May profits be upon you.
Leave any questions or comments in the comment section.
I appreciate any feedback from my viewers!
Like and/or subscribe if you want more accurate analysis.
Thank you so much!
Disclaimer:
I do not provide personal investment advice and I am not a qualified licensed investment advisor.
All information found here, including any ideas, opinions, views, predictions, forecasts, commentaries, suggestions, expressed or implied herein, are for informational, entertainment or educational purposes only and should not be construed as personal investment advice. While the information provided is believed to be accurate, it may include errors or inaccuracies.
I will not and cannot be held liable for any actions you take as a result of anything you read here.
Conduct your own due diligence, or consult a licensed financial advisor or broker before making any and all investment decisions. Any investments, trades, speculations, or decisions made on the basis of any information found on this channel, expressed or implied herein, are committed at your own risk, financial or otherwise.

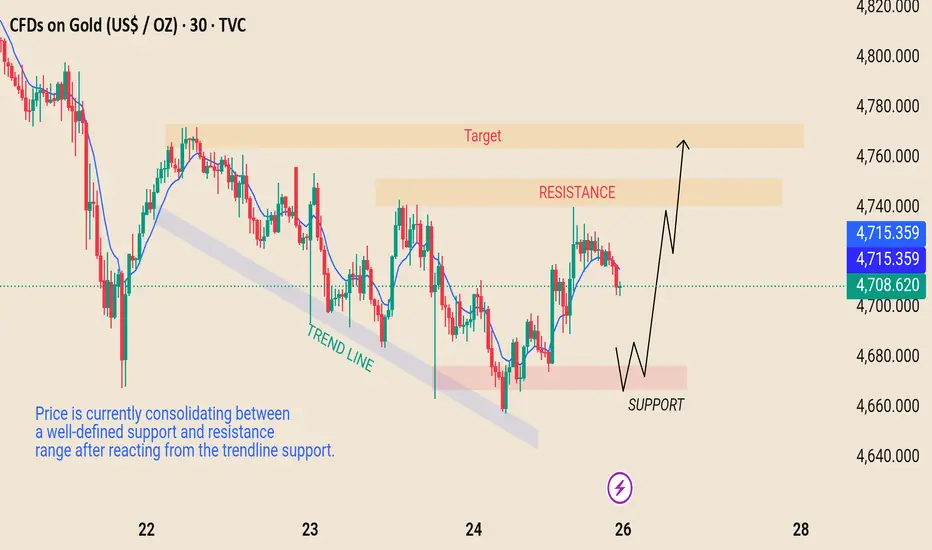
Range Structure: Support Holding, Resistance AheadPrice is currePrice is currently reacting near a short-term resistance zone after bouncing from a defined support area and trendline. Structure shows a potential range with higher lows forming, suggesting buyers are attempting to gain control.
A break and hold above resistance could open the path toward the highlighted target zone, while rejection may lead to another retest of support. Key levels remain clearly defined, so monitoring price action around these zones is important for confirmation.
This analysis is for educational purposes only and not financial advice.
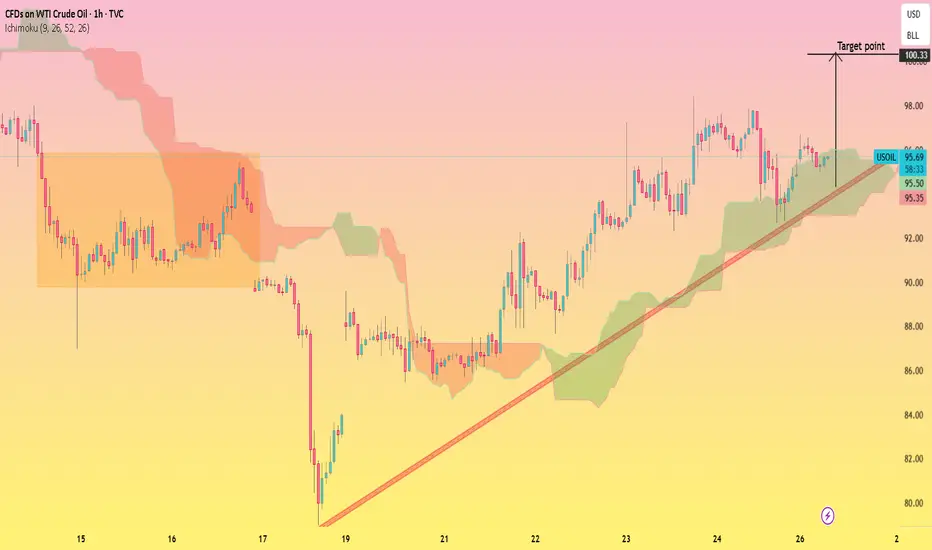
WTI Crude Oil — Bullish Continuation Toward 100.33
This 1-hour chart of WTI Crude Oil shows a strong recovery from the mid-chart bottom, followed by a steady uptrend supported by a rising trendline. Price action is holding above the Ichimoku Cloud, indicating sustained bullish momentum.
Higher lows and higher highs confirm trend continuation, with price recently bouncing from both the ascending trendline and cloud support. The structure suggests buyers remain in control as long as price respects these dynamic support zones.
**Target:**
* Upside target: **100.33**
A continuation above recent highs and trendline support increases the probability of reaching this level. A breakdown below the cloud and trendline would weaken the bullish outlook.
GOLD - Technical AnalysisICMARKETS:XAUUSD bounced off the 4668 support level toward the end of Friday’s session following a long squeeze, thereby breaking the local bearish structure. The market’s next move depends on geopolitical developments.
The dollar closed Friday in the red, and technically, the index looks poised to continue its decline. Oil is stagnant. Gold, technically, is still under pressure from bears, but Friday’s session closed above Thursday’s close, which gives us positive signals, provided that the fundamental and geopolitical backdrop supports the market. (The previous idea—a break below 4668—remains valid, provided gold returns to that level.) This coming week, all eyes are on the U.S.-Iran negotiations, as well as fundamental data: the Fed’s rate decision, the regulator’s meeting, and GDP and inflation figures.
Resistance levels: 4740, 4795
Support levels: 4668, 4644, 4600
Technically, at the moment, I expect a bounce from 4700 (4688) and a retest of the 4740 liquidity zone. A close above 4740 will open the door for continued growth toward 4800.
However, if the price fails to react at 4700 and retreats to 4668, the likelihood of a further decline will resume.
Best regards, R. Linda!

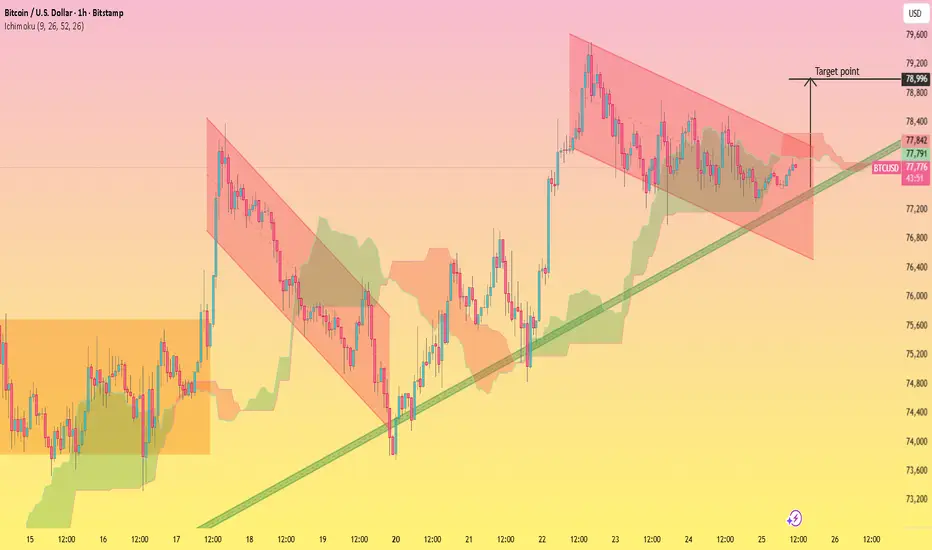
BTCUSD Descending Channel Breakout with Bullish Trendline..This 1H BTCUSD chart shows price previously respecting a **descending channel** (marked in red), indicating short-term bearish pressure. However, the structure shifted after a strong bullish impulse from the lower support area, where price bounced off a **rising trendline** (green).
Currently, price is consolidating inside a range while holding above the ascending trendline and partially supported by the Ichimoku cloud. The descending resistance is still in play, but momentum is slowly favoring buyers as higher lows are being formed.
A breakout above the descending channel resistance would confirm bullish continuation, especially if price sustains above the cloud and trendline confluence.
**🎯 Target:**
* **Primary Target:** 78,900 – 79,000 zone
* This aligns with the projected breakout move and prior resistance area.
**⚠️ Key Levels to Watch:**
* Support: 77,200 – 77,400 (trendline + cloud support)
* Resistance: 78,400 → 79,000 (channel top + target zone)
Gold Key Levels & Trend OutlookThis chart highlights key support and resistance levels for Gold, indicating potential areas for price bounce, pullback, or breakout. Key levels: 4659–4683 (strong support), 4701–4733 (minor
resistance / watch zone), 4768–4797 (key resistance / target), 4831–4880 (major resistance / top target). Traders can use this analysis for planning entries, exits, and managing risk.

XAUUSD BREAKOUT CONFIRMED — GOLD READY TO EXPLODE UP!XAU/USD is showing a clean breakout and retest from the falling trendline while holding firmly above a major demand/support zone. Price reaction from the red key zone suggests buyers are defending this level aggressively, increasing the probability of a bullish continuation. If momentum sustains above current structure, gold could push toward the next resistance zones marked above. A confirmed bounce from support often signals smart money accumulation before expansion higher. OANDA:XAUUSD
🔑 Key Levels:
Major Support Zone: 4653 – 4675
Immediate Resistance: 4810
Psychological Resistance: 4848
Bullish Invalidation: Break below 4650
📌 Trading Insight:
As long as price remains above the support zone, bias stays bullish. Rejection candles and higher lows near demand can trigger the next upward move.
👍 Support This Analysis If you found this idea useful:
👍 Like this analysis
💬 Drop your view in the comments – Bullish or Bearish?
🔔 Follow for more high-probability setups
Your support helps grow and share valuable trading insights 🚀
⚠️ Disclaimer
This content is for educational purposes only

XAU/USD | Gold at a Key Decision Level – Waiting for Direction!By analyzing the #Gold chart on the 4H timeframe, we can see that price opened the week with a bearish gap down to around $4672, but buyers quickly stepped in and pushed it back up toward $4739. However, this move lacked continuation and price is now trading around the $4692 region, sitting right at a critical support area.
From a structural perspective, the $4680 – $4700 zone is currently acting as a key demand area. As long as price manages to hold and stabilize above this level, we can expect another bullish attempt toward the nearest supply zones at $4725 – $4750, followed by $4780 – $4820 as the next major resistance cluster. In this case, short-term upside targets would be $4725, $4750, and then $4780.
On the other hand, if price fails to hold above this demand zone and we see a clean breakdown, the market could enter another bearish leg toward lower liquidity levels. In that scenario, the next downside targets would be $4665, followed by $4640, and potentially $4600 as selling pressure builds.
Overall, this is a key reaction zone where the next directional move will likely be determined. Keep in mind that the market remains highly sensitive to geopolitical developments, and any shift in tensions between Iran and the US could quickly change the direction of Gold.
Please support me with your likes and comments to motivate me to share more analysis with you and share your opinion about the possible trend of this chart with me !
Best Regards , Arman Shaban

Gold Rejection From Resistance Targets Lower LevelsGold is pulling back from a lower high and approaching the 0.5–0.618 Fibonacci support zone, where buyers may attempt to stabilize price. The overall structure shows rejection from resistance, suggesting short-term bearish pressure while price remains below the resistance band.
If price reacts positively from the 4,721–4,708 Fibonacci support zone, a corrective move back toward the 4,749 resistance may occur. However, a confirmed break below the 0.618 level could expose the downside toward the 4,669 target zone.
Bias:
Short-term bearish below resistance, with downside risk increasing if Fibonacci support fails.
Educational purposes only — not financial advice.

EURJPY - The end of the correction will lead to an uptrend FX:EURJPY remains in a bullish trend. Signs of the correction coming to an end are emerging, which generally gives the market a chance to continue its upward movement.
The currency pair has been in a bullish trend since last March. Technically, the bullish structure remains intact. The weak Japanese yen is supporting the euro’s upward movement.
Technically, the price is breaking through the resistance of the local correction and local consolidation. If the bulls keep the price above 186.8–186.87, we can expect growth to continue in the medium term.
Resistance levels: 187.92, 187.70
Support levels: 186.87, 186.43
A retest of 186.87 and price consolidation above that level will confirm the price’s readiness for growth. Zones of interest: 187.7–187.95
Best regards, R. Linda!

VIEW DAY | 49XX – 50XX: THE FINAL LIQUIDITY TRAP BEFORE THE FALLThe market enters this week under heavy macro uncertainty, with the key focus on whether the FED will initiate rate cuts or maintain a restrictive stance. At the same time, geopolitical tensions remain elevated, yet the market reaction is no longer as strong as before. This indicates that capital is not aggressively flowing into gold, and the market is currently in a waiting phase rather than committing to a clear direction.
From a price action perspective, gold is moving within a sideway structure – a corrective phase inside a broader downtrend. The behavior is very clear: slow and extended bullish moves, but sharp and decisive sell-offs. This is a classic signature of a market lacking strong institutional participation, where short-term buyers and sellers are competing without real dominance.
The upper zone around 49xx – 50xx (FVG + Fibo + Trendline confluence) acts as a major liquidity pool, where price is likely to be drawn in to sweep liquidity before continuing the primary direction. With the broader macro narrative leaning toward a gradual recession scenario, long-term capital is more likely waiting for higher prices to position for the next leg down.
Trading Scenarios:
Short-term: Price continues ranging, reacting around 0.5 – 0.618 levels
Mid-term: Look for price to retrace into 49xx – 50xx → prioritize SELL setups
Bearish confirmation: A break below current support → signals strong momentum and continuation
Conclusion:
The market has not chosen a direction yet due to the lack of a strong catalyst. However, once capital steps in, the move will be fast, aggressive, and directional.
Overall Bias: SELL – aligned with the long-term recession narrative.
LucasGrayTrading

GOLD MARKET UPDATE1H Market Update
The bearish gap at 4681 Goldturn has now been filled, acting as a support level and providing a bounce, although price did not reach the upper Goldturn. We are currently seeing another test of the 4681 level.
A confirmed break and Lock below this area could open the range to the lower Goldturn.
At the same time, we’re mindful of the 4H support at 4624, which is likely to show a reaction.
On the upside, the bullish gap at 4770 remains in focus. We’ll look to use lower Goldturn levels as potential buying the dip opportunities.
An EMA5 cross and lock will be key for confirmation, helping determine whether we should expect further downside continuation or rejection for another bounce.
We’ll keep you updated.
Mr Gold

GOLD 1H CHART ROUTE MAP UPDATE & TRADING PLAN FOR THE WEEKHey Everyone,
Please see our 1H chart levels and targets for the coming week.
We are seeing price play between two weighted levels with a gap above at 4770 and a gap below at 4681, as support. We will need to see ema5 cross and lock on either weighted level to determine the next range.
We will see levels tested side by side until one of the weighted levels break and lock to confirm direction for the next range.
We will keep the above in mind when taking buys from dips. Our updated levels and weighted levels will allow us to track the movement down and then catch bounces up.
We will continue to buy dips using our support levels taking 20 to 40 pips. As stated before each of our level structures give 20 to 40 pip bounces, which is enough for a nice entry and exit. If you back test the levels we shared every week for the past 24 months, you can see how effectively they were used to trade with or against short/mid term swings and trends.
The swing range give bigger bounces then our weighted levels that's the difference between weighted levels and swing ranges.
BULLISH TARGET
4770
EMA5 CROSS AND LOCK ABOVE 4770 WILL OPEN THE FOLLOWING BULLISH TARGETS
4860
EMA5 CROSS AND LOCK ABOVE 4860 WILL OPEN THE FOLLOWING BULLISH TARGETS
4927
BEARISH TARGETS
4681
EMA5 CROSS AND LOCK BELOW 4681 WILL OPEN THE FOLLOWING BEARISH TARGETS
4580
EMA5 CROSS AND LOCK BELOW 4580 WILL OPEN THE SWING RANGE
4504
4425
EMA5 CROSS AND LOCK BELOW 4425 WILL OPEN THE SWING RANGE
4351
4263
As always, we will keep you all updated with regular updates throughout the week and how we manage the active ideas and setups. Thank you all for your likes, comments and follows, we really appreciate it!
Mr Gold
GoldViewFX

Gold 30M: Bullish Recovery From Fibonacci SupportGold is rebounding from the 0.5–0.618 Fibonacci retracement zone after forming a short-term higher low, suggesting early signs of bullish recovery. Price is currently approaching a descending trendline resistance, where continuation strength will be tested.
If price holds above the 4,699–4,689 Fibonacci support, buyers may continue pushing toward the 4,739 resistance zone, with a potential extension toward the 4,768 target area. However, rejection at the trendline resistance could lead to another pullback toward the support zone before continuation.
Bias:
Short-term bullish while holding above Fibonacci support, with upside potential toward 4,739 and 4,768.
Educational purposes only — not financial advice.

XAU/USD | Eyeing 4600! As you can see in the 4H chart of XAUUSD, it has been in a consolidation mood for some time and has been traded inside the same range for a while. After closing at 4709, it opened today at 4696 level and then it dropped all the way to the 4672 level, reaching the April 13th NWOG Low and then bounced back up, reaching the April 22nd NDOG and then dropped again, currently being traded at 4703.
I expect XAUUSD to drop considering the Geopolitical tensions and the increasing demand for Oil. If the 4700 support level is broken down strongly, it'll drop further to sweep the Minor SSL below the 4658 level, then to below the 4644 and finally 4638. If Gold fails to bounce back up from this support level which is the April 6th NWOG Low, further drop towards the 4550 level is expected.
However, if gold stabilize above the 4700 level, we could see a rise to 4710, then 4720 and then 4750 level. Finally if it manages break above the 4750 level, it'll go towards the massive April 20th NWOG Consequent Encroachment at 4802.

XAUUSD Gold Analysis Today | Bearish ContinuationGold (XAUUSD) continues to trade within a bearish market structure, with price forming lower highs and respecting resistance zones.
Currently, price is pulling back into a key sell zone between 4725 and 4755, aligning with previous supply and dynamic resistance. This area acts as a decision zone for the next move.
🔴 Scenario 1 (Primary – High Probability)
If price shows rejection inside the sell zone, we can expect bearish continuation. In this case, gold may move lower towards the 4700 support zone, with potential extension into the 4650 major demand area.
🟡 Scenario 2 (Alternative)
Price may first move higher to sweep liquidity above 4760 before reversing. This liquidity grab could trap buyers before the market continues lower.
Overall, the structure remains bearish, and pullbacks are considered selling opportunities. Traders should wait for lower timeframe confirmation (M5/M15 rejection or structure break) before entering trades.

XAUUSD | 474x Sellers’ stronghold or the calm before a breakoutThere are times when the market moves with clarity.
And there are moments like now — gold is simply hovering, consolidating, testing traders’ patience.
After the pullback from 489x, price is compressing inside a range, and all eyes are now on 474x — the first major stronghold for sellers.
Key resistance levels:
474x — the most important resistance right now
477x — next upside test if 474x breaks
4795–4800 — major structure-defining zone
Key support levels:
467x — near-term support
464x — important lower boundary
4607–4600 — deeper support zone
My view
As long as 474x hasn’t been reclaimed decisively, I still lean toward a range-trading / scalp mindset, rather than chasing breakout moves.
Below 474x → market remains in a tug-of-war.
Break above 474x → potential move toward 477x.
Break above 4800 → then the broader narrative may shift.
For now, the market feels like it’s holding its breath ahead of bigger catalysts.
And often, after this kind of compression… comes a meaningful move.
Do you see 474x as a distribution zone for sellers, or a launchpad for a breakout?
Drop your view below — let’s discuss the next possible scenario.

GOLD DAILY CHART MARKET ANALYSISHey Everyone,
We are currently observing a range bound market structure, with price action trading between the 4587 Goldturn support and the 4900 Goldturn resistance levels.
There remains an unfilled retest zone near 4900, and as long as the 4587 support level continues to hold, the market is likely to move upward to revisit this area at somepoint.
Key confirmations to watch:
A strong candle body close above or below these levels and/or 5 EMA crossover, accompanied by a lock above or below the range boundaries.
This will help confirm the next directional move and establish a new trading range.
Additionally, the Goldturn ascending channel structure will play an important role:
The channel floor, midline, and ceiling will act as dynamic support/resistance.
These levels will help confirm the overall trend direction and market structure.
We will continue to monitor price action closely and provide updates as the market develops.
Mr Gold

GOLD WEEKLY CHART MID/LONG TERM ROUTE MAPHey Everyone,
On the weekly timeframe, price action is currently consolidating within a defined range between the 4627 Goldturn support and the 4882 Goldturn resistance levels.
The market structure reflects a broader consolidation phase, with price respecting these key boundaries. As long as the 4627 support level holds with ema5, the probability remains for a continued push toward the 4882 resistance, where price may look to test the reaction zone.
Key confirmations to monitor:
A weekly candle body close above or below these levels and/or 5 EMA cross and lock above or below to confirm direction.
This will help determine whether the market is preparing for a breakout into a new range or continuation within the current structure.
From a structural perspective, the Goldturn ascending channel remains relevant.
A confirmed move beyond either boundary, supported by channel structure, will provide clearer direction for the overallall long term trend.
We will continue to track weekly developments and update accordingly as price action evolves.
Mr Gold

GOLD 4H CHART ROUTE MAP UPDATE & TRADING PLAN FOR THE WEEKHey Everyone,
Please see our 4H chart route map and trading plan for the week ahead.
We are now seeing price play between two weighted levels with a gap above at 4754 and a gap below at 4624. We will need to see ema5 cross and lock on either weighted level to determine the next range.
We will see levels tested side by side until one of the weighted levels break and lock to confirm direction for the next range.
We will keep the above in mind when taking buys from dips. Our updated levels and weighted levels will allow us to track the movement down and then catch bounces up.
We will continue to buy dips using our support levels taking 20 to 40 pips. As stated before each of our level structures give 20 to 40 pip bounces, which is enough for a nice entry and exit. If you back test the levels we shared every week for the past 24 months, you can see how effectively they were used to trade with or against short/mid term swings and trends.
The swing range give bigger bounces then our weighted levels that's the difference between weighted levels and swing ranges.
BULLISH TARGET
4754
EMA5 CROSS AND LOCK ABOVE 4754 WILL OPEN THE FOLLOWING BULLISH TARGET
4884
EMA5 CROSS AND LOCK ABOVE 4884 WILL OPEN THE FOLLOWING BULLISH TARGET
5021
EMA5 CROSS AND LOCK ABOVE 5021 WILL OPEN THE FOLLOWING BULLISH TARGET
5134
EMA5 CROSS AND LOCK ABOVE 5134 WILL OPEN THE FOLLOWING BULLISH TARGET
5250
BEARISH TARGET
4624
EMA5 CROSS AND LOCK BELOW 4624 WILL OPEN THE SWING RANGE
4518
4373
EMA5 CROSS AND LOCK BELOW 4373 WILL OPEN THE SECONDARY SWING RANGE
4221
4074
As always, we will keep you all updated with regular updates throughout the week and how we manage the active ideas and setups. Thank you all for your likes, comments and follows, we really appreciate it!
Mr Gold
GoldViewFX
