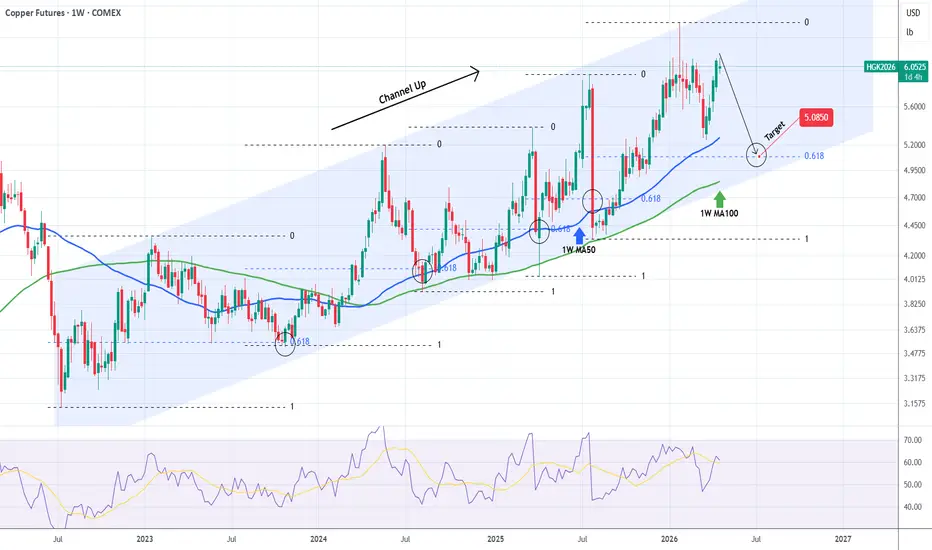
COPPER Sell Signal within a 4-year Channel Up.Copper (HG1!) has been trading within a 4-year Channel Up and the recent 1-month rebound on its 1W MA50 (blue trend-line) poses as a new sell opportunity based on the Bearish Leg occurrences of the pattern.
Having made a Higher High on January 26, the Bearish Leg hasn't yet hit its 0.618 Fibonacci retracement level, as it always had (4 times) on the previous Bearish Legs. All of them also hit the 1W MA100 (green trend-line).
As a result, we expect Copper to decline, targeting 5.0850.
---
** Please LIKE 👍, FOLLOW ✅, SHARE 🙌 and COMMENT ✍ if you enjoy this idea! Also share your ideas and charts in the comments section below! This is best way to keep it relevant, support us, keep the content here free and allow the idea to reach as many people as possible. **
---
💸💸💸💸💸💸
👇 👇 👇 👇 👇 👇
Copper Futures
No trades
In-depth trading ideas
HG Copper: War, Tariffs, and a Market at the Edge of 6.15 Geopolitics, Policy, and the Forces Moving Copper Right Now
The US-Iran conflict has shut down the Strait of Hormuz, collapsing global oil supply by 10.1 million barrels per day in March per the IEA, and the demand destruction from $150 crude is now weighing directly on copper's demand outlook.
What is less discussed but arguably more significant for copper specifically is the sulfuric acid crisis the conflict has unleashed. Goldman Sachs flagged on April 21 that the near-total halt of Gulf tanker traffic has strangled global sulfur supply, a critical input for the solvent extraction and electrowinning process that accounts for 17% of global copper production. The DRC, where 50 to 60% of copper output depends on sulfuric acid, faces curtailments of approximately 125,000 tons if disruptions extend beyond late May. China compounded the problem by banning its own sulfuric acid exports effective May 1, putting around 200,000 tons of Chilean production at risk, given Chile sourced roughly a third of its acid from China in 2025. Codelco disclosed in March that the war had already pushed its copper production costs up 5%. These are supply constraints that would be bullish under normal demand conditions, but are instead colliding with a simultaneous demand shock.
On the demand side, China's imports of unwrought copper fell 10.9% in March, yet the Yangshan copper premium climbed to $69 per ton on March 29, its highest since June 2025, a signal that spot buying appetite is quietly recovering ahead of the May Day holiday despite the headline weakness. Chinese smelters set a production record of 1.33 million tons in March, the highest in data going back to 1990, though seasonal maintenance is expected to pull output lower through May. On policy, the Trump administration revised Section 232 tariffs on copper derivative products on April 2, and the broader refined copper tariff decision remains unresolved. Goldman Sachs forecasts a 490,000-ton 2026 surplus while J.P. Morgan sees a 330,000-ton deficit; that wide disagreement between two major institutions is itself a signal of how genuinely uncertain the supply balance is. The two variables that could resolve this compression are an Iran ceasefire that reopens shipping lanes and a mid-2026 tariff announcement that ends the US stockpiling trade.
What the Market Has Done
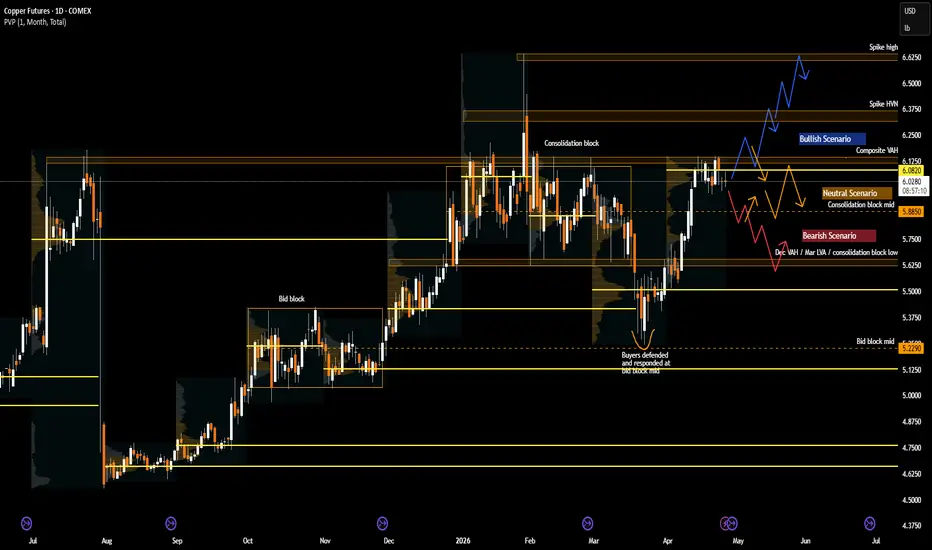
The market was in a consolidation block between 6.15, which is the composite VAH, and 5.655, which is the December VAH, establishing a well defined balance area over multiple weeks.
There was a spike high above the block at the end of January, but this move was quickly rejected back into range the following session, driven by profit taking and a lack of follow through buying as macro conditions at the time, including a firmer US dollar and cautious China demand signals, failed to support acceptance at higher prices.
In the second half of March, the market broke out of the range below 5.655 and attempted to accept lower, signaling potential continuation to the downside.
Sellers failed to gain control as buyers defended the 5.229 level, which aligns with the bid block mid, indicating responsive demand stepping in at lower prices.
By the first week of April, buyers were able to bid prices back into the consolidation block, reclaiming prior value and negating the downside breakout.
The market subsequently moved up aggressively through the consolidation block and tested 6.15, the composite VAH, showing strong initiative buying.
Price action is now in a tight range, compressing just below 6.15, indicating a potential buildup for a directional move depending on acceptance or rejection at this key level.
What to Expect in the Coming Weeks
The key level to watch is 6.15 (Composite VAH).
Bullish Scenario
If the market is able to break and accept above 6.15, expect a move to 6.3555, which is the spike HVN.
If there are no sellers present at that level, a continuation move toward the 6.62 area, which marks the spike high, becomes increasingly likely.
The possible macro catalyst that could trigger this move is a ceasefire extension or diplomatic breakthrough in the Iran conflict leading to a reopening of the Strait of Hormuz. A resolution would immediately ease energy price pressures, reduce demand destruction fears, and likely spark a relief rally across industrial metals. A simultaneous announcement of a delay or softening in US refined copper tariffs would amplify the move further.
Bearish Scenario
If buyers fail to break higher at 6.15, expect long liquidation and a move down to 5.885, which is the consolidation block mid, where buyers are expected to defend.
If this level fails to hold, the market could rotate through the rest of the consolidation block, targeting 5.655, which is the consolidation block low.
The possible macro scenario that could drive this outcome is an escalation of the Iran conflict, specifically a breakdown in ceasefire talks and a resumption of full Strait of Hormuz disruption. J.P. Morgan noted that copper prices have historically troughed approximately 25% below their peak during major macroeconomic shocks, and Goldman Sachs flagged that Brent oil sustained at $110 per barrel or higher would strip more than one percentage point from copper demand growth. A combination of continued energy shock and a faster-than-expected tariff implementation that signals the end of US stockpiling could also produce this outcome.
Neutral Scenario
In the case of a false break above 6.15 followed by responsive sellers, combined with responsive buyers stepping in at 5.885, expect two way rotation between these levels.
This would likely result in continued balance as the market works to repair and fill in the April low volume area.
The current macro environment is actually well-suited to this outcome, as the ongoing ceasefire ambiguity in the Iran conflict keeps both upside catalysts (resolution) and downside risks (escalation) in play simultaneously, making it difficult for the market to commit to a trend.
Conclusion
HG copper is compressing against the Composite VAH at 6.15 with initiative buyers clearly in control of the narrative coming off the 5.229 bid block mid, yet the macro backdrop remains too unsettled to hand either side a clean edge. The sulfuric acid supply risk across the DRC and Chile is a genuine structural threat that most participants are still not fully pricing, while China's quiet Yangshan restocking beneath the surface contrasts with the bearish headline import figures. The Iran ceasefire status and the mid-2026 refined copper tariff decision are the two macro variables that will ultimately determine whether this compression resolves higher toward 6.3555 and 6.62, grinds lower through 5.885 and back toward 5.655, or simply churns between these poles repairing the April LVA. Price acceptance or rejection at 6.15 in the sessions ahead will be the clearest real-time read available. Are you fading this level or trading the breakout?
Disclaimer: This is not financial advice. Analysis is for educational purposes only; trade your own plan and manage risk.
Acronyms:
C - Composite
w - Weekly
m - Monthly
VA - Value Area
VAH - Value Area High
VAL - Value Area Low
VPOC - Volume Point of Control
LVN - Low Value Node
LVA - Low Value Area
HVN - High Value Node
HVA - High Value Area
SP - Single print
ATH - All time high
Copper broke through its historic peak of 6.00, establishing a s1. Headline & Executive Summary
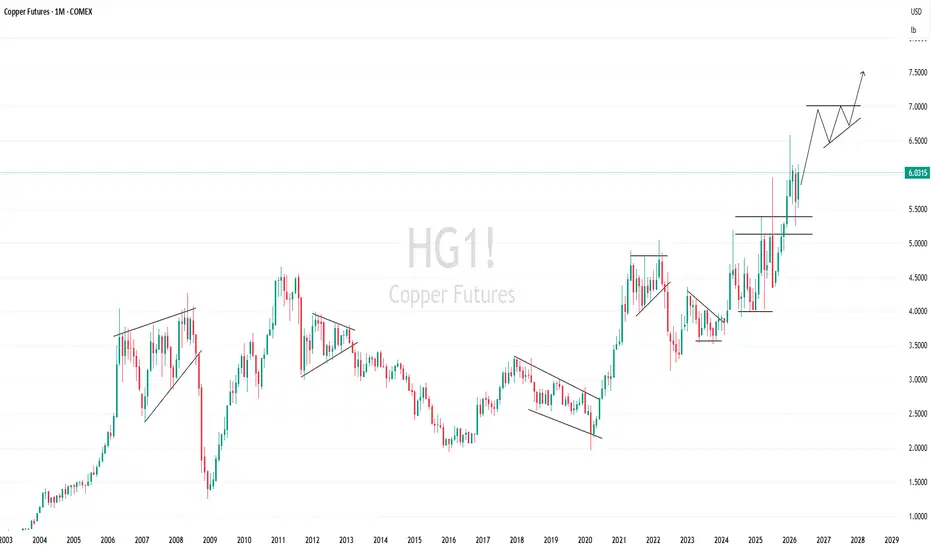
Copper breaks through historical peak of 6.00, establishing a super bullish cycle towards 7.50.
The market officially entered the accelerated Markup phase on the Monthly frame after decisively conquering the long-term psychological resistance area. The steep growth trend is backed by explosive institutional cash flows; trading tendency to prioritize holding Buy (Long) positions and only increase the proportion at regressions to support 5.50.
2. Review previous session recommendations
Since this is the first long-term strategy analysis report on the Monthly framework for Copper, we focus on the historical structural breakout (BOS) confirmation. The price surpassing the 5.50 mark with record liquidity triggered the "Super Cycle" scenario, turning all previous Short positions into extremely high risks. Currently, the market shows no signs of reversal, Buy positions from the 4.50 - 5.00 base are achieving optimal profits and should be held tightly.
3. Overview of trends & price structure
Dong is operating in the strongest price push (Markup) phase in history on the Monthly chart. The chart's logic shows that the price completed a cycle of accumulation and correction lasting more than a decade (from 2011 to 2024) before breaking out of the large accumulation triangle pattern. The current market structure records absolute consensus across time frames, where each new high is set with increasing momentum. Breaking the resistance axis at 5.50 has opened up a free growth space (Blue Sky), shifting the state from accumulation to the exponential price push phase, heading directly towards the Fibonacci expansion targets at the 7.50 zone without encountering any significant technical barriers from the past.
4. Technical prices
Resistance: 6.50 – 7.00 – 7.50 Support: 5.50 – 5.00
5. Price Action & Volume Analysis
Price Behavior, Volume & Open Interest: The current month candle is an extremely strong Bullish Marubozu candle with the price closing close to the highest level, showing the absolute dominance of the Buyers. Data correlation: Price increased + Volume exploded (723.27K) → New cash flow into Long, uptrend confirmed and sustainable. Trading volume reached its highest level in many years right at the peak breakout point, confirming that this is the entry of large strategic cash flows (Smart Money), completely eliminating the possibility of a virtual increase or price trap.
Market sentiment & Cash flow: Hedge funds (Non-Commercial) are in a state of extreme excitement and are continuously promoting disbursement when technical bottlenecks are removed. Market sentiment shifted to expectations of a long-term supply shortage. Commercial traders are having to fiercely execute defensive buy orders (Long Hedge) to ensure input capital prices, creating a wave of forced demand that pushes prices to skyrocket.
Price Structure & Waves: Advanced peak–trough sequence confirms price is in impulse wave 3 or wave 5 of a bullish super cycle according to the arrow diagram on the chart. Price Action confirmed that the breakout has escaped the disputed area that has lasted for the past 2 years. The current price position is completely above the Monthly moving average bands, confirming that the Markup phase is dominating the game. This bullish structure is only threatened if the price turns down sharply and closes decisively below the 5.00 mark on the monthly frame.
6. Next session's trading scenario
Action: Continue to hold long-term Buy position (Long), move stop loss to 5.40.
Target: 7.50.
Stop loss: 5.40.
Basis: Continuing Markup momentum accelerating from explosive institutional cash flow.
Scenario 2 (30%): Price appears to have a technical correction (throwback) to retest support at 5.50 before continuing to increase.
Action: Wait to Buy more (Add Long) at price range 5.55.
Target: 7.00.
Stop loss: 4.90.
Base: Retest historical structural breakpoint to solidify new support base.
7. Recommendations by audience
Manufacturer/exporter (Seller): Absolutely stand aside, do not sell price insurance (Short Hedge) when the market is in historic steep rise. Patiently wait for the price to reach the target area of 7.50 and a peak distribution signal appears on the Weekly frame before considering establishing a defensive position.
Trade/import (Buyer): Aggressively lock in purchase costs (Long Hedge) right at the current price range or slight vibrations. With the ATH (All-time High) breakout structure, the risk of price increases without a stop is very high, it is necessary to protect the cost of production for the next 6-12 months.
HGTrade Idea – Liquidity Sweep + BOS Setup📊 HG Trade Idea – Liquidity Sweep + BOS Setup
Timeframe: M5 / M15
Bias: Intraday Bullish (after liquidity grab)
🧠 Market Narrative
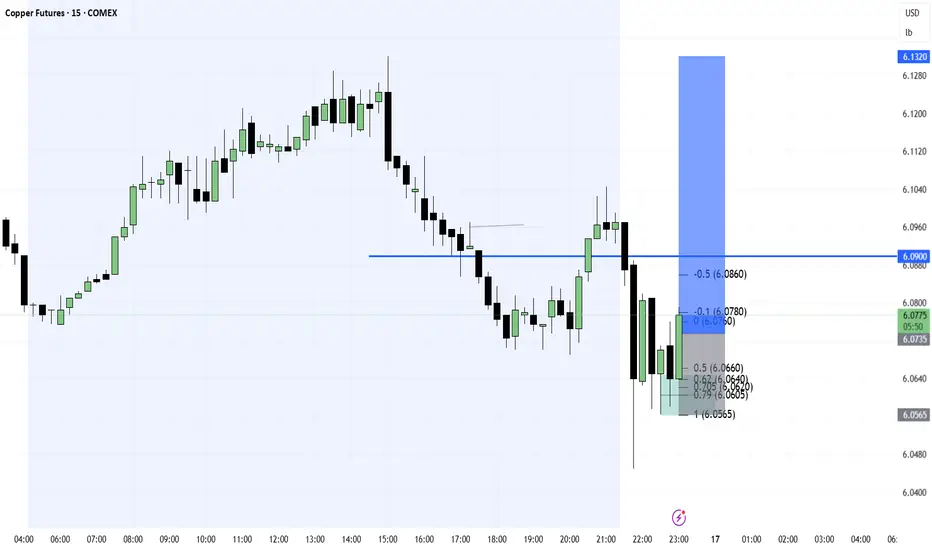
Price has shown a clear sell-side liquidity sweep followed by a Change of Character (ChoCH) and early signs of Break of Structure (BOS).
This indicates that smart money has likely finished accumulating positions below equal lows and is now shifting direction.
🔍 Key Observations
Sell-side liquidity taken below previous lows
Strong displacement candle → confirms intent
Formation of bullish structure (ChoCH → BOS)
Price reacting from discount zone (0.62 – 0.79 Fibonacci)
🎯 Trade Plan
Entry Zone:
Wait for retracement into:
Bullish Order Block / FVG
Fibonacci 0.62 – 0.79 zone
Entry Confirmation:
Lower timeframe BOS (M1/M3 sniper entry)
Rejection wicks or strong bullish candle
🎯 Targets
TP1: Internal liquidity (previous highs)
TP2: External liquidity / equal highs
TP3 (runner): Premium zone expansion
🛑 Invalidation
If price breaks below the recent higher low
Failure to hold discount zone
⚡ Execution Tip (ICT Style)
Focus on killzones (NY session) and wait for:
Liquidity sweep → Displacement → Retracement → Entry
Not before. Patience = precision.
🧾 Summary
This is a classic seek & destroy → reversal setup.
Smart money traps sellers below lows, then drives price upward.
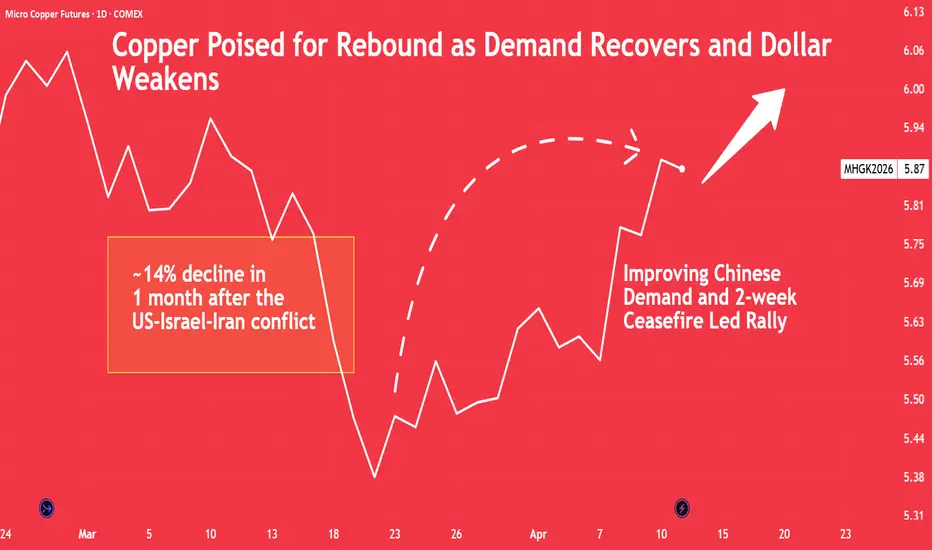
Copper Poised for Rebound as Demand Recovers and Dollar WeakensCopper’s recent drift lower runs deeper than energy-led macro headwinds. China’s pullback in demand and elevated inventories have weighed on sentiment, though early signs of stabilisation are emerging. With the Fed holding rates and the dollar at risk of softening, the setup is shifting toward a more balanced and potentially constructive phase.
Copper’s Real Stress Lies Beneath Energy Prices as China Demand Quietly Slips
Like many other commodities, copper has come under pressure in recent weeks as war-driven energy price spikes weigh on global growth expectations and industrial demand.
However, beneath this broader concern lies a more immediate shift that markets are beginning to focus on. China, the world’s dominant copper buyer, is pulling back. Net imports of refined copper fell sharply to 125.4k tons in February, marking the weakest monthly level in over a decade, pointing to a clear cooling in demand.
Source: Reuters
That pullback hasn’t come out of nowhere. Imports have been losing momentum since September, right when LME copper prices pushed past the $10,000 mark and began their run toward January highs. It is a familiar pattern: buyers stepping back when prices stretch too far. Yet this time, a deeper shift is underway. China’s expanding domestic production is quietly giving it more control over pricing dynamics, reducing its reliance on overseas supply.
At the same time, inventory trends tell their own story. Post-Lunar New Year stockpiles on the Shanghai Futures Exchange surged to around 433.5k tons in early March, far exceeding last year’s holiday peak of 268.3k tons and even surpassing the previous seasonal record of about 380k tons seen during the 2020 lockdown.
That kind of accumulation signalled weak immediate demand. The unwind, however, has already begun, as inventories eased to roughly 301k tons, suggesting consumption is gradually picking up, even if the recovery still feels measured.
There is a key nuance worth highlighting here. The build-up in COMEX inventories, driven in part by unresolved copper tariffs and the return of aluminium duties, is muddying the demand picture. What shows up as weak consumption is not entirely organic, some of it is policy-driven stockpiling. That makes it tricky to confidently call a clean reversal.
Dollar Strength Is No Longer a Given as Global Rate Pressures Build
The early signs of demand stabilisation, though encouraging, are only part of the story. For copper, how this recovery evolves will depend just as much on the macro overlay, particularly the direction of the dollar. With the Fed opting to stay on hold, currency moves are starting to carry more weight. A softer dollar would lend support to the nascent demand pickup, while any resurgence could quickly temper it.
Rates were left unchanged at 3.50-3.75% in the March meeting, with policymakers navigating a tricky mix of slowing job growth, steady unemployment, and inflation that still has not fully settled. Jerome Powell has also signalled a clear “wait-and-see” approach, with the Fed watching how energy-driven inflation and ongoing Middle East tensions evolve before considering its next move.
Markets have moved quickly to reflect that stance. Expectations of an extended pause have shot up. Traders don’t expect another rate cut until mid-2027 now.
Source: CME Quikstrike
The shift has been driven by concerns about a reacceleration in inflation. Energy inflation is expected to rise due to the conflict in the Middle East and restricted oil flows. The March CPI, which was the first one since the war began showed inflation spiking from 2.4% to 3.3% (just below expectations of 3.4%).
The increase was clearly driven by energy prices, with the category up 10.9% MoM and 12.5% YoY. Gasoline inflation was as high as 21.2% MoM. As the conflict continues, the risk of this inflation becoming embedded in other categories is high. The higher inflation makes it hard for the Fed to cut rates further.
A steady Fed does not automatically translate into a stronger dollar. While the Fed retains the flexibility to stay on hold, other central banks facing stickier inflation and lower starting rates may be forced to tighten further. That shift compresses interest rate differentials that have long favoured the dollar. As those gaps narrow, capital will begin to rotate, offering support to currencies like the euro and, by extension, creating a softer backdrop for the dollar. We have argued this previously here .
Calmer Volatility but Firmer Positioning Suggests Copper Is Entering a Transition Phase
The interplay between easing volatility and a constructive skew point to a market in transition, as reflected below.
Source: CVOL Index
Additionally, Managed Money increased its long positions by 3.2% WoW, while its short positions climbed by 14.4%. This resulted in net long positions dipping by 1.2% WoW.
Source: CME Quikstrike CoT
Even so, the tone has shifted slightly. The pace at which these participants have been cutting net longs has slowed compared to earlier stretches, hinting that while conviction is still cautious, the selling pressure is no longer as aggressive.
Historical Trade Setup
A useful parallel can be drawn from June-2025, when the Israel-Iran conflict unfolded. Unlike the sharp moves seen in energy, copper’s price action was notably restrained. Through the peak of the conflict, copper largely traded sideways.
The inflection came after the ceasefire. As tensions eased toward late June, currency markets moved first. The US dollar began to reprice lower, with the Dollar Index falling by 1.34% following the ceasefire announcement. This shift improved the affordability of copper for global buyers, setting the stage for a more constructive demand response.
Policy clarity followed. At the subsequent Fed meeting, policymakers held rates steady at 4.25-4.50%, reinforcing a sense of stability just as geopolitical uncertainty was fading. With both the dollar softening and rate expectations anchored, volatility compressed and risk appetite gradually rebuilt across commodities.
Copper’s move higher was therefore less about a sharp catalyst and more about a sequencing of events. First, the removal of geopolitical overhang. Second, increasing expectations of a softer dollar. And third, a gradual re-engagement from physical buyers owing to lower prices.
For instance, a trader who went long on the front-month Copper futures on 20/Jun/2025 and exited on 02/Jul/2025 would have realised a gross mark-to-market gain of USD 1,037.50.
In the current environment, where copper is again absorbing macro shocks, a similar setup may be forming. The focus, as before, should be more on what follows once both volatility and policy uncertainty begin to settle.
Market participants can implement similar positioning through CME Micro Copper futures, which are one-tenth the size of the standard contract. The smaller contract size allows for more granular positioning and a lower capital outlay while maintaining exposure to movements in copper prices.
Long CME Micro Copper Futures
Entry = USD 5.0195
Exit = USD 5.4345
PnL: 2,500 x (5.4345 - 5.0195) = USD 1,037.50
This content is sponsored.
MARKET DATA
CME Real-time Market Data helps identify trading setups and more effectively express market views. If you have futures in your trading portfolio, you can check out on CME Group data plans available that suit your trading needs at tradingview.com/cme .
DISCLAIMER
This case study is for educational purposes only and does not constitute investment recommendations or advice. Nor are they used to promote any specific products, or services.
Trading or investment ideas cited here are for illustration only, as an integral part of a case study to demonstrate the fundamental concepts in risk management or trading under the market scenarios being discussed.
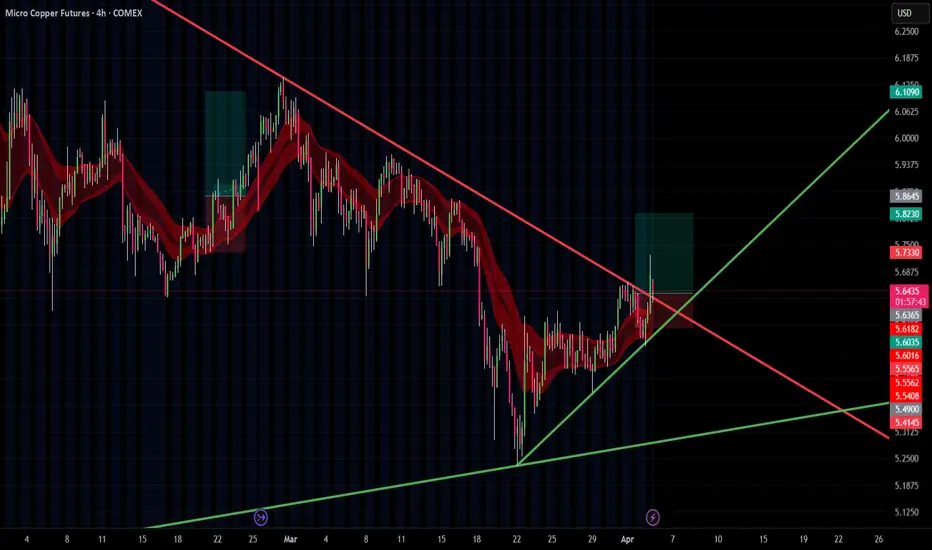
bullishbreaking major bearish 3 point touch trendline on 4hr timeframe stoploss slightly below the bullish candle which is breaking the trendline with a 1.5 rr above the same candle entry was brought down because of the continuing candle which gives me a higher rr 2.33 also the breaking candle is greater than the previous 8-10 candles wich gives me double confirmation.
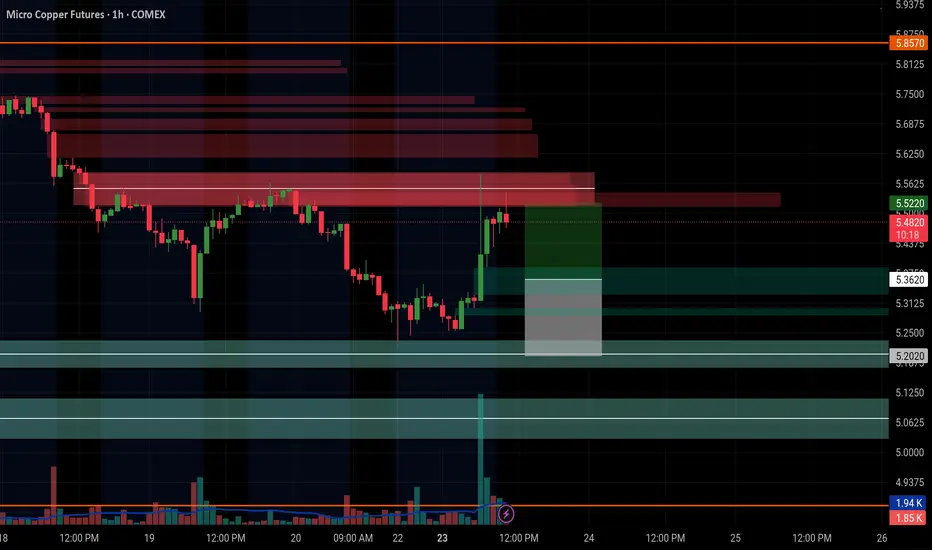
waiting for directionwaiting to see if price reaches FVG and how it reacts, believe we retest soon. if not will wait to see how one of the upper bearish FVG effect price when it reaches those areas.
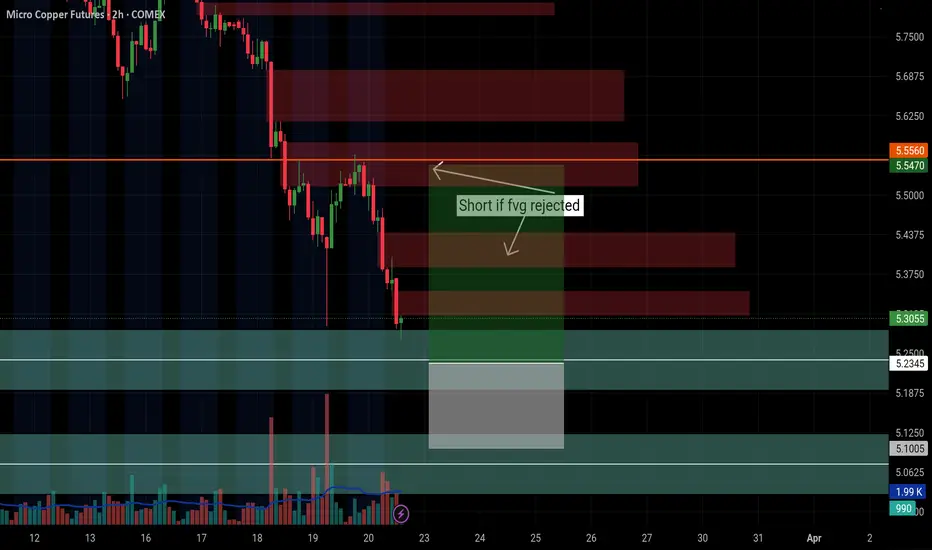
Possible Playpossible play leading into next week?
heavy bearish sentiment all last week, but price is coming into some heavy bullish FVG's.
will play it either way depending on price action.
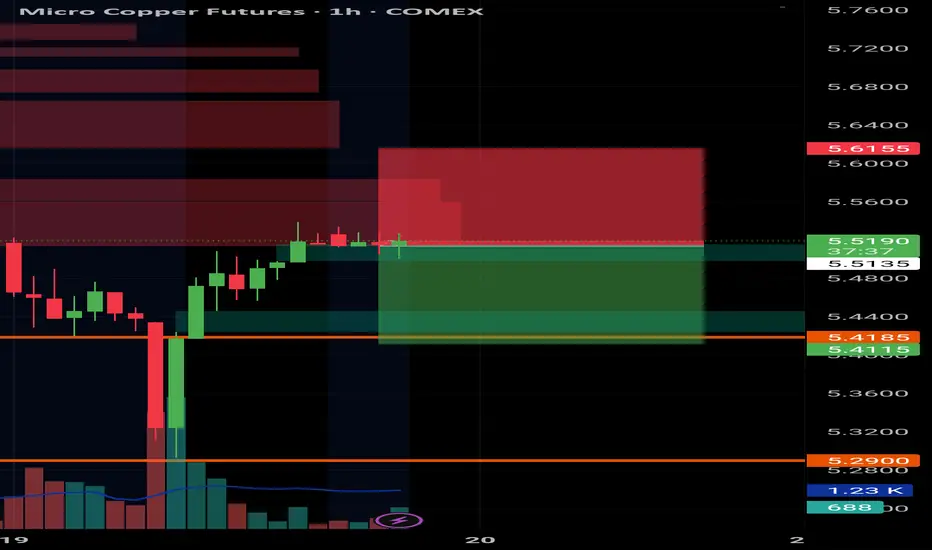
Taking my shot at a pullback.Large bearish FVG in current price range with a moderate bullish below, looking for a pullback to 5.44 before a further push up.
Fingers crossed.
Copper: Between Structural Demand and Geopolitical Tension Copper: Between Structural Demand and Geopolitical Tension from Iran
Ion Jauregui – Analyst at ActivTrades
The copper market shows a mixed scenario, where strong global demand combines with the pressure of geopolitical uncertainty. Structural demand remains solid, driven by the energy transition, electrification, electric vehicles, and construction. In the long term, growth of over 40% is projected by 2040, consolidating copper as a critical metal for the green and digital economy.
China, the world’s largest consumer, shows mixed signals. Concentrate imports show slight increases, while refined copper imports have fallen 16.1% in the first months of 2026, reflecting resistance to high prices and precautionary buying. Despite relatively high inventories in LME and Shanghai, a structural deficit in refined supply persists, generating short-term volatility.
Geopolitically, the escalation of the conflict with Iran adds pressure to the market. Although production is not directly affected, possible logistical interruptions and shortages of inputs, such as sulfuric acid, could impact supply, temporarily pressuring prices. Analysts indicate that prolonged tension could push prices back toward USD 12,000 per ton, while a de-escalation could drive levels to USD 13,500‑14,000.
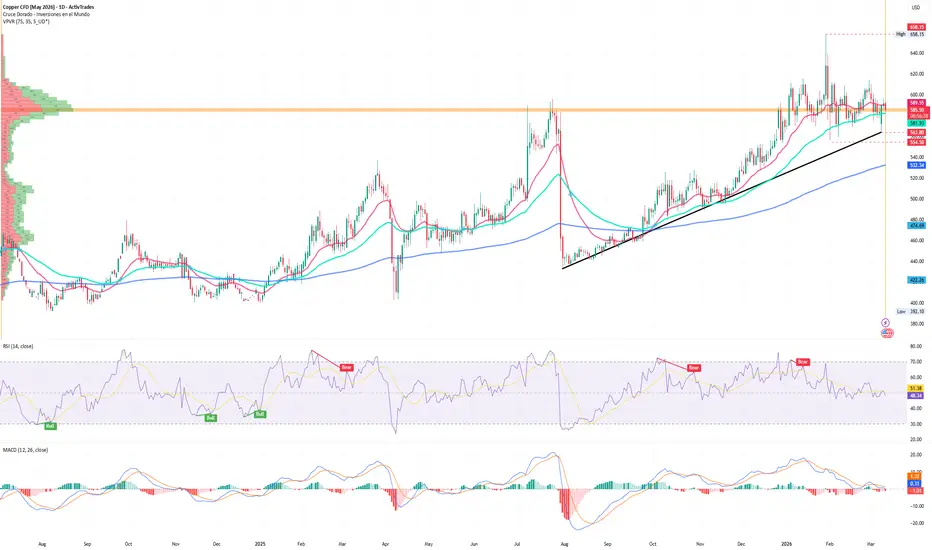
Copper Futures Analysis (Ticker AT: Copper May 2026)
Technically, copper reached a recent high of USD 658.15 on January 29 and a low of USD 554.50 on February 2, with an average of USD 588, coinciding with the point of control area. Throughout the quarter, the price has formed a consolidation range, with a low this week at USD 653.80, showing that buyers are defending key levels. The current consolidation reflects a balance between buyers and sellers, while technical supports and resistances mark the path for the coming weeks.
The 50-day moving average was surpassed this European morning, still supporting the price above the 100-day moving average. If the price holds above 581, we could see a new upward impulse toward USD 620; if this level does not hold, the support zones at 563.80 and 554.50 USD will be the next levels to test. Currently, the RSI indicator is in neutral territory, and the MACD has entered negative territory, indicating a lack of upward momentum.
In conclusion, copper maintains a structural bullish bias due to long-term demand, although geopolitical volatility and price consolidation suggest caution in the short term.
*******************************************************************************************
The information provided does not constitute investment research. The material has not been prepared in accordance with the legal requirements designed to promote the independence of investment research and such should be considered a marketing communication.
All information has been prepared by ActivTrades ("AT"). The information does not contain a record of AT's prices, or an offer of or solicitation for a transaction in any financial instrument. No representation or warranty is given as to the accuracy or completeness of this information.
Any material provided does not have regard to the specific investment objective and financial situation of any person who may receive it. Past performance and forecasting are not a synonym of a reliable indicator of future performance. AT provides an execution-only service. Consequently, any person acting on the information provided does so at their own risk. Political risk is unpredictable. Central bank actions can vary. Platform tools do not guarantee success.
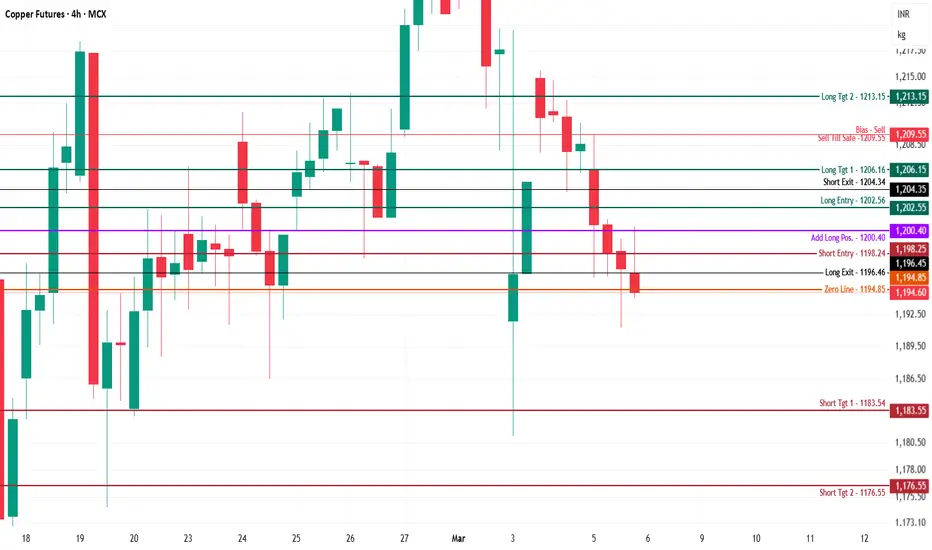
Copper MCX Future - Intraday Technical Analysis - 6 Mar., 26MCX:COPPER1!
Copper Futures — Intraday Structure Outlook (4-hr | MCX)
(If these levels support your preparation or execution, a quick boost or comment helps maintain structured updates.)
Copper is trading around 1,194.60, sitting exactly near the Zero Line – 1,194.85. Price is compressing inside equilibrium after rejection from the 1,215 zone. Expansion will come only after acceptance beyond this compression.
Bullish Structure
Longs activate above 1,202.56 sustained acceptance.
Targets:
1,206.16 – first upside objective
1,213.15 – extended expansion zone
Control:
Intraday bullish structure weakens below 1,200.40 (Add Long Pos. level)
Sustained trade below 1,196.46 (Long Exit) cancels aggressive longs
Bearish Structure
Shorts activate below 1,198.24, especially if price loses the 1,194.85 support decisively.
Targets:
1,183.54 – first downside objective
1,176.55 – extended breakdown zone
Control:
Immediate short covering required above 1,204.34 (Short Exit)
Bias shifts only if price re-accepts above 1,209.55 (Sell Till Safe level)
Neutral Zone
1,198.24 – 1,202.56 is the decision band.
Inside this range, price is rotational and liquidity-driven. Wait for acceptance, not spikes.
Structure first. Confirmation next. Execution last.
No anticipation. No emotional bias. Let price confirm intent.
COPPER LONG 4 R/R Im 4/5 on posted trade set ups so far with one trade still outstanding lets get the 5th win here with copper 4:1 R/R hype in the chat look at those higher lows and upsloping moving averages with successful backtests sniper entry

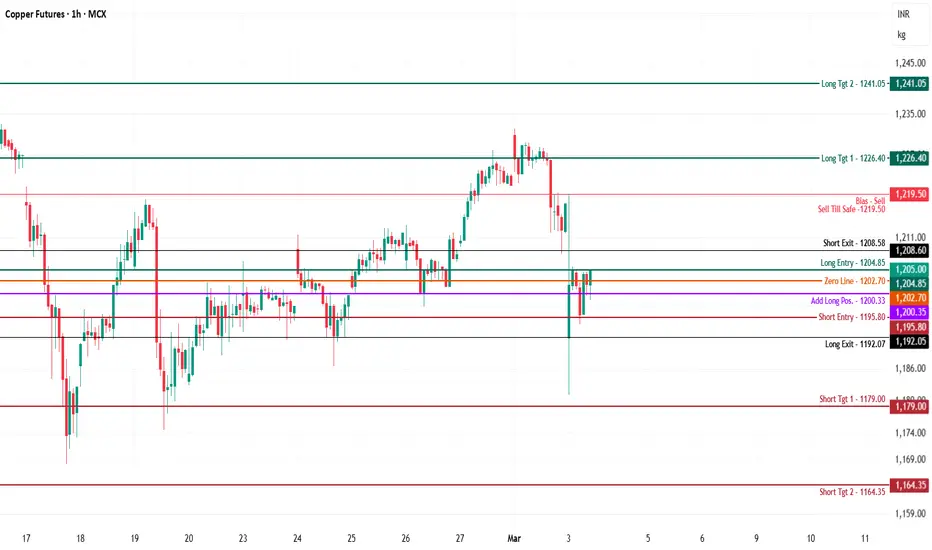
Copper MCX Future - Intraday Technical Chart Analysis - 4 Mar.MCX:COPPER1!
Copper — Intraday Structure Outlook (1-hr | MCX)
(If these levels support your preparation or execution, a quick boost or comment helps maintain structured updates.)
Copper is trading around 1,205.00, sitting exactly near the Zero Line – 1,202.70. Price is compressing inside equilibrium after rejection from the 1,230 zone. Expansion will come only after acceptance beyond this compression.
Bullish Structure
Longs activate above 1,204.85 sustained acceptance.
Targets:
1,226.40 – first upside objective
1,241.05 – extended expansion zone
Control:
Intraday bullish structure weakens below 1,200.33
Sustained trade below 1,192.07 cancels aggressive longs
Bearish Structure
Shorts activate below 1,195.80, especially if price loses 1,202.70 support decisively.
Targets:
1,179.00 – first downside objective
1,164.35 – extended breakdown zone
Control:
Immediate short covering required above 1,208.58
Bias shifts only if price re-accepts above 1,219.50
Neutral Zone
1,200.33 – 1,204.85 is the decision band.
Structure first. Confirmation next. Execution last.
No anticipation. No emotional bias. Let price confirm intent.
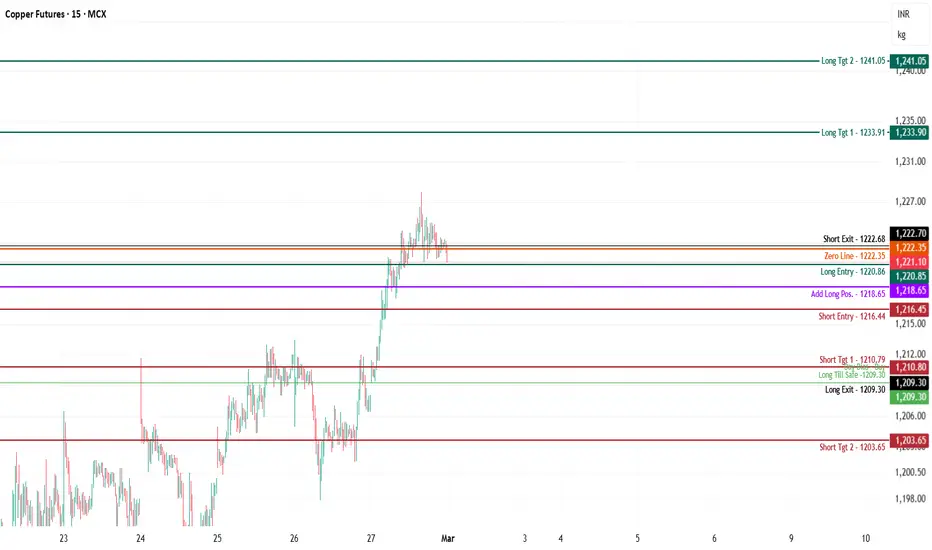
Copper MCX Future - Intraday Technical Analysis - 2 Mar., 26MCX:COPPER1!
Copper — Intraday Structure Outlook (15-min | MCX)
(If these levels help your preparation or execution, a quick boost or comment supports consistent, structured market analysis.)
Copper is trading around 1,221.10, holding just below the zero line (1,222.35) after a strong vertical expansion from 1,210 zone. Structure is bullish, but price is currently compressing near resistance. Acceptance above equilibrium is required for continuation.
Bullish Structure
Longs activate above 1,222.35, with sustained holding above the zero line.
Targets:
1,233.91 – first upside objective
1,241.05 – extended expansion target
Control:
Bullish structure weakens below 1,216.44
Sustained trade below 1,209.30 cancels aggressive longs
Bearish Structure
Shorts activate below 1,216.44, especially if price loses 1,220.86 support decisively.
Targets:
1,210.79 – first downside objective
1,203.65 – extended breakdown zone
Control:
Immediate short covers required above 1,222.70
Bias shifts only if price re-accepts above 1,222.35
Neutral Zone
1,220.86 – 1,222.35 is the active decision band.
Inside this range, price is rotational — wait for acceptance, not impulse candles.
This framework is built around structure, patience, and disciplined risk control.
No anticipation. No emotional bias. Let price confirm intent.
If this setup improves your execution clarity, boost or comment to keep structured analysis consistent.
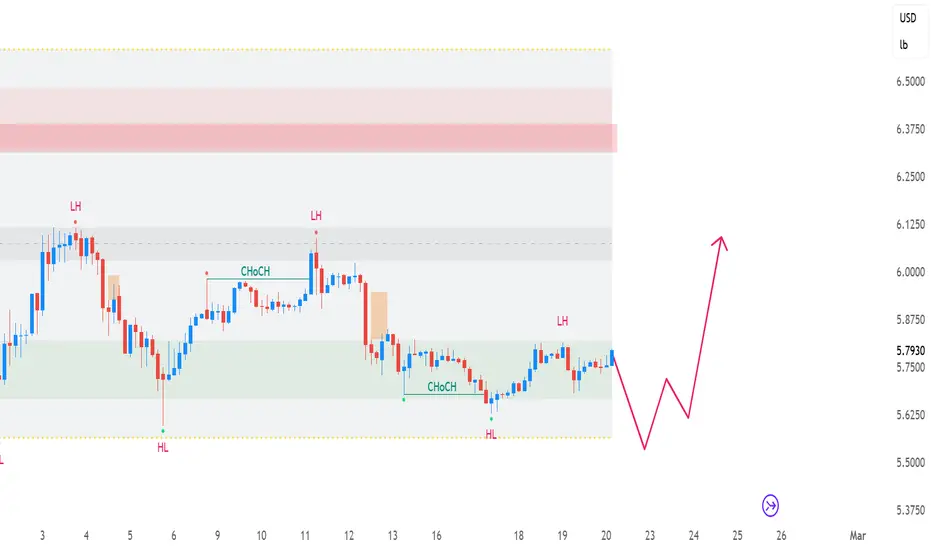
HG1! Copper: 2026 Structural Analysis1. Market Structure & Character Shifts
The chart indicates a transition from a distribution phase to an accumulation phase.
Change of Character (CHoCH): The most critical observation is the internal shift around the 13th–17th. After a series of Lower Highs (LH), the price failed to create a lower low, instead establishing a Higher Low (HL). This is a technical "break in soul" for the bears, suggesting the previous downward momentum is being absorbed by buy-side liquidity.
Compression: We are seeing a narrowing range. When price "squeezes" between established highs and lows, it typically precedes a high-velocity expansion. The current consolidation at 5.7850 represents an equilibrium point where the market is waiting for a fresh fundamental catalyst.
2. Liquidity and Order Flow
The red projection line on your chart identifies a high-probability Liquidity Sweep scenario.
The "Stop Run": Markets often move toward where the most "pain" is for retail traders. There is likely a cluster of "Sell Stops" sitting just below the 5.6250 HL.
The Thesis: The projected path suggests a brief dip into the 5.5000 area to "wash out" weak long positions and grab the necessary liquidity to fuel a move back toward the 6.1250 supply zone.
Order Flow: The green-shaded area is acting as a Mitigation Block. Price is returning to this level to "clear" old orders before the next trend leg begins.
3. Volatility and Target Mapping
The report identifies a clear imbalance between the current price and the overhead supply.
Upper Convergence: The red-shaded box (6.3750+) represents a significant "sell-off" origin point. Until the price reaches that zone, the path of least resistance—following a successful liquidity sweep—is upward.
Mean Reversion: The grey zone near 6.0000 acts as the "Fair Value" for this current range. We expect the price to gravitate back to this median before a final decision is made on whether to challenge the 6.5000 highs.
Summary of the Outlook
The chart shows a market that is exhausting its bearish trend. The presence of the HL (Higher Low) and the CHoCH suggests that the "smart money" is no longer interested in selling at these sub-5.8000 prices. The primary risk to this report is a daily candle close below 5.5000, which would invalidate the reversal thesis and signal a deeper structural breakdown.
Copper MCX Future - Intraday Technical Analysis - 25 Feb., 26MCX:COPPER1!
Copper Futures — Intraday Structure Outlook (15-min | MCX)
(If these levels help your preparation or execution, a quick boost or comment supports consistent, structured market analysis.)
Copper is trading around 1,200, stabilizing after a sharp dip and reclaiming the 1,199–1,200 equilibrium (zero line). Price has shifted back into balance, indicating a pause after volatility. Directional clarity will come only on acceptance away from this zone — avoid forcing trades inside value.
Bullish Structure
Longs activate above 1,202.05, provided price sustains above this level with higher-low confirmation.
Targets:
1,214.20 – first resistance and partial booking zone
1,224.25 – extended upside target if momentum expands
Control:
Intraday control below 1,199.08
Aggressive longs must exit on sustained trade below 1,193.65
Bearish Structure
Shorts activate below 1,196.10, especially if price fails to hold above the zero line on pullbacks.
Targets:
1,183.55 – first downside objective
1,173.95 – extended breakdown target if selling pressure accelerates
Control:
Immediate short covers required above 1,204.50
Avoid holding shorts if price re-accepts above the equilibrium band
Neutral Zone
1,199.10 – 1,202.05 is today’s decision band.
Inside this range, price is rotational — wait for acceptance, not impulse candles.
This setup is built around structure, patience, and disciplined risk control.
No anticipation, no emotional bias — let price confirm intent.
If this framework improves your intraday clarity, a boost or comment keeps disciplined analysis flowing.

New Geopolitical threats ... indicates Copper at range lows !!!The Copper is testing the lower end of its range 5.8 and trying to see some support for a bounce back. This struggle for this consolidation is seen especially at the times where Iran and US declare war anytime soon and this is likely to create panic to the existing supply chain.
With this sort of a sentiment in place there is quite a natural tendency to stay in tandem with gold and silver prices which are also gearing up for some sort of a major up move. The dollar which used to have some sort of support from 96 to 97 in the last few weeks is struggling to hold on the gains and likely to give us some gains in near term.
The daily stochastics is trending in the oversold condition and shows momentum character is still range bound market. Though you may see weakness to 5.6 or 5.4 in the near term, this could be a momentary and the bias could be an attempt back into the levels above 6. looking at the moving average support also at the 100 day SMA support which is seen at 5.5 also shows that the downside is not that great enough or mostly a short term event.
So, what will happen to the broader copper rally when there is some improvement in the LMER stocks certified stocks, is that the elevated geopolitical concerns can cause copper prices to stay supported even making a new high possible in intermediate term.

Copper HG- Potential Long SetupDespite all the talk about copper demand lately – especially from data centers and the whole AI build‑out – price has basically been stuck in a range since December. That’s not necessarily bad; it actually shows some relative strength versus the other metals, with silver still about 36% below its all‑time high and gold roughly 11% off, while copper has been holding up much better. At the same time, gold and silver charts are also starting to show potential long setups, and with all the headlines about possible US‑Iran action in the coming days, there’s a good chance investors look to hedge more with metals, which could indirectly support copper as well.
We do have important economic data coming out tomorrow, so that’s something to be careful with. The long idea in copper is pretty simple: I’m looking to buy near the bottom of the range, aiming for the top of the range, but I’ll be paying close attention to price action around the middle of the range.
On the 4H timeframe there’s a clear inverse head and shoulders forming, which, if it confirms, would add conviction to the long setup. Trigger is more a matter of personal/system preference: either wait for a small pullback and enter on a lower timeframe, or, for pattern traders, enter on the break of the neckline. Invalidation is also straightforward: either the lows of Tuesday, or for those who prefer a wider stop, the lows of last Thursday.
Let’s see if the setup actually triggers. All the best and have a good trading session.

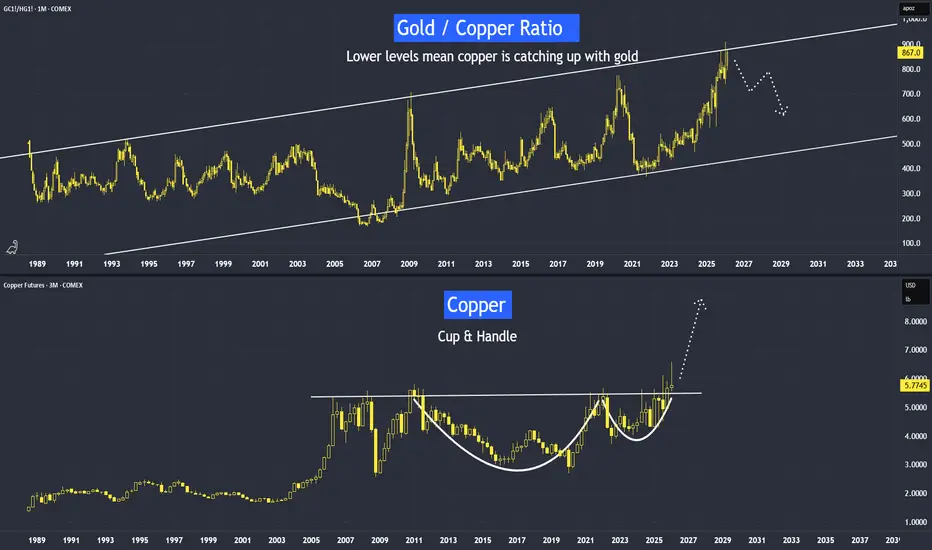
Copper is Next - After Gold & SilverLast week, we came across news: China calls for more copper stockpiling.
Therefore, is Copper Next to Rally After Silver and Gold?
Why Is China Stockpiling Copper?
In the video I posted last week, I explained that the Gold/Copper ratio may face resistance at the upper band of its long-term parallel channel. We should start monitoring it closely. If the ratio begins to react or move lower, it could indicate that copper’s rate of change on the upside may exceed that of gold.
I conducted a very similar analysis on the Gold/Silver ratio in mid-2025. Subsequently, we saw that silver’s percentage gains exceeded those of gold.
Video version:
Micro Copper
Ticker: MHG
Minimum fluctuation:
0.0005 per pound = $1.25
Disclaimer:
• What presented here is not a recommendation, please consult your licensed broker.
• Our mission is to create lateral thinking skills for every investor and trader, knowing when to take a calculated risk with market uncertainty and a bolder risk when opportunity arises.
CME Real-time Market Data help identify trading set-ups in real-time and express my market views. If you have futures in your trading portfolio, you can check out on CME Group data plans available that suit your trading needs tradingview.com/cme/
Copper – Targets for the Year: 15,760 > 16,600 – 16,800 > 14,800Good day, friends. Today we will try to analyze the current situation in the copper market for this year and identify key targets for the year. Let's start with the news that had the biggest impact:
🔴 Codelco — El Teniente: Tunnel Collapse (July 2025) A tragedy at the world's largest underground copper mine, caused by seismic activity triggered by mining operations. Current Situation:
Partial resumption — 8 underground sectors deemed safe are operational, running at ~75% capacity
Production Losses in 2025: 48,000 tonnes of copper
❌ Exact recovery date not announced. Forecast — no earlier than late 2026.
Codelco — A Chilean state-owned company and the world's largest copper producer. Operates legendary deposits: • El Teniente — the world's largest underground copper mine • Chuquicamata — one of the largest open-pit mines • Radomiro Tomic — high-grade ore Codelco faces challenges: aging assets, declining copper ore grades, and the need for large-scale investments in modernization.
🔴 Freeport-McMoRan — Grasberg: Landslide and Force Majeure (September 2025) A serious incident at one of the world's largest copper mines Force majeure declared on deliveries
Recovery Plan: • Big Gossan and Deep MLZ mines (unaffected) restarted in Q4 2025 • Main mine Grasberg Block Cave — phased restart from Q2 2026 Phase 1 - Q2 2026 - Beginning of phased restart of Grasberg Block Cave Phase 2 - H2 2026 - Reaching 85% capacity Full Recovery - 2027 - 100% capacity
Freeport-McMoRan (FCX) An American company with the world's most profitable copper mine — Grasberg in Indonesia. Key facts:
• Grasberg is also one of the largest gold deposits (gold bulls send their regards) • Largest copper producer in the USA (Morenci mine in Arizona) • Actively developing underground mining at Grasberg
🔴 DR Congo — Copper Mine Collapse (November 2025) This is not a major corporate mine, but the incident highlights the risks of mining in the region. • African Copper Belt — DR Congo and Zambia are attracting major investments
✅ Kamoa-Kakula — Smelter Launch (November 2025) This is the biggest event in the industry. Estimated Smelter Capacity - 500,000 tonnes/year (direct-to-blister) Product - Copper anodes (first melt completed) Production in 2025: 388,838 tonnes of copper in concentrate Forecast for 2026: Sales 20,000 tonnes above production (inventory realization)
p.s. There is no incentive to sell inventory now; better to wait for price growth and sell in Q2 2026 for higher margins.
Ivanhoe Mines and Zijin Mining launched their own 500,000 tonnes/year smelter directly on-site in DR Congo. This allows production of high-purity copper anodes instead of exporting concentrates, significantly increasing margins.
🟡 Escondida and Zaldivar — Strike (January 2026) The world's largest copper mine is experiencing disruptions. Protesters are blocking access roads to the mines. Blockades affect access to Escondida (BHP) and Zaldivar in the La Negra industrial sector, Chile.
📈 Factors Supporting DEMAND
China — Massive investments in renewable energy Target by 2035 - 3,600 GW of solar and wind capacity (new commitment) State Grid Investments - 89 billion USD planned for 2025 — a record level Each GW of solar capacity requires ~2,500-5,000 tonnes of copper . Grid expansion and energy storage require even more. This creates sustainable long-term demand.
USA — Tariff Policy (Section 232) November 1, 2025 - 25% tariff imposed on imports of medium and heavy trucks and parts November 14, 2025 - Framework agreement announced with Switzerland and Liechtenstein (rate reduction) November-December 2025
Impact on copper Tariff uncertainty stimulated frontloading by American importers, temporarily boosting demand.
Electric Vehicles — Continued Growth In 2025, over 18.5 million electric vehicles were sold globally, accounting for ~25% of new sales. Each EV contains 80-100 kg of copper (4 times more than ICE vehicles).
Summary November 2025 became a turning point for the copper market: The combination of factors — China's massive investments in renewable energy, US tariff policy, and multiple disruptions at the world's largest mines — created a powerful bullish impulse that supported prices above 13,000 USD/tonne. Particularly significant is that the three largest producers (El Teniente, Grasberg, Escondida) simultaneously faced problems, which is a rare coincidence that amplified the supply deficit.
Now for the technical analysis. In this forecast, we use Fibonacci extension zones for price and time, projecting onto the industry information and expected events we've gathered. The overall trend is bullish. I assume that the current uncertainty with strikes will last up to 2 months, and we will observe sideways movement for some time while buyers accumulate positions and replenish inventories for subsequent resale, amid growing demand and increasing deficit due to accidents at major facilities.
Next — growing demand (including the new Kamoa-Kakula smelter) will push the price toward 15,760 – 15,800 (which we should reach by May).
Then — relative price stabilization in the range of 15,780 – 16,600 Likely price breakout ~ 16,800
After which , amid news of the restart of Grasberg Block Cave and other damaged mines, as well as news of increased copper production in DR Congo , buyers will take profits , leading to a phased price correction .
As copper production in DR Congo continues to grow:
2025 - ~3,210 thousand tonnes | +0.3%
2026 (forecast) - ~3,404 thousand tonnes | +6%
First correction target: ~ 14,800
Second target: ~ 13 200
What do you think?
With Respect to Everyone, Your #SinnSeed

CopperHS and inverse continuation after heads slap down.
Multiple ways to play this. But fiver for copper is on cards
GL!
