There are moments in the market when everything seems to line up perfectly.
A clean chart pattern forms.
The structure is textbook.
The entry is obvious.
And yet… the outcome doesn’t follow.
Not because the idea was wrong — but because of where risk was placed.
This article explores one of the most overlooked dynamics in trading: how “perfect-looking” stop placement often becomes the very reason traders are removed from otherwise valid setups.
Using a recent futures market structure as a case study, we’ll break down:
The Setup: A Textbook Breakdown Formation
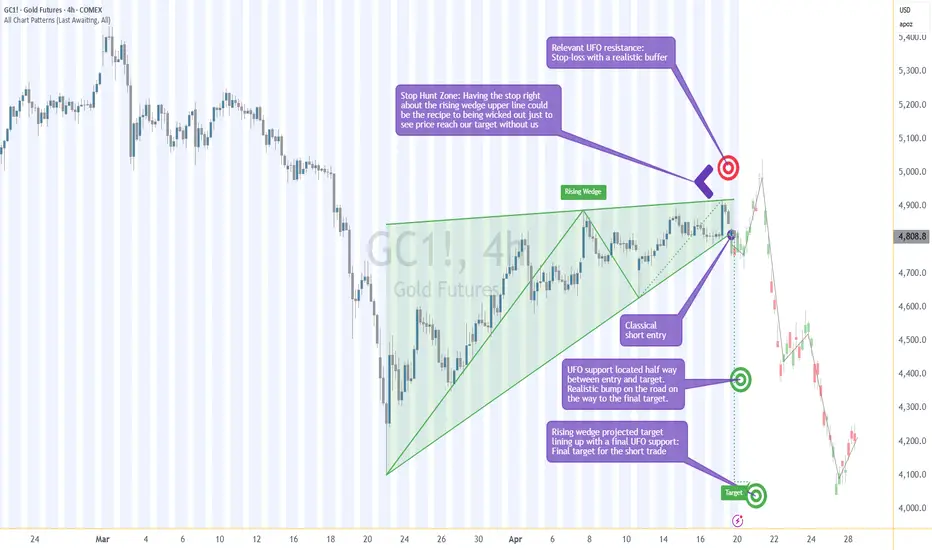
The chart structure under analysis presents a rising wedge pattern on the 4-hour timeframe, gradually compressing price into a tightening range.
This type of structure typically reflects:
Eventually, the pattern is pierced to the downside, signaling a possible shift in directional control.
From a purely technical perspective, this is a classic scenario:
But this is where most analyses stop.
And where most problems begin.
The Real Battlefield: Not Entry… But Risk Placement
Many traders focus heavily on:
But consistently overlook the most critical question:
Where is everyone else placing their stop?
Because in liquid futures markets, price does not move randomly —
it moves through liquidity.
And that liquidity often sits exactly where:
The “Perfect” Stop That Isn’t
In a typical wedge breakdown scenario, the textbook stop placement would be:
This placement looks logical:
But here’s the issue:
👉 It is also the most crowded and predictable location for stop orders.
And that creates a vulnerability.
The Stop Hunt Zone: Where Structure Meets Liquidity
Looking beyond pure structure and into order flow dynamics, a key layer emerges:
This creates what can be described as a Stop Hunt Zone:
Inside this region:
This is not random noise.
This is fuel.
What Typically Happens in This Zone
Price may:
The result?
This is the core paradox:
👉 Being directionally correct but structurally vulnerable.
A More Adaptive Approach to Stop Placement
Instead of anchoring stops to structure alone, a more nuanced approach considers:
In this case, a more conservative stop placement could be:
This does not eliminate risk —
but it acknowledges how price interacts with liquidity before moving.
The Path to Target: Not a Straight Line
While the projected downside target sits near ~4,074, the journey toward that level is unlikely to be linear.
A key intermediate consideration:
This level sits approximately halfway between:
And it introduces an important decision point.
The “Bump in the Road” Problem
Ignoring intermediate levels like this can lead to:
This zone may act as:
Possible approaches around this level include:
There is no single “correct” action —
but there is clear value in acknowledging the level exists.
Trade Structuring (Illustrative Case Study)
This section presents a hypothetical framework for understanding the setup.
Approximate reward-to-risk:
This example is illustrative only, designed to highlight:
Futures Contract Considerations
Understanding contract structure is essential when applying such setups in futures markets.
Standard Contract: Gold Futures (GC)
Micro Contract: Micro Gold Contracts (MGC)
One-Ounce Contract: 1-Ounce Gold Futures (1OZ)
These variations allow traders to:
Margin requirements will vary depending on:
Risk Management: The Real Edge
Patterns don’t create consistency.
Entries don’t create consistency.
Risk management does.
Key principles illustrated in this case:
The goal is not to avoid losses entirely —
but to avoid unnecessary losses caused by predictable positioning.
Final Perspective
This setup is not unique.
It represents a broader principle seen across markets and timeframes:
👉 Markets often move through areas of maximum discomfort before continuing in their intended direction.
And that discomfort is frequently concentrated around:
Understanding this dynamic does not guarantee outcomes.
But it may help shift the focus from:
to
Data Consideration
When charting futures, the data provided could be delayed. Traders working with the ticker symbols discussed in this idea may prefer to use CME Group real-time data plan on TradingView: tradingview.com/cme/ - This consideration is particularly important for shorter-term traders, whereas it may be less critical for those focused on longer-term trading strategies.
General Disclaimer
The trade ideas presented herein are solely for illustrative purposes forming a part of a case study intended to demonstrate key principles in risk management within the context of the specific market scenarios discussed. These ideas are not to be interpreted as investment recommendations or financial advice. They do not endorse or promote any specific trading strategies, financial products, or services. The information provided is based on data believed to be reliable; however, its accuracy or completeness cannot be guaranteed. Trading in financial markets involves risks, including the potential loss of principal. Each individual should conduct their own research and consult with professional financial advisors before making any investment decisions. The author or publisher of this content bears no responsibility for any actions taken based on the information provided or for any resultant financial or other losses.
A clean chart pattern forms.
The structure is textbook.
The entry is obvious.
And yet… the outcome doesn’t follow.
Not because the idea was wrong — but because of where risk was placed.
This article explores one of the most overlooked dynamics in trading: how “perfect-looking” stop placement often becomes the very reason traders are removed from otherwise valid setups.
Using a recent futures market structure as a case study, we’ll break down:
- Why classical stop placement can be vulnerable
- How liquidity and order flow reshape risk decisions
- Where hidden traps form within otherwise clean technical patterns
- And how a more adaptive approach may improve trade structuring
The Setup: A Textbook Breakdown Formation
The chart structure under analysis presents a rising wedge pattern on the 4-hour timeframe, gradually compressing price into a tightening range.
This type of structure typically reflects:
- Slowing bullish momentum
- Increasing imbalance risk
- Potential transition from accumulation to distribution
Eventually, the pattern is pierced to the downside, signaling a possible shift in directional control.
- Approximate breakdown zone: ~4,815
- Projected measured move target: ~4,074
From a purely technical perspective, this is a classic scenario:
- Compression → Breakdown → Expansion
But this is where most analyses stop.
And where most problems begin.
The Real Battlefield: Not Entry… But Risk Placement
Many traders focus heavily on:
- Finding the right pattern
- Timing the entry
- Projecting the target
But consistently overlook the most critical question:
Where is everyone else placing their stop?
Because in liquid futures markets, price does not move randomly —
it moves through liquidity.
And that liquidity often sits exactly where:
- Stops cluster
- Positions become vulnerable
- Forced exits can fuel price spikes
The “Perfect” Stop That Isn’t
In a typical wedge breakdown scenario, the textbook stop placement would be:
- Just above the upper boundary of the wedge
- Approximate level: ~4,922
This placement looks logical:
- It invalidates the pattern
- It respects structure
- It keeps risk tight
But here’s the issue:
👉 It is also the most crowded and predictable location for stop orders.
And that creates a vulnerability.
The Stop Hunt Zone: Where Structure Meets Liquidity
Looking beyond pure structure and into order flow dynamics, a key layer emerges:
- A sell-side liquidity zone (resistance) is located above the wedge
- This zone extends up to approximately: ~5,050
This creates what can be described as a Stop Hunt Zone:
- Lower boundary: wedge resistance (~4,922)
- Upper boundary: liquidity zone (~5,050)
Inside this region:
- Stops from short positions accumulate
- Late breakout buyers may enter
- Liquidity becomes dense
This is not random noise.
This is fuel.
What Typically Happens in This Zone
Price may:
- Push above the wedge
- Trigger clustered stops
- Induce breakout participation
- Then reverse direction
The result?
- Traders with tight stops are removed
- Positions are closed at a loss
- The original directional idea continues… without them
This is the core paradox:
👉 Being directionally correct but structurally vulnerable.
A More Adaptive Approach to Stop Placement
Instead of anchoring stops to structure alone, a more nuanced approach considers:
- Where liquidity is concentrated
- Where stops are likely clustered
- Where price may temporarily extend before continuation
In this case, a more conservative stop placement could be:
- Above the identified liquidity zone (~5,050)
- Allowing space for potential stop runs
This does not eliminate risk —
but it acknowledges how price interacts with liquidity before moving.
The Path to Target: Not a Straight Line
While the projected downside target sits near ~4,074, the journey toward that level is unlikely to be linear.
A key intermediate consideration:
- Support zone around ~4,416.8
This level sits approximately halfway between:
- Entry (~4,815)
- Final target (~4,074)
And it introduces an important decision point.
The “Bump in the Road” Problem
Ignoring intermediate levels like this can lead to:
- Unrealized gains turning into losses
- Premature reversals
- Emotional decision-making
This zone may act as:
- Temporary support
- A reaction point
- A place where opposing order flow emerges
Possible approaches around this level include:
- Partial position reduction
- Risk adjustment
- Reassessment of structure
There is no single “correct” action —
but there is clear value in acknowledging the level exists.
Trade Structuring (Illustrative Case Study)
This section presents a hypothetical framework for understanding the setup.
- Entry: ~4,815 (on confirmed breakdown)
- Stop: Above liquidity zone (~5.050)
- Target 1: ~4,416.8 (intermediate support)
- Target 2: ~4,074 (projected structure target)
Approximate reward-to-risk:
- Full target: ~ 3:1 (depending on execution)
- Partial scaling may adjust realized outcome
This example is illustrative only, designed to highlight:
- The relationship between structure and liquidity
- The impact of stop placement on trade survival
Futures Contract Considerations
Understanding contract structure is essential when applying such setups in futures markets.
Standard Contract: Gold Futures (GC)
- Tick size: 0.10 per troy ounce = $10.00
- Margin Requirement: ~$34,000 per contract
Micro Contract: Micro Gold Contracts (MGC)
- Tick size: 0.10 per troy ounce = $1.00
- Margin Requirement: ~$3,400 per contract
One-Ounce Contract: 1-Ounce Gold Futures (1OZ)
- Tick size: 0.25 per troy ounce = $0.25
- Margin Requirement: ~$340 per contract
These variations allow traders to:
- Adjust position sizing
- Manage exposure more precisely
- Align risk with account size
Margin requirements will vary depending on:
- Broker
- Volatility conditions
- Regulatory framework
Risk Management: The Real Edge
Patterns don’t create consistency.
Entries don’t create consistency.
Risk management does.
Key principles illustrated in this case:
- Stop placement should consider liquidity, not just structure
- Intermediate levels matter — even in strong directional setups
- Tight stops are not always efficient stops
- Surviving volatility is part of capturing the move
The goal is not to avoid losses entirely —
but to avoid unnecessary losses caused by predictable positioning.
Final Perspective
This setup is not unique.
It represents a broader principle seen across markets and timeframes:
👉 Markets often move through areas of maximum discomfort before continuing in their intended direction.
And that discomfort is frequently concentrated around:
- Obvious stops
- Clean technical levels
- Widely recognized structures
Understanding this dynamic does not guarantee outcomes.
But it may help shift the focus from:
- “Was the trade right?”
to
- “Was the trade structured in a way that allowed it to work?”
Data Consideration
When charting futures, the data provided could be delayed. Traders working with the ticker symbols discussed in this idea may prefer to use CME Group real-time data plan on TradingView: tradingview.com/cme/ - This consideration is particularly important for shorter-term traders, whereas it may be less critical for those focused on longer-term trading strategies.
General Disclaimer
The trade ideas presented herein are solely for illustrative purposes forming a part of a case study intended to demonstrate key principles in risk management within the context of the specific market scenarios discussed. These ideas are not to be interpreted as investment recommendations or financial advice. They do not endorse or promote any specific trading strategies, financial products, or services. The information provided is based on data believed to be reliable; however, its accuracy or completeness cannot be guaranteed. Trading in financial markets involves risks, including the potential loss of principal. Each individual should conduct their own research and consult with professional financial advisors before making any investment decisions. The author or publisher of this content bears no responsibility for any actions taken based on the information provided or for any resultant financial or other losses.
🌟 Take This Analysis Further with Our AI Scripts 🎯 | Discover How at tradewithufos.com 🚀 Choose a Subscription: Monthly ᴼᴿ Yearly ᴼᴿ Lifetime 🗓️ | Unlock Intelligent UFO Scripts Free 💡
Related publications
Disclaimer
The information and publications are not meant to be, and do not constitute, financial, investment, trading, or other types of advice or recommendations supplied or endorsed by TradingView. Read more in the Terms of Use.