Gold - Bears taking over control?Gold is currently approaching a key decision point after a strong recovery from the lows. While the short-term structure has been bullish, price is now running into higher timeframe resistance, where reactions are starting to appear. This suggests that momentum is slowing and the market could be preparing for a shift or deeper pullback.
Daily FVG Resistance
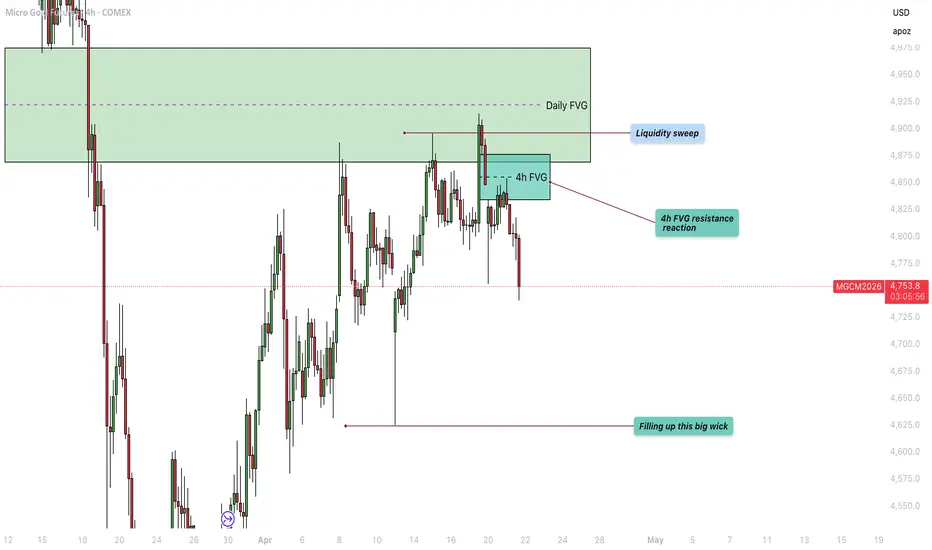
Price has moved into a significant daily FVG, which is acting as a strong resistance zone. This area represents prior imbalance where sellers previously dominated, and the current reaction confirms that supply is still present. As long as gold remains within or below this zone without a strong breakout, upside continuation remains limited and rejection becomes more likely.
Liquidity Sweep
Gold has taken liquidity above recent highs, sweeping buy-side liquidity resting above the range. This type of move often traps late buyers and provides fuel for a reversal. The sweep into the daily FVG strengthens the bearish case, as it aligns with a classic setup of liquidity grab into higher timeframe resistance.
4H Bearish Reaction
On the lower timeframe, a clear bearish reaction is visible from the 4H FVG within the larger resistance zone. Price tapped into this area and immediately showed rejection, indicating that sellers are stepping in with intent. This lower timeframe confirmation adds confluence to the idea that the current level is acting as a ceiling.
Wickfill
Below the current price, there is a large wick that remains partially unfilled. Markets often revisit these areas to rebalance inefficiencies, making it a logical downside target. A move lower to fill this wick would align with the bearish reactions seen at resistance and provide a clean path for price to retrace.
Conclusion
Gold is showing multiple signs of weakness at a key resistance zone: a liquidity sweep, rejection from the daily FVG, and bearish confirmation on the 4H. As long as price remains below this area, the probability favors a move lower, with the wick fill acting as the next likely target.
Gold Futures
No trades
In-depth trading ideas
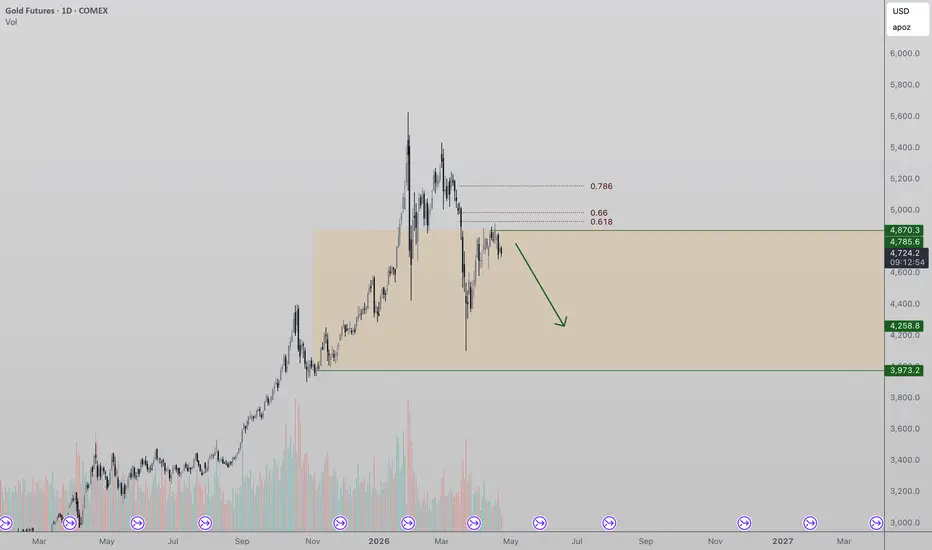
Gold Rejects Key Fibonacci Resistance, Lower High RiskGold price action is currently rejecting from a key resistance zone, aligning with the 0.618 Fibonacci retracement and a higher timeframe resistance level. This confluence area is acting as a strong barrier, preventing further upside continuation.
Key Highlights:
- Rejection at 0.618 Fibonacci + HTF resistance 🔺
- Multiple rejections signal weak bullish momentum ⚠️
- Risk of forming a lower high 📉
From a technical perspective, rejection from this level suggests that sellers are stepping in with strength. When price fails to break through a high confluence resistance zone, it often leads to a shift in structure, particularly if momentum begins to fade. The current lack of bullish volume further reinforces this view, indicating that buyers are not committing enough to sustain a breakout.
If Gold continues to reject from this region, it increases the probability of another move lower, potentially leading to the formation of a lower high. This would signal a weakening trend and open the door for further downside in the coming weeks.
Overall, unless price can reclaim this resistance with strong volume confirmation, the bias leans toward continued rejection and a gradual rotation lower within the broader market structure.
GOLD: Waiting For The Buy Model To Set UpIn this Weekly Market Forecast, we will analyze Gold for the week of April 27 - May1st.
Gold has been going no where but sideways. But I believe that changes this week.
Not interested in shorting this market. Not with fundamentals supporting higher prices at the moment.
FOMC is Wednesday, and my weaken the USD. That would allow GOLD to surge, as it is struggling to move lower from the -FVG.
Patience will allow the market to unfold, and give me a queue to enter a valid buy model.
Enjoy!
May profits be upon you.
Leave any questions or comments in the comment section.
I appreciate any feedback from my viewers!
Like and/or subscribe if you want more accurate analysis.
Thank you so much!
Disclaimer:
I do not provide personal investment advice and I am not a qualified licensed investment advisor.
All information found here, including any ideas, opinions, views, predictions, forecasts, commentaries, suggestions, expressed or implied herein, are for informational, entertainment or educational purposes only and should not be construed as personal investment advice. While the information provided is believed to be accurate, it may include errors or inaccuracies.
I will not and cannot be held liable for any actions you take as a result of anything you read here.
Conduct your own due diligence, or consult a licensed financial advisor or broker before making any and all investment decisions. Any investments, trades, speculations, or decisions made on the basis of any information found on this channel, expressed or implied herein, are committed at your own risk, financial or otherwise.

An intro to reverse-trading."True Invert" is Long instead of Short, TP instead of SL.
How so, you ask? Just like that. I'll describe your typical trade with a standard R:R of 1:2 or 1:3, just the way we like it. A short stop, a wide take profit. And the result, over a series of trades, is a loss.
And it's not just the ratio. The thing is, you enter a trade expecting a profit, but you should enter it expecting a loss. As soon as you deposit money, you immediately imagine it as lost (and that's not far from reality, is it?)
But no, you want profits! You try to minimize the size of your stops. And the result?
So that's how it is. This channel (page) is for promoting a healthy trading lifestyle = trading in reverse. Welcome!
Let's go hunting for LOSSES INSTEAD OF PROFITS.
The Hidden Trap Behind “Perfect” Stop PlacementThere are moments in the market when everything seems to line up perfectly.
A clean chart pattern forms.
The structure is textbook.
The entry is obvious.
And yet… the outcome doesn’t follow.
Not because the idea was wrong — but because of where risk was placed.
This article explores one of the most overlooked dynamics in trading: how “perfect-looking” stop placement often becomes the very reason traders are removed from otherwise valid setups.
Using a recent futures market structure as a case study, we’ll break down:
Why classical stop placement can be vulnerable
How liquidity and order flow reshape risk decisions
Where hidden traps form within otherwise clean technical patterns
And how a more adaptive approach may improve trade structuring
The Setup: A Textbook Breakdown Formation
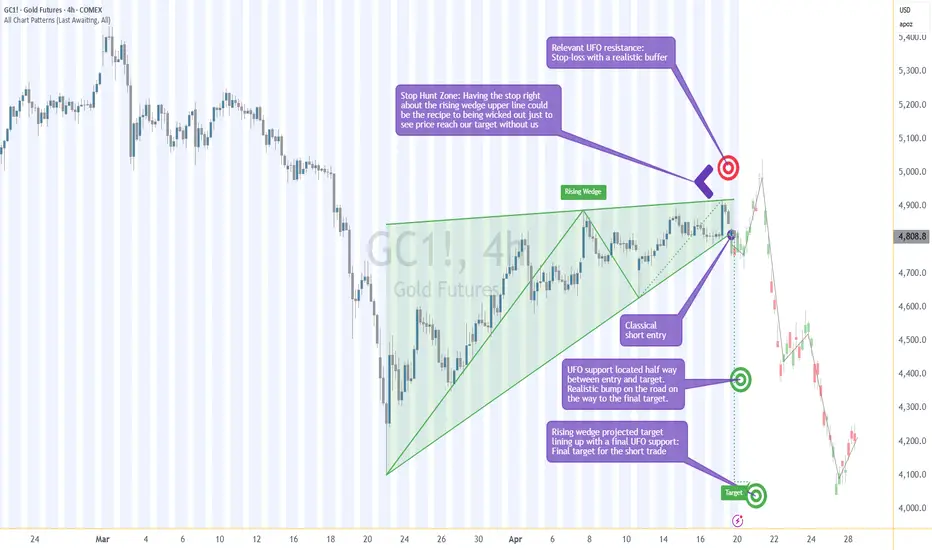
The chart structure under analysis presents a rising wedge pattern on the 4-hour timeframe, gradually compressing price into a tightening range.
This type of structure typically reflects:
Slowing bullish momentum
Increasing imbalance risk
Potential transition from accumulation to distribution
Eventually, the pattern is pierced to the downside, signaling a possible shift in directional control.
Approximate breakdown zone: ~4,815
Projected measured move target: ~4,074
From a purely technical perspective, this is a classic scenario:
Compression → Breakdown → Expansion
But this is where most analyses stop.
And where most problems begin.
The Real Battlefield: Not Entry… But Risk Placement
Many traders focus heavily on:
Finding the right pattern
Timing the entry
Projecting the target
But consistently overlook the most critical question:
Where is everyone else placing their stop?
Because in liquid futures markets, price does not move randomly —
it moves through liquidity.
And that liquidity often sits exactly where:
Stops cluster
Positions become vulnerable
Forced exits can fuel price spikes
The “Perfect” Stop That Isn’t
In a typical wedge breakdown scenario, the textbook stop placement would be:
Just above the upper boundary of the wedge
Approximate level: ~4,922
This placement looks logical:
It invalidates the pattern
It respects structure
It keeps risk tight
But here’s the issue:
👉 It is also the most crowded and predictable location for stop orders.
And that creates a vulnerability.
The Stop Hunt Zone: Where Structure Meets Liquidity
Looking beyond pure structure and into order flow dynamics, a key layer emerges:
A sell-side liquidity zone (resistance) is located above the wedge
This zone extends up to approximately: ~5,050
This creates what can be described as a Stop Hunt Zone:
Lower boundary: wedge resistance (~4,922)
Upper boundary: liquidity zone (~5,050)
Inside this region:
Stops from short positions accumulate
Late breakout buyers may enter
Liquidity becomes dense
This is not random noise.
This is fuel.
What Typically Happens in This Zone
Price may:
Push above the wedge
Trigger clustered stops
Induce breakout participation
Then reverse direction
The result?
Traders with tight stops are removed
Positions are closed at a loss
The original directional idea continues… without them
This is the core paradox:
👉 Being directionally correct but structurally vulnerable.
A More Adaptive Approach to Stop Placement
Instead of anchoring stops to structure alone, a more nuanced approach considers:
Where liquidity is concentrated
Where stops are likely clustered
Where price may temporarily extend before continuation
In this case, a more conservative stop placement could be:
Above the identified liquidity zone (~5,050)
Allowing space for potential stop runs
This does not eliminate risk —
but it acknowledges how price interacts with liquidity before moving.
The Path to Target: Not a Straight Line
While the projected downside target sits near ~4,074, the journey toward that level is unlikely to be linear.
A key intermediate consideration:
Support zone around ~4,416.8
This level sits approximately halfway between:
Entry (~4,815)
Final target (~4,074)
And it introduces an important decision point.
The “Bump in the Road” Problem
Ignoring intermediate levels like this can lead to:
Unrealized gains turning into losses
Premature reversals
Emotional decision-making
This zone may act as:
Temporary support
A reaction point
A place where opposing order flow emerges
Possible approaches around this level include:
Partial position reduction
Risk adjustment
Reassessment of structure
There is no single “correct” action —
but there is clear value in acknowledging the level exists.
Trade Structuring (Illustrative Case Study)
This section presents a hypothetical framework for understanding the setup.
Entry: ~4,815 (on confirmed breakdown)
Stop: Above liquidity zone (~5.050)
Target 1: ~4,416.8 (intermediate support)
Target 2: ~4,074 (projected structure target)
Approximate reward-to-risk:
Full target: ~ 3:1 (depending on execution)
Partial scaling may adjust realized outcome
This example is illustrative only, designed to highlight:
The relationship between structure and liquidity
The impact of stop placement on trade survival
Futures Contract Considerations
Understanding contract structure is essential when applying such setups in futures markets.
Standard Contract: Gold Futures (GC)
Tick size: 0.10 per troy ounce = $10.00
Margin Requirement: ~$34,000 per contract
Micro Contract: Micro Gold Contracts (MGC)
Tick size: 0.10 per troy ounce = $1.00
Margin Requirement: ~$3,400 per contract
One-Ounce Contract: 1-Ounce Gold Futures (1OZ)
Tick size: 0.25 per troy ounce = $0.25
Margin Requirement: ~$340 per contract
These variations allow traders to:
Adjust position sizing
Manage exposure more precisely
Align risk with account size
Margin requirements will vary depending on:
Broker
Volatility conditions
Regulatory framework
Risk Management: The Real Edge
Patterns don’t create consistency.
Entries don’t create consistency.
Risk management does.
Key principles illustrated in this case:
Stop placement should consider liquidity, not just structure
Intermediate levels matter — even in strong directional setups
Tight stops are not always efficient stops
Surviving volatility is part of capturing the move
The goal is not to avoid losses entirely —
but to avoid unnecessary losses caused by predictable positioning.
Final Perspective
This setup is not unique.
It represents a broader principle seen across markets and timeframes:
👉 Markets often move through areas of maximum discomfort before continuing in their intended direction.
And that discomfort is frequently concentrated around:
Obvious stops
Clean technical levels
Widely recognized structures
Understanding this dynamic does not guarantee outcomes.
But it may help shift the focus from:
“Was the trade right?”
to
“Was the trade structured in a way that allowed it to work?”
Data Consideration
When charting futures, the data provided could be delayed. Traders working with the ticker symbols discussed in this idea may prefer to use CME Group real-time data plan on TradingView: www.tradingview.com - This consideration is particularly important for shorter-term traders, whereas it may be less critical for those focused on longer-term trading strategies.
General Disclaimer
The trade ideas presented herein are solely for illustrative purposes forming a part of a case study intended to demonstrate key principles in risk management within the context of the specific market scenarios discussed. These ideas are not to be interpreted as investment recommendations or financial advice. They do not endorse or promote any specific trading strategies, financial products, or services. The information provided is based on data believed to be reliable; however, its accuracy or completeness cannot be guaranteed. Trading in financial markets involves risks, including the potential loss of principal. Each individual should conduct their own research and consult with professional financial advisors before making any investment decisions. The author or publisher of this content bears no responsibility for any actions taken based on the information provided or for any resultant financial or other losses.
GOLD: Short-Term Bearish Potential To Start The WeekIn this Weekly Market Forecast, we will analyze Gold for the week of April 20-24th.
Gold looks to be forming a lower high inside of a -FVG on the Daily TF. If it finds resistance and stays below the upper half of the -FVG, we could see some consolidation, drifting downward early in the week.
No need to go for a homerun hit. While the short-term indicates a possible, yet moderate, bearish correction, the overarching market sentiment remains supported by strong central bank buying, with some institutions viewing dips as buying opportunities for the longer term.
Enjoy!
May profits be upon you.
Leave any questions or comments in the comment section.
I appreciate any feedback from my viewers!
Like and/or subscribe if you want more accurate analysis.
Thank you so much!
Disclaimer:
I do not provide personal investment advice and I am not a qualified licensed investment advisor.
All information found here, including any ideas, opinions, views, predictions, forecasts, commentaries, suggestions, expressed or implied herein, are for informational, entertainment or educational purposes only and should not be construed as personal investment advice. While the information provided is believed to be accurate, it may include errors or inaccuracies.
I will not and cannot be held liable for any actions you take as a result of anything you read here.
Conduct your own due diligence, or consult a licensed financial advisor or broker before making any and all investment decisions. Any investments, trades, speculations, or decisions made on the basis of any information found on this channel, expressed or implied herein, are committed at your own risk, financial or otherwise.

$4,900 Is the Ceiling — Gold Likely Lower Unless It Breaks🟡 Gold Futures Breakdown — Major Reversal & Key Levels
Gold printed a recent high at 5,626.8, followed by an aggressive two-day selloff down to 4,423.2 — a ~20%+ move. That kind of drop signals heavy distribution and a clear shift in momentum.
After the initial decline, price bounced from 5,174.2 and pushed into 5,434.1, where it was rejected hard at the 5,400 resistance zone. This area shows significant sell-side activity, with ~273K contracts indicating strong short positioning and supply overhead.
From that rejection, price continued downward and ultimately retested the 4,100 level, which acted as a key support and triggered a strong reaction from buyers. However, sellers are still active, consistently fading upward moves.
The prior uptrend (March 23 → April 17) is now weakening, and current structure suggests a transition into a corrective phase.
⸻
📐 Key Levels
* Resistance: 4900
* Cycle High: 5,626.8
* Breakdown Trigger: 4,675
* Supports:
* 4,500
* 4,300
* 4,100 (major level)
⸻
📊 Current Structure
Price is sitting within a ~25% Fibonacci retracement zone, which means a bull flag / temporary consolidation is still possible here.
However, this level is critical:
* Holding above current structure → potential stabilization / short-term bounce
* Breaking below 4,675 → continuation lower
⸻
📉 Bearish Scenario
If 4,675 breaks, downside targets:
* 4,500
* 4,300
* 4,100 (full retest)
⸻
⚠️ Key Takeaway
The 5,400 zone is the ceiling right now. Unless price reclaims that level with strength, rallies are likely to be sold into.
Market behavior suggests heavy supply overhead + active short pressure, with buyers struggling to maintain control.
⸻
🧠 Final Note
This is a high-volatility environment. Large moves in short periods reflect aggressive positioning on both sides. Watch reactions at key levels—those will determine whether this stabilizes or continues lower.
Gold Momentum Sours Below ResistanceI've been tracking gold for a potential reversal lower - and one seems to be playing out right now. And with implied volatility low, is suggests we could be due a rise given its cyclical nature.
MS

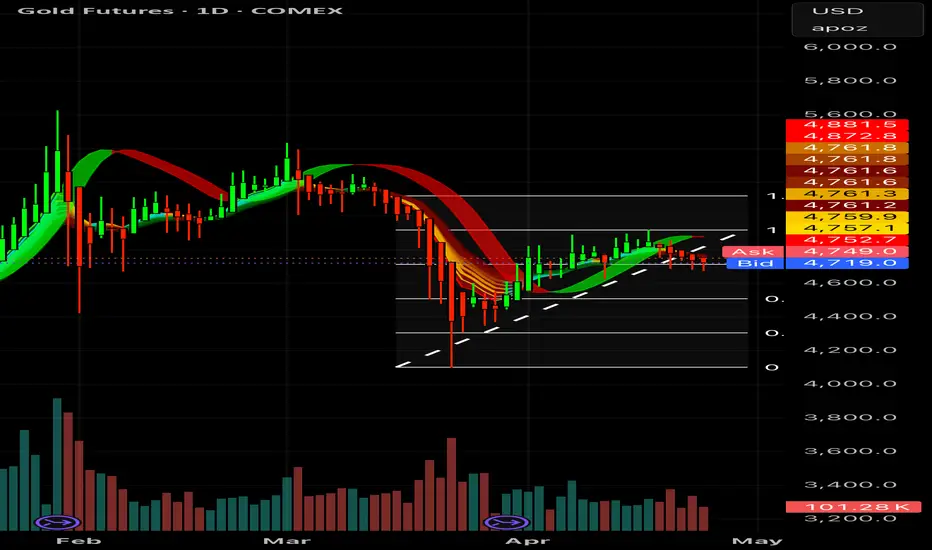
GC (Gold) Analysis, Key-Zones, Setup for Wed (Apr 22)Gold handed back two sessions of gains in one block on Tuesday, opening near 4,842 and printing a session low at 4,685.8 before a soft post-close bounce to 4,735. The move coincided with the dollar index pushing to a 1-week high on firm US retail sales and the Warsh Senate statement on inflation discipline, with Iran-related headlines absorbed by the dollar rather than gold.
The daily structure remains a multi-month consolidation below the January 21 ATH at 5,666.6. Today's close sits directly on the 61.8% retracement of the 52-week range at 4,774.1 from below, and price is trading beneath the 5-day average (4,812) while holding the 20-day (4,705). Intraday, the 4-hour printed a bearish change of character near 4,750 and the 1-hour built lower highs and lower lows through the entire RTH window.
Market Structure:
• Weekly: distribution inside the post-ATH correction, PWH 4,800, PWL 4,550
• Daily: three-month range 4,500-4,900 with composite opinion flipping from 16% BUY last week to 48% SELL today
• 4H: CHoCH down near 4,750, next measured extensions at 4,586 (1.618) and 4,523 (2.0)
• 1H: trend-down day, premium zone capped at 4,920, discount zone at 4,680
• 30M session markers: VWAP 4,749, Y-POC 4,726, Y-VAL 4,716, PDL / session low 4,685.8
Macro Drivers:
• DXY 98.41 (+0.36%, 1-week high) absorbed safe-haven flow that would otherwise have bid gold
• US Retail Sales (Mar) +1.7% m/m vs +1.4% expected, biggest monthly increase in a year
• Fed-chair nominee's Senate statement emphasized price stability "without excuse or equivocation"
• Crude +0.76% on an API draw of -4.47M barrels (vs -1M expected), oil caught the bid that gold did not
• VIX 19.49 (+3.34%) reflecting mild risk-off but routed to USD cash, not metals
• 14-day ATR 152.7 (3.20%), ADX 22.9 with -DI (25.3) dominant over +DI (18.2)
News and Sentiment:
Tuesday's session was a pure dollar-strength story. Iran's refusal to reopen the Strait of Hormuz while the blockade persists, explicit military threats on "predetermined targets," and the stalled Vance-Iran negotiating track would ordinarily have produced a sharp safe-haven bid. Instead, a firm US retail-sales print and the Warsh confirmation narrative pushed the dollar to a 1-week high and drained flow from metals. The Trump administration extended the ceasefire while Iran's Parliament publicly characterized that extension as Tehran buying time, a binary risk that keeps the tail of the distribution elevated but is not yet reflected in the 24.02% ATM implied volatility on the Jun monthly contract.
Cross-asset: S&P futures +0.33%, Nasdaq futures +0.39%, WTI crude +0.76%, DXY +0.36%. Equities were bid on individual-name AI-complex strength; the uncorrelated gold sell-off points to the specific dollar channel rather than generalized risk-on. Silver held relatively firm with the gold/silver ratio near 61.7, historically low, a tell that physical metals demand remains intact while paper gold reprices on FX dynamics.
Composite daily opinion sits at 48% SELL on soft strength, strengthening. Short-term indicators 40% SELL, medium-term 75% SELL, long-term HOLD with the 50-100 MA crossover still bullish. Statistical expected range for Wednesday is approximately 4,586 to 4,891 anchored at the 4,738.7 open, typical intraday range 125 points.
Forecast:
Night Session (6:00 PM ET Globex reopen through 2:00 AM ET): Expect chop inside the 4,725-4,755 band with a soft downside tilt. Asia session anchors to physical-benchmark flow; a break below 4,720 pulls 4,685 back into play, a reclaim of 4,755 targets the 4,766 NYL.H. Bias: neutral-to-soft.
Morning Session (2:00 AM ET UK CPI through 9:30 AM ET US open): The 02:00 ET UK CPI YoY prints against a 3.3% forecast versus 3.0% prior. A hot print reinforces global sticky-inflation and pushes DXY higher, testing 4,685 on gold. A soft print is the first clean dollar-reversal risk and opens 4,774 on the upside. ECB Lane 08:15 ET secondary; a dovish lean caps DXY. The 10:00 AM ET London PM fix concentrates flow and typically sets the morning directional tell.
Afternoon Session (9:30 AM ET US open through 4:00 PM ET close): EIA crude inventories at 10:30 ET follow the API -4.47M surprise, consensus -2M. A confirming draw extends oil strength and should support gold if DXY stalls. US 20-Year Treasury auction at 13:00 ET is the secondary focus, weak tail means higher long-end yields and additional pressure on metals, strong tail is dollar-negative and gold-positive. The COMEX settlement window at 1:30 PM ET sets the referenced daily close. Resolution levels: 4,774 reclaim bullish toward 4,821, 4,685 break bearish toward 4,652.
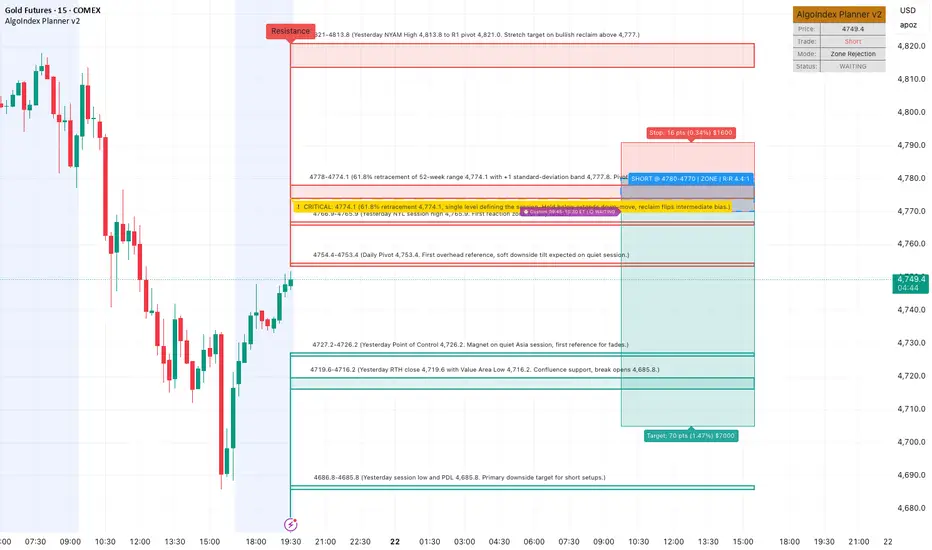
Resistance:
• 4,753.4: Daily Pivot
• 4,765.9: Yesterday NYL session high
• 4,774.1: 61.8% retracement of 52-week range, pivotal line
• 4,777.8: +1 SD band
• 4,788.5: Yesterday Initial Balance Low
• 4,813.8: Yesterday NYAM High / IB High
• 4,821.0: R1 pivot
• 4,854.6: Overnight High / PDH
Support:
• 4,726.2: Yesterday Point of Control
• 4,719.6: Yesterday RTH close
• 4,716.2: Yesterday Value Area Low
• 4,685.8: Yesterday session low / PDL
• 4,652.0: S1 pivot
• 4,644.0: 1.27 Fibonacci extension
• 4,584.4: S2 pivot
Wednesday Events:
• 02:00 ET: UK CPI YoY (3.3% expected vs 3.0% prior)
• 02:00 ET: UK CPI MoM, Core CPI, PPI suite
• 08:15 ET: ECB Lane speaks
• 10:00 ET: Eurozone Consumer Confidence Flash (-17.2 expected)
• 10:30 ET: EIA Crude Oil Inventories (-2M expected, after API -4.47M)
• 11:10 ET: ECB Sleijpen speaks
• 13:00 ET: US 20-Year Treasury Auction
• 16:00 ET: TXN earnings
• 16:05 ET: Tesla earnings
• 16:10 ET: IBM earnings
Bias:
• Intermediate: bearish under 4,774, neutral 4,774-4,821, bullish above 4,821
• Tactical for Wednesday: sell the rally into 4,770-4,780 with targets at 4,705 / 4,685 / 4,652
• Invalidation: 30-minute close above 4,777 flips the setup
• Macro override upside: Iran operationally closes Hormuz or military exchange, gold gaps higher and levels become irrelevant
• Macro override downside: Warsh confirmation progresses cleanly or Fed speakers push back on 2026 rate-cut pricing, DXY spikes through 99 and gold tests 4,584 / 4,494
Setups:
Primary Setup, Short the rally:
• Direction: Short
• Entry Zone: 4,770-4,780 at the 61.8% Fib retracement and +1 SD confluence
• Stop: above 4,791
• Target 1: 4,705 (20-day MA)
• Target 2: 4,685 (session low retest)
• Target 3: 4,652 (S1 pivot)
• Rationale: Lower-high, lower-low intraday structure; 48% SELL composite with 75% SELL medium-term; -DI dominant; below 5-day MA rejecting long-term 61.8% Fib
Alternative Setup, Long the reclaim:
• Direction: Long
• Trigger: 30-minute close above 4,777
• Stop: below 4,753 (daily pivot)
• Target 1: 4,814 (IB High)
• Target 2: 4,854 (PDH)
• Rationale: Reclaim of the 4,774 Fib flips the intermediate bias, typically coincides with a DXY break below 98
How I'm seeing it:
• The day's character was pure dollar-driven, not gold-specific
• 4,774 is the single level that defines the session, hold below and the down-move extends, reclaim and the April range holds
• Real edge is at the extremes, 4,770-4,780 to sell or 4,685-4,690 to buy the test, not in the middle
• Iran tail-risk is still live and not priced in the ATM IV, position size accordingly
• Primary setup: Short from 4,770-4,780, stop 4,791, targeting 4,705 then 4,685 then 4,652
Clean picture for Wednesday: the dollar is in control, gold rallies into 4,774 are for sale until that level closes back above.
Good Luck !!!
GOLD FAKE BREAKOUT AGAIN?
Fake breakout confirmed near 155,000 resistance. Price pulled back, but trendline support held perfectly. Now coiling again.
Structure: Rising trendline from week lows intact
EMA 55 acting as dynamic support
Price holding above 152,075–152,233 zone
Key Levels This Week:
Resistance 154,500 – 155,000
Support 1152,233 - 151,000
Two scenarios:
📈 Hold above 152,233 - retest 155,000
📉 Break below 152,000 - 151,000 next
Trendline intact. But 155,000 is a wal, clean breakout with volume needed before committing.
Fake breakouts shake weak hands. Structure still bullish.
Let me know if you agree with my idea or not?
⚠️ Educational only. Not investment advice.
#MCXGold #XAUUSD #GoldTrading #TechnicalAnalysis #WeeklyView

Gold - Indecision at resistance after the liquidity sweep!Gold is currently trading in a recovery phase after a sharp sell-off, but momentum has clearly slowed down as price approaches a key resistance zone. The market is no longer trending aggressively and is instead moving more cautiously, indicating uncertainty between buyers and sellers. This shift suggests that gold is entering a decision phase where the next move will likely be determined by reactions at key levels.
Daily FVG resistance
Above the current price lies a large daily FVG, which is acting as a strong resistance zone. This area represents previous imbalance where sellers stepped in aggressively, and price is now struggling to break back into it with conviction. The rejection near this zone highlights that supply is still present, and as long as gold remains below or inside this FVG without a strong breakout, upside potential remains limited. This level is the main barrier preventing further bullish continuation.
Liquidity sweep
Recently, gold performed a liquidity sweep below the local lows, briefly pushing lower before quickly recovering. This move suggests that sell-side liquidity has been taken, which often happens before either a reversal or a continuation move. However, the lack of strong follow-through after the sweep indicates that the market is still undecided, rather than immediately shifting into a clear bullish phase.
Current consolidation
Price action is currently consolidating just below the daily FVG resistance. The market is moving sideways, showing no strong impulsive direction. This type of behavior typically signals accumulation or distribution, depending on the broader context. Given the overall structure and resistance overhead, this consolidation leans slightly bearish, as buyers are struggling to push price higher despite having cleared liquidity below.
Target if we lose support
If the current support level, formed after the liquidity sweep, fails to hold, gold is likely to move lower toward the next major support zone. This level represents a logical target, as it aligns with previous structure and resting liquidity. A break below current support would confirm weakness and likely trigger a continuation of the broader downtrend, opening the door for a deeper move to the downside.

Gold Futures Short Trade Idea | FVG + Resistance RejectionGold Futures (COMEX) is currently trading near a major support and demand zone after a sharp corrective decline from recent highs. The overall market structure suggests that although sellers pushed price lower, the current area around 4700–4680 may attract strong institutional buying interest. This zone is important because it aligns with previous reaction levels, liquidity areas, and unfilled price imbalances that often lead to reversals.
From a Smart Money Concept perspective, price has already taken liquidity from recent lows and is now stabilizing. If buyers successfully defend this support region, the market could shift from bearish correction into a bullish recovery phase. A Change of Character (CHoCH) on lower timeframes followed by a Break of Structure (BOS) to the upside would strengthen the long setup significantly.
The Fair Value Gap (FVG) above current price also acts as a magnet for price movement, meaning the market may attempt to revisit those inefficient zones before deciding the next major trend direction. If bullish momentum increases, Gold Futures could climb steadily toward higher resistance levels in stages.
📌 Detailed Long Trade Plan:
Entry Zone 1: 4700 – 4690
Entry Zone 2: 4685 – 4670 (deeper pullback entry)
Conservative Entry: Wait for bullish confirmation candle
🎯 Targets:
Target 1: 4745
Target 2: 4780
Target 3: 4820
Target 4: 4840
Extended Target: 4890+ if breakout continues
🛑 Risk Management:
Stop Loss below 4660 or below recent swing low
Use proper lot sizing
Secure profits at each target level
Move stop to breakeven after first target
📈 Bullish Confirmation Signals to Watch:
Strong rejection wick from support
Higher low formation
Break above short-term resistance
Rising volume with bullish candles
BOS on smaller timeframe charts
⚠️ If price breaks below support and closes strongly under 4660, bullish setup may weaken and more downside can follow.
This setup offers a solid risk-to-reward opportunity if buyers return with momentum. Always wait for confirmation and trade with discipline.
#GoldFutures #XAUUSD #GoldAnalysis #TradingView #BullishGold #LongTrade #COMEX #PriceAction #SmartMoneyConcept #ForexTrading #DayTrading #MarketAnalysis

GOLD - time to make a drop to $4400 or even loverGOLD - time to make a drop to $4400 or even lover
at $4400 we have hyge option level
at this moment big POC at $4820 which mens good accumulation
didn't do a GOLD idea for a while)

Will Gold Drop Into BISI Before Reversing Back to NWOG?Bias
- Short-term: bearish into H1 BISI (discount)
- Mid-move: mean reversion back into NWOG
- Context: Not trend reversal, this is delivery from premium → discount → rebalance
Narrative (What price is doing)
1. Buy-side taken (left side) → objective achieved
2. Failure to hold above NWOG high → weakness confirmed
3. SMT + lower high → distribution, not continuation
4. Now price seeks sell-side (H1 BISI / SSL)
5. After that, expect rebalance into NWOG range
Key Levels
- NWOG High (premium) → resistance, sell zone
- NWOG Low / mid → magnet after reaction
- H1 BISI (blue zone below) → primary draw
- Sell-side liquidity (below) → extension target

Gold (GC) Analysis, Key-Zones, Setup for Fri (Apr 24)Gold closed Thursday at 4,709.5 on the June contract, down 14.5 or 0.31 percent, inside a compressed 14-point session range (4,705.7 to 4,719.8). The day opened at 4,715.6, rejected the prior close at 4,724.0 on two probes, and drifted into the lower quarter of the range by the electronic settle. The dominant driver was the dollar, which climbed to a 1.5-week high at 98.77 on the back of a strong US Manufacturing PMI Flash beat (54.0 vs 52.5 expected, the firmest reading in nearly four years). Middle East safe-haven demand rotated into the dollar rather than the metal. The offsetting tailwind came from the 5-Year TIPS auction, which stopped at 1.367 percent high yield, down from 1.433 percent prior, a signal that real-yield duration demand is returning even as the dollar trade dominates the session.
Market Structure
Higher-timeframe posture is a corrective pullback inside a multi-month uptrend. The short-term moving-average stack is above price (5-day 4,781.0, 20-day 4,728.4, 50-day 4,916.5, 100-day 4,779.1), with only the 200-day at 4,305.6 beneath, so the short-term structure is bearish while the long-term trend remains intact. Momentum reads soft: 9-day RSI 44.75, 14-day 45.96, 20-day 46.73, all below 50. The 14-day ADX is 22.39 with Negative Direction Index at 25.97 over Positive at 16.76, confirming a weak downtrend. Multi-indicator composite reads 64 percent SELL, Soft strength, Strengthening direction, shifting from 8 percent BUY one week ago and 40 percent SELL yesterday, a bearish acceleration. 14-day statistical expected range is 142.9, 14-day daily range is 108.9, implying Friday most likely resolves inside the 4,633 to 4,816 pivot envelope unless an external catalyst forces a break.
Key Levels
Resistance
4,861.4 3rd-level pivot resistance, 40-day moving average stall
4,845.9 3rd standard deviation resistance, outer statistical tail
4,823.5 2nd standard deviation resistance, monthly tail-risk zone
4,816.3 2nd-level pivot resistance
4,794.4 1st standard deviation resistance, 14-day RSI 50 trigger zone
4,774.1 61.8 percent retrace from the 52-week low
4,770.2 1st-level pivot resistance, 18-day MA cross
4,728.4 20-day moving average, Thursday rejection zone
4,725.1 Friday daily pivot
4,724.0 Previous Close, Wednesday settle
4,719.8 Thursday session high
4,716.1 38.2 percent retrace from 13-week low, magnet level
Support
4,705.7 Thursday session low, first support on Globex reopen
4,696.3 computed target for next session, 4-session pivot mean reversion
4,696.1 38.2 percent retrace from 4-week high, thick magnet zone with Target
4,679.0 1st-level pivot support, primary near-term structural support
4,670.0 3-10 day moving average crossover stall
4,653.6 1st standard deviation support
4,633.9 2nd-level pivot support, 50 percent retrace from 4-week high to low
4,624.5 2nd standard deviation support, monthly tail-risk downside
4,602.1 3rd standard deviation support
4,587.8 3rd-level pivot support, outer pivot ladder base zone
Broader Market Drivers
Dollar and Real Yields: The dollar was the dominant variable Thursday. DXY at 98.77 (+0.22 percent) sits at a 1.5-week high on the back of the PMI beat and safe-haven demand tied to the US-Iran Strait of Hormuz confrontation. The 5-Year TIPS auction cleared at 1.367 percent high yield, well below the 1.433 percent prior, with Bid-to-Cover at 2.570, a sign real-yield duration is being bid. On any other session the TIPS result alone lifts gold, but the dollar move compressed that impact into a standoff. Friday's setup is a function of which of these two narratives captures the dominant flow.
Fed and Monetary Policy: No Fed speakers Thursday. Market pricing is converged on a hold at the April 29 FOMC meeting with the first cut pushed into Q3. Real-yield compression is consistent with a market that is no longer pricing meaningful cuts into summer but is pricing that the cycle peak is past. The University of Michigan 1-year and 5-year inflation expectations final prints at 10:00 ET Friday are the only first-order monetary-policy-adjacent data on the day, and they move the TIPS complex directly.
Geopolitical Backdrop: The US and Iran are locked in a Strait of Hormuz confrontation, with both sides blocking the waterway to gain leverage during an extended ceasefire. Overnight reports of US Military tanker intercepts in Asian waters raised the tail-risk premium but did not deliver a gold rally, because the safe-haven bid rotated to the dollar. Iran said it is awaiting a US response before peace talks restart. The geopolitical backdrop supports gold structurally on a multi-week view but is a pure volatility input on the session view.
Central Bank Buying and Structural Demand: No new PBOC or BRICS central-bank-buying headlines Thursday. Structural demand backdrop unchanged from the latest World Gold Council read (April). Weekly positioning data through April 14 shows managed money added 4,696 long contracts and trimmed 413 shorts, extending net-long to 95,141 contracts. Swap dealers added 6,221 short contracts, the standard producer-hedge posture when price is elevated. Non-commercial net length at 162,526 is extended relative to the 12-month mean but remains materially below the January peak. Extended, not extreme.
News and Sector Analysis
Thursday's session was a story of a single day where the two major gold inputs pulled in opposite directions and the dollar won the session. On the bullish-for-metal side: a strong 5-Year TIPS auction with a 1.367 percent stop confirmed real-yield duration is being bought, crude rose 1.39 percent to 94.25 on Hormuz supply risk (inflation-expectation tailwind for gold), and the US-Iran standoff escalated with reports of US Military tanker intercepts overnight. On the bearish-for-metal side: the US Manufacturing PMI Flash printed 54.0 vs 52.5 expected, the strongest reading in nearly four years, the dollar climbed to a 1.5-week high, and the safe-haven rotation went to the dollar rather than the metal. The session closed a neutral doji on the 20-day moving average at 4,728, a level the market clearly regards as technical inflection.
The tension heading into Friday is real. If Michigan inflation expectations print hotter at 10:00 ET, the TIPS move reverses, the dollar extends, and gold cracks the 4,705 session low to test 4,696 and potentially 4,679. If Michigan prints in line with or below prior (1-year 4.8 percent, 5-year 3.4 percent), the TIPS-flow narrative regains dominance, the dollar eases, and gold has room to reclaim 4,720 and probe 4,728. The three-way cross-asset read (dollar firm, real yields easing, crude firm) is the cleanest signal to monitor in the opening hour.
Primary Setup
Direction: Short
Entry Zone: 4,720 to 4,725 (rejection at Friday pivot plus 20-day MA zone)
Stop Loss: 4,735 (above pivot plus 20-day MA)
Target 1: 4,696 (computed target, 38.2 percent retrace of 4-week high zone)
Target 2: 4,679 (1st-level pivot support)
Rationale: Short-term MA stack above price, multi-indicator composite 64 percent SELL with strengthening direction, 14-day ADX at 22.39 with -DI over +DI, dollar at a 1.5-week high, and Thursday rejected 4,725 twice. Sellable rallies into the 4,720 to 4,725 ceiling until a daily close reclaims 4,770.
Alternate Setup
Direction: Long
Entry Zone: 4,679 to 4,696 (reclaim of Target zone, S1 shelf)
Stop Loss: 4,666
Target 1: 4,720 (Thursday session high)
Target 2: 4,770 (R1, 18-day MA cross, 61.8 percent retrace from 52-week low)
Rationale: If DXY gives back from 98.77 and Michigan inflation expectations print soft, the TIPS-flow narrative reasserts. The 4,679 to 4,696 zone is a thick support shelf (S1 plus Target Price plus 38.2 percent retrace of 4-week high) and has historically attracted dip buyers when real yields compress.
Bias
Two-way with bearish skew, conditional on the University of Michigan inflation expectations print at 10:00 ET and the dollar reaction. Supporting evidence for the bearish skew: short-term MA stack above price, multi-indicator composite 64 percent SELL and strengthening, 14-day ADX confirming weak downtrend, and dollar at a fresh 1.5-week high. Offsetting evidence: falling real yields (5-Year TIPS 1.367 percent vs 1.433 percent prior), crude strength lifting inflation expectations, and structural long positioning remains intact from official-sector demand. Friday's path is a binary on which narrative the opening hour chooses.
Night Session Forecast (Asia and Europe, 18:00 ET to 08:00 ET)
Bias modestly bearish with tight expected range. Japanese CPI Overall at 19:30 ET (1.4 percent forecast vs 1.3 percent prior) and Core CPI YoY (1.7 percent forecast vs 1.6 percent prior) move USD/JPY and are the first overnight catalysts. Japanese Service PPI at 19:50 ET (3.0 percent forecast vs 2.7 percent prior) is a secondary input. London morning brings UK Retail Sales at 02:00 ET, French Consumer Confidence at 02:45 ET, and the German IFO triad plus SNB's Schlegel speech at 04:00 ET. A soft IFO pulls EUR lower, lifting DXY and pressuring gold into the US handover. Expected range 4,695 to 4,725.
Morning Session Forecast (08:30 ET to 12:00 ET)
Bias bearish below 4,720 with the 10:00 ET University of Michigan Sentiment Final and inflation expectations as the primary binary. Canadian Retail Sales at 08:30 ET (0.9 percent forecast vs 1.1 percent prior) is a CAD input that matters for gold only via broader dollar translation. The US Cash Open at 9:30 ET should respect the Thursday range until the 10:00 ET print. A hotter Michigan 1-year (above 4.8 percent) firms the dollar, drives real yields higher, pushes gold through 4,705 to 4,696. A softer print reopens the path to 4,720 and 4,728. COMEX pit close is 1:30 PM ET, which historically triggers a volume roll and can amplify whichever direction establishes in the morning. Expected range 4,695 to 4,728.
Afternoon Session Forecast (12:00 ET to 16:00 ET)
Consolidation into the COMEX close. Post-Michigan action most likely settles in a 20-to-30-point band around the post-print anchor. No US data, no Fed speakers. Friday weekly-positioning flows firm the dominant narrative of the week into the close; this week's dominant narrative is dollar strength on the PMI beat. Expected range 4,690 to 4,720.
Friday April 24 Events
- 19:30 ET (Thu) Japanese CPI Overall Nationwide (1.4 percent forecast, 1.3 percent prior)
- 19:30 ET (Thu) Japanese Core CPI Nationwide YoY (1.7 percent forecast, 1.6 percent prior)
- 19:50 ET (Thu) Japanese Service PPI (3.0 percent forecast, 2.7 percent prior)
- 02:00 ET UK Retail Sales MoM (0 percent forecast, -0.4 percent prior)
- 02:45 ET French Consumer Confidence (88 forecast, 89 prior)
- 04:00 ET German IFO Expectations (85.5 forecast, 86.0 prior)
- 04:00 ET German IFO Current Conditions (86.2 forecast, 86.7 prior)
- 04:00 ET German IFO Business Climate (85.7 forecast, 86.4 prior)
- 04:00 ET SNB's Schlegel Speaks
- 06:30 ET Russian Interest Rate Decision (14.5 percent forecast, 15.00 percent prior)
- 08:30 ET Canadian Retail Sales MoM (0.9 percent forecast, 1.1 percent prior)
- 10:00 ET University of Michigan Sentiment Final (48.5 forecast, 47.6 prior)
- 10:00 ET University of Michigan 1-Year Inflation Final (4.8 percent forecast, 4.8 percent prior)
- 10:00 ET University of Michigan 5-Year Inflation Final (3.4 percent forecast, 3.4 percent prior)
How I'm Seeing It
The structural trend remains up, but the near-term posture is a corrective pullback with the short-term moving-average stack overhead and the dollar at a 1.5-week high. The multi-indicator composite has flipped from modestly bullish a week ago to 64 percent SELL and strengthening today, which is the cleanest signal on the swing book. The binary catalyst that resolves Friday's setup is the 10:00 ET University of Michigan inflation expectations print. A hot print tightens real yields, extends the dollar, and takes gold through the 4,696 magnet to test 4,679. A soft print flips the read, pressures the dollar, and allows gold to reclaim 4,720 with room toward 4,728 and potentially 4,770. Expect consolidation between 4,696 and 4,720 until the print forces the break.
Good Luck !!!

Gold Bearish IdeaLooking for gold to move even more to the downside.
Potential Bearish Fair Value Gap to short lower.
Sellside liquidity lower.

Gold Update 15APR2026Price behaves as planned earlier
We have expected breakout higher in wave A (yellow) within larger wave B (white)
Wave A (yellow) looks completed and we might be in the consolidation wave B (yellow)
It can hit between 38.2 and 61.8% Fibonacci retracement levels of wave A (yellow)
in the area of $4,400-$4,600

**GC Notes from Recent High Frame Price action 4/16-4/17****GC Notes from Recent High Frame Price action 4/16-4/17**
* GC is currently trading around **4,808**, continuing to hold above the **inverse head and shoulders neckline**.
* The reversal structure off the **4,128 low** remains intact, but price is now clearly **stalling under resistance**.
* We are seeing multiple candles rejecting around the **4,813 – 4,908 zone**, which confirms **sellers are still active in this area**.
* Price is still holding higher lows, but momentum has slowed into a **tight compression range just below resistance**.
* This is shaping into a classic **continuation vs rejection decision zone**.
* The broader structure remains bullish, but short-term price action is showing **indecision at a key level**.
Overall structure remains **bullish, but compressing under resistance**.
**Levels I’ve been tracking**
* **5,380**: Higher timeframe resistance
* **5,265**: Extended target
* **5,065**: Major breakout target
* **4,813 – 4,908**: Key resistance zone
* **4,808**: Current reaction area
* **4,734**: Immediate support
* **4,645 – 4,629**: Key demand zone
* **4,548**: Stronger support
* **4,400**: Must-hold level
**Volume and behavior notes**
* Volume remains **elevated compared to the prior consolidation phase**, supporting the broader reversal.
* Recent candles show **reduced momentum and tighter ranges**, signaling **indecision under resistance**.
* This type of structure often leads to either:
* a breakout after compression
* or a pullback to reset before continuation
* Holding above **4,734** keeps the bullish structure intact.
* A clean break above **4,908** likely opens continuation toward **5,065 → 5,265 → 5,380**.
* A loss of **4,734** likely rotates price back toward **4,645 → 4,548 → 4,400**.
**Overall read from my notes**
GC remains **bullish overall**, but is now clearly **in a decision zone just under resistance**.
The key range is:
**4,734 – 4,908**
Break above **4,908** → continuation toward **5,065+**
Lose **4,734** → pullback into demand before the next move
This is **not a chase area**, but a level to wait for confirmation into the overnight session.


Gold Bulls Drag Their Heels En Route To $5000Gold is on track for its fourth consecutive week higher. Yet with resistance looming, alongside the fact it has taken longer to recoup just half the losses sustained during its previous selloff makes me question how much upside potential gold bulls really have.
MS

Will Gold Continue Higher After Taking Buy-Side Liquidity?HTF (Daily):
- Strong bullish expansion → DOL above already hit
- Now in retracement / continuation phase
- Overall bias still bullish toward ATH
MTF (4H):
- Holding above breaker block / NWOG levels
- No bearish displacement
- Structure still intact, just pulling back
LTF (1H):
- Retracing into discount / imbalance
- No SMT on lows yet → no strong confirmation
- Waiting for reaction to confirm continuation
Scenarios:
1. Bullish continuation (primary):
Hold current lows → form support
Push higher → target buy-side / ATH
2. Deeper retracement:
Sweep lows → move into deeper discount
Then expand higher
Key Insight:
This is not reversal, it’s retracement after expansion.

Gold Bullish but need more confirmation! Price broke out of Monday’s range and is currently holding above, showing early signs of acceptance.
Now trading within the day’s value, with price pushing toward the Previous Daily High (4819.8).
Key Observations:
Range breakout confirmed from prior session
Holding above range = bullish leaning structure
Currently inside value → awaiting expansion
Game Plan:
Bullish above value area high with acceptance → targeting PDH (4819.8)
Failure to break value high could lead to rotation back through value
Patience while price develops outside of value
Let the market confirm — no chasing inside value.
#Gold #Futures #Trading #PriceAction #GC

MGC1! VWAP Rejection → Bearish ContinuationWhen VWAP flips from support to resistance and fails to reclaim, continuation becomes the higher probability outcome.
📊 1. Context
Prior bullish expansion → followed by stall
Market transitions into distribution / rotation
Breakdown confirms shift in control
VWAP becomes key equilibrium
⚙️ 2. Setup
Bounce into VWAP after breakdown
Weak reclaim attempt (no strong displacement)
Price stalls and rejects at VWAP
Sellers re-enter → continuation setup
🎯 3. Execution Plan
Entry: On rejection from VWAP / failed reclaim
Stop: Above VWAP + local structure
Target: Rotation back toward prior lows
R:R: Continuation-based structure
Invalidation: Strong acceptance above VWAP
