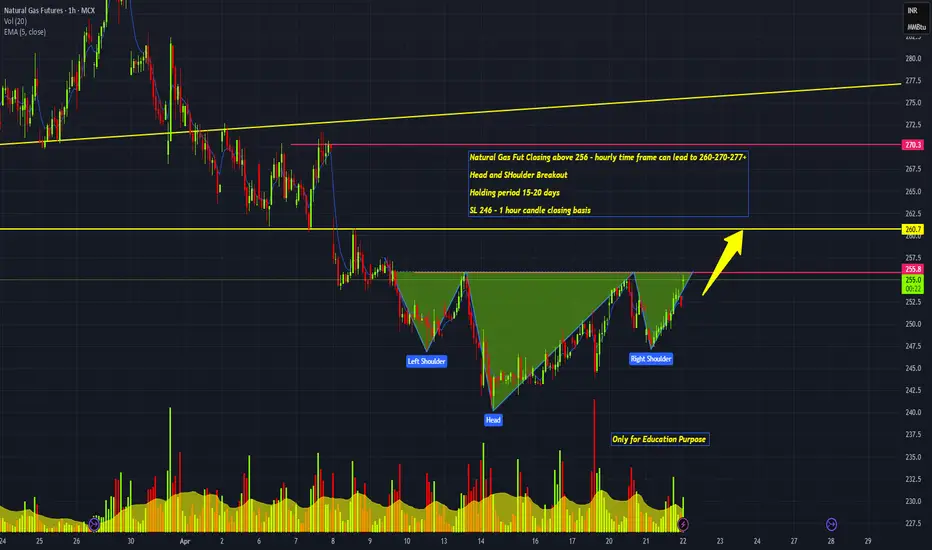
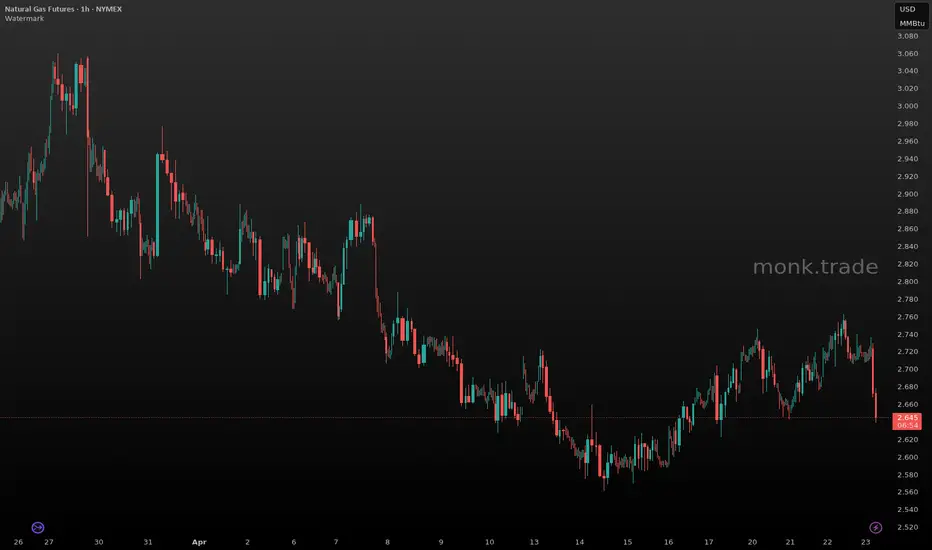
Natural Gas Fut Closing above 256 - hourly time frame can lead Natural Gas Fut Closing above 256 - hourly time frame can lead to 260-270-277+
Head and SHoulder Breakout
Holding period 15-20 days
SL 246 - 1 hour candle closing basis
Natural Gas Futures
No trades
In-depth trading ideas
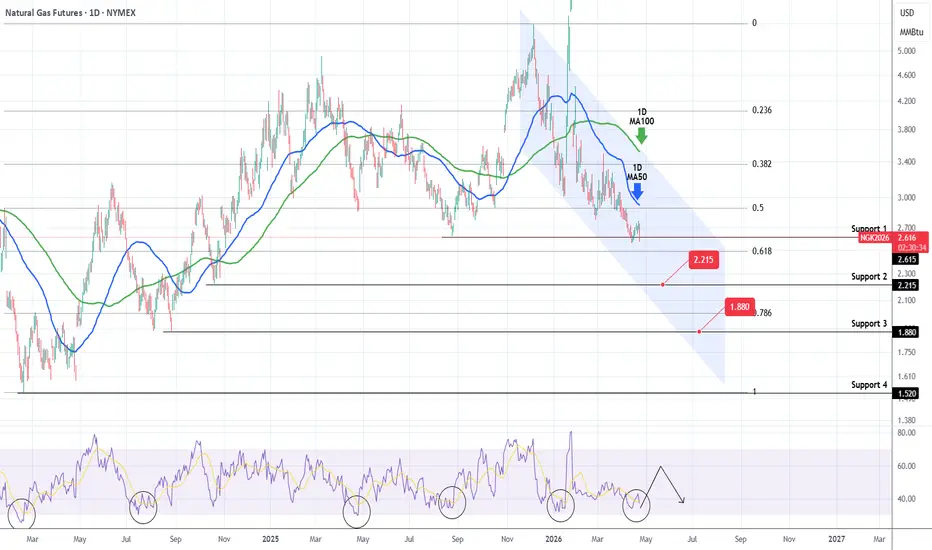
NATURAL GAS Strong downtrend targeting at least 1.880.Natural Gas (NG1!) has been on a strong downtrend throughout the whole year and with the 1D MA50 (blue trend-line) suppressing the trend, it eye Support 2 and Support 3 next.
With the 1D RSI though almost oversold, a short-term rebound here isn't unlikely (as previous similar cases), but it will be a short opportunity.
Our next Targets are 2.215 and 1.880.
---
** Please LIKE 👍, FOLLOW ✅, SHARE 🙌 and COMMENT ✍ if you enjoy this idea! Also share your ideas and charts in the comments section below! This is best way to keep it relevant, support us, keep the content here free and allow the idea to reach as many people as possible. **
---
💸💸💸💸💸💸
👇 👇 👇 👇 👇 👇
NATGAS: Weak Market & Bearish Forecast
The analysis of the NATGAS chart clearly shows us that the pair is finally about to tank due to the rising pressure from the sellers.
Disclosure: I am part of Trade Nation's Influencer program and receive a monthly fee for using their TradingView charts in my analysis.
❤️ Please, support our work with like & comment! ❤️
NG Long — $NGM26 breaking out of the 2.75 shelf on massive volumSetup: The 4h chart shows a clear downtrend from 3.40 to a low near 2.65, followed by a sharp V-reversal bounce. The most recent 4h candle is a strong bullish bar with the highest volume on the chart (50k+), reclaiming the 2.75–2.80 zone that previously acted as support before the Apr 23–24 breakdown. On the 1h, the last two bars (Apr 27 05:00–07:00) are impulsive with expanding volume — 6,751 and 17,696 respectively — the strongest green volume in days. Price has broken above the Apr 24 breakdown initiation zone (~2.75) and is pushing toward 2.80 resistance.
Flow: Natural gas is the session's standout mover, up 4.29% on the day with multi-feed bullish confirmation and elevated volume well above recent norms. DXY weakness adds a macro tailwind for commodities broadly. The weather/storage narrative is providing fundamental support for a sustained move rather than a one-candle spike.
Plan: Stop is placed below the breakout shelf — the Apr 27 05:00 low at 2.748 and the Apr 26–27 base accumulation zone. A close back below that shelf invalidates the breakout thesis. Target is the 2.90 area, which represents the prior rejection high from Apr 22–23 before the sharp breakdown, and also aligns with the Apr 4h resistance cluster. R/R is approximately 2.5:1.
📍 Entry: 2.793
🛑 Stop: 2.751
🎯 Target: 2.9
⚖️ R:R: 2.55
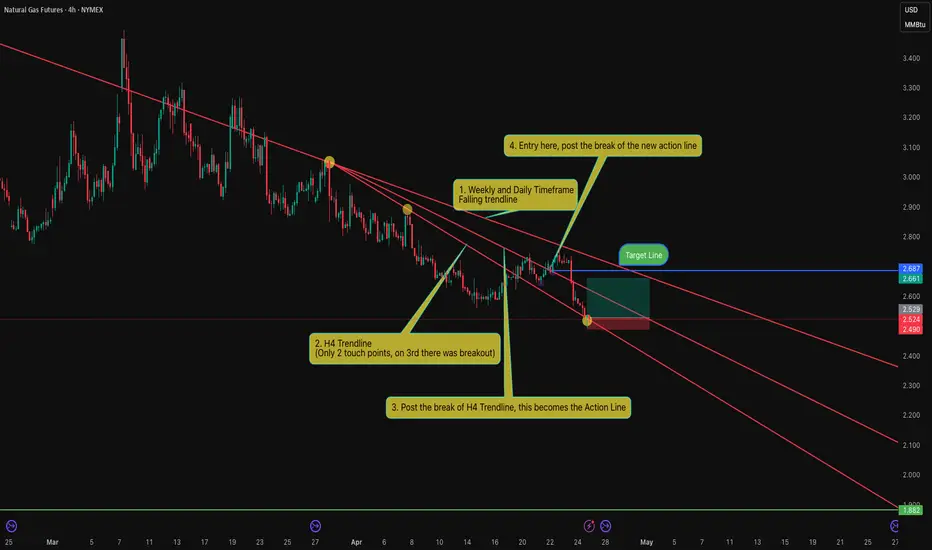
Natural Gas Price Action with Trendline AnalysisPrice has been in downtrend.
The Downwards trend line was broken on lower timeframe and then is getting retested.
The Higher Timeframe downtrend line is acting as Resistance/target point.
Target 5%
Risk 1.5%
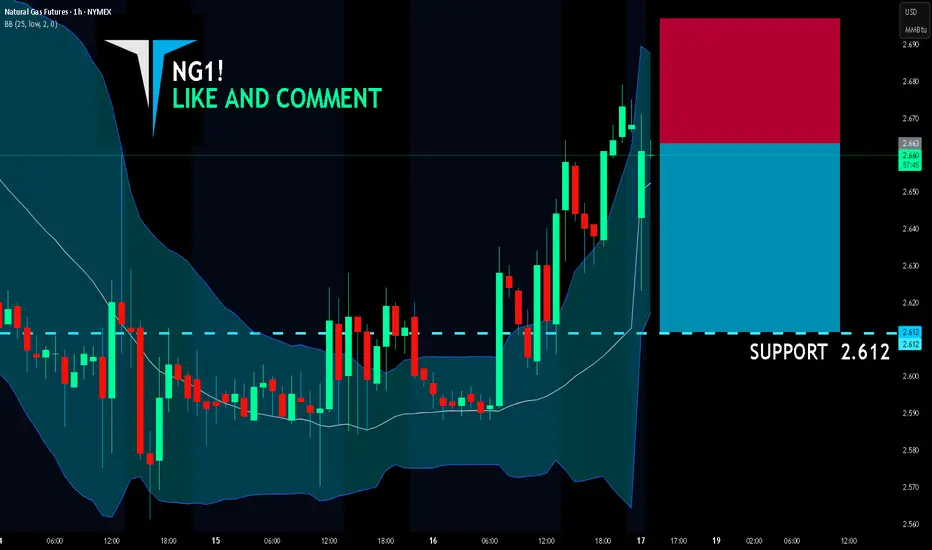
NG1! BEARS ARE STRONG HERE|SHORT
NG1! SIGNAL
Trade Direction: short
Entry Level: 2.663
Target Level: 2.612
Stop Loss: 2.697
RISK PROFILE
Risk level: medium
Suggested risk: 1%
Timeframe: 1h
Disclosure: I am part of Trade Nation's Influencer program and receive a monthly fee for using their TradingView charts in my analysis.
✅LIKE AND COMMENT MY IDEAS✅
Gold Price Forecast | Oil | Dollar | Silver | Natural Gas.0:00 — Introduction & Market Overview
A brief look at the commodities covered today and a recap of the previous stock market update.
0:22 — Natural Gas (NG) NYMEX:NG1!
Analysis of the current weekly downtrend and why bears remain in control despite a slight trend line break. Key support levels are identified at 2.4 and 2.6.
5:52 — Oil (CL) NYMEX:CL1!
Oil moves into a neutral trend after breaking a higher low pivot. Discussion on geopolitical tensions and the importance of a "shallow pullback" to maintain bullish momentum.
8:24 — US Dollar (DXY)
The dollar continues to trade within a long-term megaphone pattern. Analysis of the 2027 rate cut probabilities and the upcoming FOMC meeting impact.
9:58 — Gold (GC) COMEX:GC1!
Gold shows signs of a rare weekly downtrend after a bear break from a rising wedge. Levels to watch for a potential long-term top if support at 4131 fails.
12:23 — Silver (SI) COMEX:SI1!
Silver is showing relative weakness compared to Gold. A look at the falling wedge pattern and the critical 72.5 level that needs to hold to maintain the daily uptrend.
14:06 — Outro & Summary
Final thoughts and a reminder to check out the S&P 500 and Bitcoin analysis from the previous video.

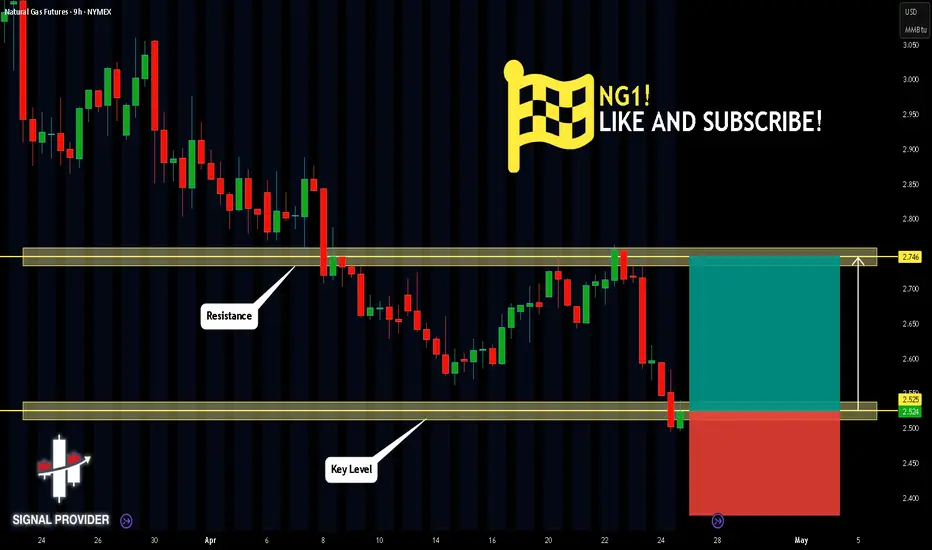
NG1! Will Move Higher! Buy!
Please, check our technical outlook for NG1!.
Time Frame: 9h
Current Trend: Bullish
Sentiment: Oversold (based on 7-period RSI)
Forecast: Bullish
The market is approaching a key horizontal level 2.525.
Considering the today's price action, probabilities will be high to see a movement to 2.746.
P.S
We determine oversold/overbought condition with RSI indicator.
When it drops below 30 - the market is considered to be oversold.
When it bounces above 70 - the market is considered to be overbought.
Like and subscribe and comment my ideas if you enjoy them!
NATGAS: Will Start Growing! Here is Why:
Balance of buyers and sellers on the NATGAS pair, that is best felt when all the timeframes are analyzed properly is shifting in favor of the buyers, therefore is it only natural that we go long on the pair.
Disclosure: I am part of Trade Nation's Influencer program and receive a monthly fee for using their TradingView charts in my analysis.
❤️ Please, support our work with like & comment! ❤️
NG Short — $NGM26 breakdown through 2.80 support on heavy volumeSetup: The 4h chart shows a persistent downtrend from 3.60 in early March, with a brief recovery rally into the 2.85-2.90 zone that has now reversed sharply. The 1h chart shows price grinding up to 2.90+ over Apr 21-22, then failing hard this session — the Apr 23 07:00 bar opened at 2.811, pushed down to 2.778, and closed at 2.781 on the highest volume of the recent sample (15,172). That is a decisive breakdown candle reclaiming nothing, confirming the rejection of the 2.85-2.90 resistance shelf and breaking below the 2.80 pivot that had acted as support.
Flow: Natural gas is the session's standout bear at -2.83% on elevated volume, hitting all three bearish feeds. The broader tape is risk-off with commodities under pressure from a modest DXY bid. The immediate catalyst is Natural Gas Storage in ~39 minutes — a storage build above expectations would extend this leg sharply and aligns with the short thesis. Bearish momentum is being supplied, not faded.
Plan: Stop sits above the breakdown candle's open and the prior 2.80 support-turned-resistance zone — a reclaim there invalidates the breakdown thesis. Target is the Apr 13-14 congestion lows near 2.72, which also represents the floor of the prior multi-day base. The setup is disqualified if price reverses back through 2.815 before the storage print, or if the storage number comes in below expectations and triggers a sharp short-cover squeeze.
📍 Entry: 2.781
🛑 Stop: 2.815
🎯 Target: 2.72
⚖️ R:R: 1.79
2.88This channel is not providing individualized trading or investment advice, nor is it a banking service, brokerage service, trading service, investment service or money management service

Gold Price Forecast | Oil | Dollar | Silver | Natural Gas.0:00 Intro – Commodities Overview (Natural Gas, Oil, Dollar, Gold, Silver)
commodities update, natural gas analysis, oil analysis, US dollar outlook, gold and silver forecast, support resistance levels, weekly outlook
0:24 Natural Gas – Downtrend Continuation & Key Break Levels NYMEX:NG1!
natural gas analysis, bearish trend, lower highs lower lows, trendline resistance, support levels 2.6 and 2.4, reversal conditions
4:35 Oil – Structure Support vs Bearish Reversal Scenario NYMEX:CL1!
oil analysis, crude oil forecast, energy market outlook, support structure, lower high setup, inflation impact, oil vs stock market
7:09 US Dollar – Megaphone Pattern & Rate Narrative
US dollar analysis, DXY outlook, megaphone pattern, rate hikes vs cuts, inflation impact, currency trend
8:51 Gold – Rising Wedge & Weekly Downtrend Risk COMEX:GC1!
gold analysis, bearish rising wedge, weekly downtrend, resistance levels, gold price forecast, macro trend shift
12:20 Silver – Relative Strength vs Gold & Breakout Structure COMEX:SI1!
silver analysis, gold vs silver strength, breakout pattern, higher highs, metals outlook, bullish vs bearish scenarios
14:36 Outro – Weekly Outlook & Key Scenarios Ahead
commodities outlook next week, trading scenarios recap, technical analysis summary

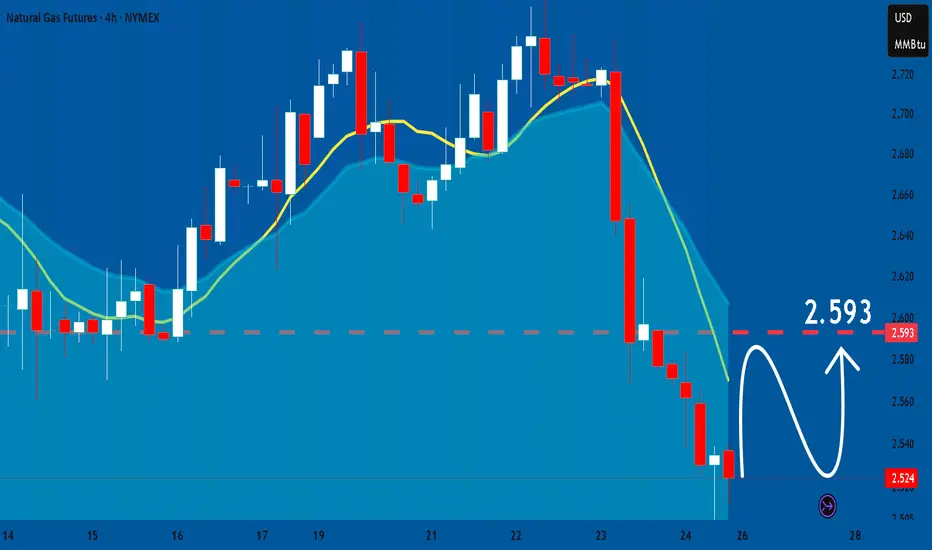
NATGAS Under Pressure! SELL!
My dear friends,
Please, find my technical outlook for NATGAS below:
The price is coiling around a solid key level - 2.675
Bias - Bearish
Technical Indicators: Pivot Points High anticipates a potential price reversal.
Super trend shows a clear sell, giving a perfect indicators' convergence.
Goal - 2.638
About Used Indicators:
The pivot point itself is simply the average of the high, low and closing prices from the previous trading day.
Disclosure: I am part of Trade Nation's Influencer program and receive a monthly fee for using their TradingView charts in my analysis.
———————————
WISH YOU ALL LUCK

Persian Gulf, industrial normalization will take timeThe energy crisis linked to military operations in the Middle East could persist over time this year, as it will not end on the first day of the end of the war between the United States, Israel and Iran. The oil and gas industrial system does not operate with a simple ON/OFF switch, so the imbalance between energy supply and demand worldwide will remain elevated even after the end of the conflict.
Can a major economic crisis be avoided?
The answer to this question will depend directly on the ability of Gulf countries to return to their production levels prior to Saturday, February 28. This normalization period will therefore be the dominant fundamental factor in the coming months, and companies in the region estimate that this timeframe will not be measured in days, but at best in weeks, or even months.
Overall, the following points can be retained:
• It will take on average two weeks to restart production facilities
• It will take on average two to three months to return to pre-crisis production volumes, but possibly up to six months to return to 100%
The histogram below shows that it will take at least 1 to 3 months for Persian Gulf countries to return to normal oil and natural gas production levels.
In detail, the situation remains highly heterogeneous across countries. Saudi Arabia, a pillar of the global oil market, will have to deal with partially damaged refining infrastructure and significant logistical constraints, which could delay a full return to normal. The United Arab Emirates and Kuwait appear slightly better positioned thanks to faster restarts, but remain dependent on their export capacities.
Conversely, countries such as Iraq or Iran could face significantly longer delays due to political, security and structural factors. Qatar, a key player in liquefied natural gas, will have to manage the technical complexity of its facilities, which explains longer normalization timelines.
Beyond technical capacities, the entire global supply chain is under strain: maritime transport, storage, insurance and financing. This prolonged disruption could maintain sustained pressure on energy prices.
As a result, even in the event of a rapid de-escalation of the conflict, markets will have to incorporate a scenario of slow normalization, with persistent effects on inflation and global growth.
The table below shows the estimated duration of normalization of the oil & natural gas industrial system in Persian Gulf countries from the moment military operations between the United States, Iran and Israel cease. Several months will be required to return to production levels prior to February 28.
DISCLAIMER:
This content is intended for individuals who are familiar with financial markets and instruments and is for information purposes only. The presented idea (including market commentary, market data and observations) is not a work product of any research department of Swissquote or its affiliates. This material is intended to highlight market action and does not constitute investment, legal or tax advice. If you are a retail investor or lack experience in trading complex financial products, it is advisable to seek professional advice from licensed advisor before making any financial decisions.
This content is not intended to manipulate the market or encourage any specific financial behavior.
Swissquote makes no representation or warranty as to the quality, completeness, accuracy, comprehensiveness or non-infringement of such content. The views expressed are those of the consultant and are provided for educational purposes only. Any information provided relating to a product or market should not be construed as recommending an investment strategy or transaction. Past performance is not a guarantee of future results.
Swissquote and its employees and representatives shall in no event be held liable for any damages or losses arising directly or indirectly from decisions made on the basis of this content.
The use of any third-party brands or trademarks is for information only and does not imply endorsement by Swissquote, or that the trademark owner has authorised Swissquote to promote its products or services.
Swissquote is the marketing brand for the activities of Swissquote Bank Ltd (Switzerland) regulated by FINMA, Swissquote Capital Markets Limited regulated by CySEC (Cyprus), Swissquote Bank Europe SA (Luxembourg) regulated by the CSSF, Swissquote Ltd (UK) regulated by the FCA, Swissquote Financial Services (Malta) Ltd regulated by the Malta Financial Services Authority, Swissquote MEA Ltd. (UAE) regulated by the Dubai Financial Services Authority, Swissquote Pte Ltd (Singapore) regulated by the Monetary Authority of Singapore, Swissquote Asia Limited (Hong Kong) licensed by the Hong Kong Securities and Futures Commission (SFC) and Swissquote South Africa (Pty) Ltd supervised by the FSCA.
Products and services of Swissquote are only intended for those permitted to receive them under local law.
All investments carry a degree of risk. The risk of loss in trading or holding financial instruments can be substantial. The value of financial instruments, including but not limited to stocks, bonds, cryptocurrencies, and other assets, can fluctuate both upwards and downwards. There is a significant risk of financial loss when buying, selling, holding, staking, or investing in these instruments. SQBE makes no recommendations regarding any specific investment, transaction, or the use of any particular investment strategy.
CFDs are complex instruments and come with a high risk of losing money rapidly due to leverage. The vast majority of retail client accounts suffer capital losses when trading in CFDs. You should consider whether you understand how CFDs work and whether you can afford to take the high risk of losing your money.
Digital Assets are unregulated in most countries and consumer protection rules may not apply. As highly volatile speculative investments, Digital Assets are not suitable for investors without a high-risk tolerance. Make sure you understand each Digital Asset before you trade.
Cryptocurrencies are not considered legal tender in some jurisdictions and are subject to regulatory uncertainties.
The use of Internet-based systems can involve high risks, including, but not limited to, fraud, cyber-attacks, network and communication failures, as well as identity theft and phishing attacks related to crypto-assets.

Gold Price Forecast | Oil | Dollar | Silver | Natural Gas.0:00 Intro – Commodities Overview (Natural Gas, Oil, Dollar, Gold, Silver)
commodities update, natural gas analysis, oil prices outlook, US dollar forecast, gold and silver analysis, support resistance levels, weekly market outlook
0:24 Natural Gas – Downtrend Continuation & Key Support Levels
natural gas analysis, NG downtrend, lower highs lower lows, weekly downtrend confirmation, support levels 2.6 and 2.4, RSI oversold strategy, trendline resistance, bounce setup vs continuation NYMEX:NG1!
4:42 Oil – USO Dark Pool Levels & Breakout vs Breakdown Scenario
oil analysis, crude oil prices, USO ETF dark pool, geopolitical impact oil, support 118 and 108, bullish structure vs breakdown, inflation impact, oil effect on stock market NYMEX:CL1!
6:54 US Dollar – DXY Trend & Rate Cut Expectations
US dollar analysis, DXY forecast, interest rates outlook, rate cuts vs rate hikes, inflation impact on dollar, macro trends currency market
8:24 Gold – Range Setup & Breakout Levels (5000 Target)
gold analysis, gold price prediction, resistance 4900, breakout to 5000 level, support resistance zones, inflation hedge, sideways consolidation COMEX:GC1!
10:05 Silver – Relative Strength vs Gold & Key Levels
silver analysis, silver price prediction, gold correlation, relative strength weakness, resistance 82 level, higher beta metals, consolidation range COMEX:SI1!
11:17 Outro – Commodities Outlook & Key Levels Next Week
commodities outlook next week, key levels to watch, trading plan recap, gold silver oil natural gas forecast

NG - looking like a falling wedgeHourly chart of Natgas here
Looks like a falling wedge
Natgas is always tricky so play via calls is the idea
This is a follow up on the previous idea mentioned for natgas

Natural Gas Breakout Confirmed (Swing Trade)📊 Natural Gas Breakout Confirmed (Swing Trade)
✅ Buy Level Triggered: 254 (Daily Close Above)
🚀 Outlook:
Strong bullish momentum after confirmed breakout. Holding above 254 signals continuation move.
🎯 Swing Targets:
T1: 270
T2: 290
T3: 305
🏁 Final Target: 324
🛑 Stop Loss:
Below 245 (Closing Basis)
📈 Strategy:
- Fresh entries on pullback near 254–258 zone
- Hold positions for swing move
- Trail SL as price moves higher
#NaturalGas #NG #Breakout #SwingTrading #TradingView #Commodities

2.72This channel is not providing individualized trading or investment advice, nor is it a banking service, brokerage service, trading service, investment service or money management service

#NATURALGAS #MCX Short term could see slide upto 190+ Levels#Naturalgas currently in the wave 2 correction, however the trend line break on weekly and close would confirm it to slide more to retest 195 levels before deciding the next move. Stay cautious and take calls accordingly.
Thankyou! Thankyou ! Thankyou.
Egambaram Ravichandran

NATGAS FREE SIGNAL|SHORT|
✅NATGAS bearish ICT breakout confirmed as price delivers below the supply zone after clearing buyside liquidity. Strong displacement shows downside continuation, with price targeting external sellside liquidity pools.
—————————
Entry: 2.734$
Stop Loss: 2.812$
Take Profit: 2.621$
Time Frame: 6H
—————————
SHORT🔥
✅Like and subscribe to never miss a new idea!✅

NATGAS Bearish Breakout! Sell!
Hello,Traders!
NATGAS breaks below a key supply area with strong bearish displacement, confirming downside intent. Failed retest and weak continuation suggest further drop targeting liquidity resting below. Time Frame 6H.
Sell!
Comment and subscribe to help us grow!
Check out other forecasts below too!

Gold Price Forecast | Oil | Dollar | Silver | Natural Gas0:00 Intro – Commodities Overview & Price Action Setup
commodities analysis, natural gas oil gold silver forecast, price action trading, support resistance levels, weekly trading outlook
0:30 Natural Gas – NG Analysis (Downtrend vs Bounce Setup) NYMEX:NG1!
natural gas analysis, NG price forecast, support resistance natural gas, trendline break, energy market outlook
5:56 Oil – Crude Oil Analysis (Geopolitics, Breakout or Pullback) NYMEX:CL1!
oil price analysis, crude oil forecast, USO dark pool, oil resistance levels, geopolitical impact oil
7:50 US Dollar – DXY Analysis (Uptrend & $100 Breakout Zone)
US dollar analysis, DXY forecast, dollar index resistance 100, forex market trends, breakout setup
9:13 Gold – XAUUSD Analysis (Structure Support & Trend Outlook) COMEX:GC1!
gold price analysis, XAUUSD forecast, gold support resistance, inflation hedge assets, precious metals outlook
11:20 Silver – XAGUSD Analysis (Follow Gold, Breakout Potential) COMEX:SI1!
silver price analysis, XAGUSD forecast, silver breakout, gold correlation, commodities trading
12:56 Outro – Key Levels & Weekly Outlook
commodities outlook next week, trading plan recap, key support resistance levels

NATGAS: Forecast & Technical Analysis
Balance of buyers and sellers on the NATGAS pair, that is best felt when all the timeframes are analyzed properly is shifting in favor of the buyers, therefore is it only natural that we go long on the pair.
Disclosure: I am part of Trade Nation's Influencer program and receive a monthly fee for using their TradingView charts in my analysis.
❤️ Please, support our work with like & comment! ❤️
